. 2024 Nov 2;15(1):9486.
doi: 10.1038/s41467-024-53772-7.

Single-molecule imaging and molecular dynamics simulations reveal early activation of the MET receptor in cells

Affiliations

Single-molecule imaging and molecular dynamics simulations reveal early activation of the MET receptor in cells

Yunqing Li et al. Nat Commun. .

Abstract

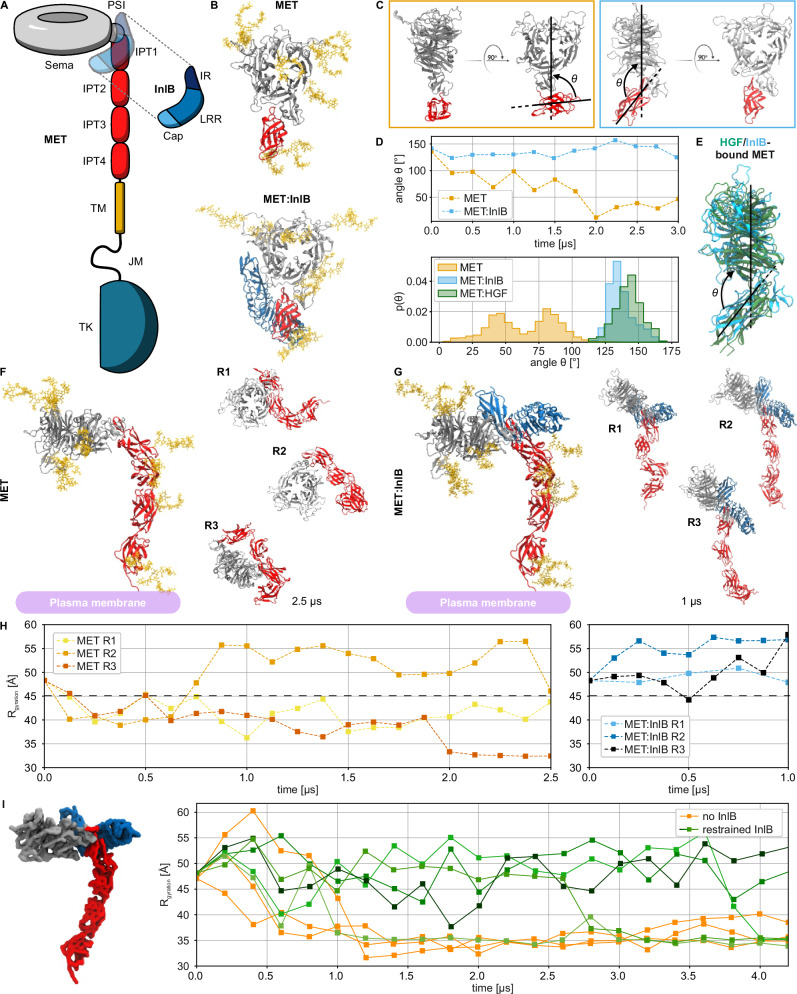
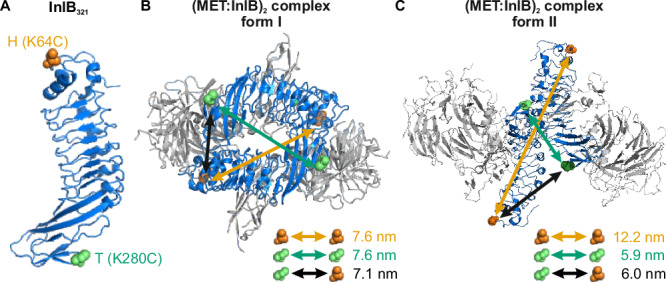
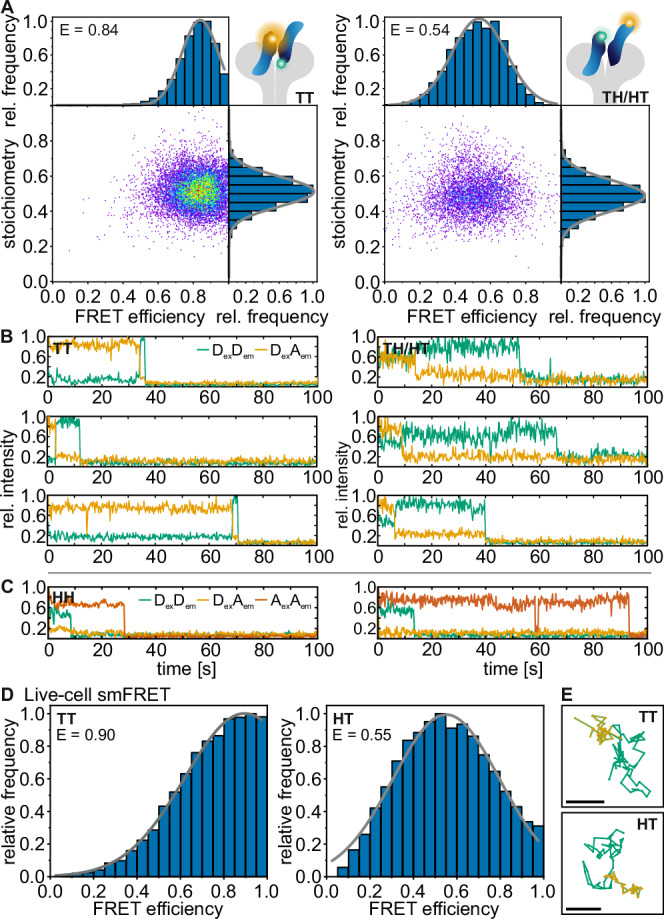
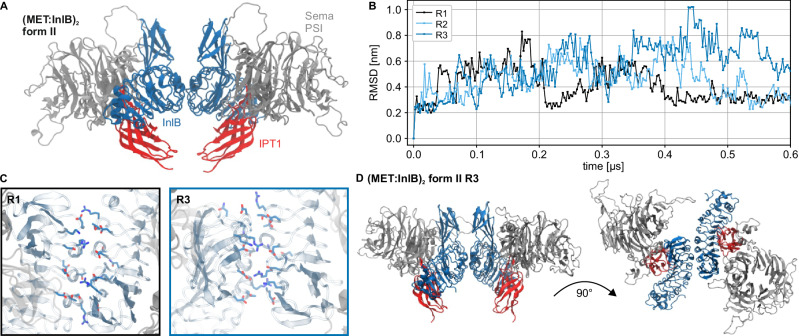
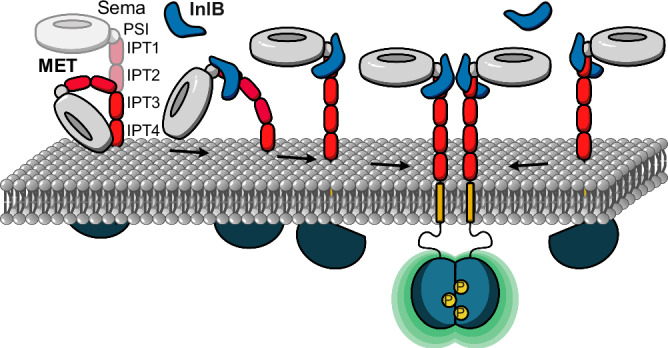
Embedding of cell-surface receptors into a membrane defines their dynamics but also complicates experimental characterization of their signaling complexes. The hepatocyte growth factor receptor MET is a receptor tyrosine kinase involved in cellular processes such as proliferation, migration, and survival. It is also targeted by the pathogen Listeria monocytogenes, whose invasion protein, internalin B (InlB), binds to MET, forming a signaling dimer that triggers pathogen internalization. Here we use an integrative structural biology approach, combining molecular dynamics simulations and single-molecule Förster resonance energy transfer (smFRET) in cells, to investigate the early stages of MET activation. Our simulations show that InlB binding stabilizes MET in a conformation that promotes dimer formation. smFRET reveals that the in situ dimer structure closely resembles one of two previously published crystal structures, though with key differences. This study refines our understanding of MET activation and provides a methodological framework for studying other plasma membrane receptors.


Conflict of interest statement

L.I. and H.d.J are listed as co-founders of the company Ardis S.r.l. All other authors declare no competing interests.

Figures

Fig. 1
Fig. 1. Structural characterization of MET and MET:InlB321 obtained with multi-scale MD simulations.
A Schematic representation of the MET receptor bound to InlB321. The ligand is represented transparently on the receptor structure. PSI: plexin-semaphorin-integrin, IPT: Ig-like, plexins, transcription factors, TM: transmembrane domain, JM: juxtamembrane, TK: tyrosine kinase, IR: inter-repeat region, LRR: leucine-rich repeat. B Renders of the N-glycosylated MET upper ectodomain system in isolation (top row, MET) and bound to InlB321 (bottom row, MET:InlB321). InlB is shown in blue; Sema and PSI in silver, the IPT1 in red, and the glycans in yellow; water and ions not shown for clarity). This representation is maintained for all renders except otherwise stated. C Side and front views of the conformations of MET (orange frame) and MET:InlB321 (blue frame) at the end of the upper ectodomain simulations. D Time series of the θ angle of MET and MET:InlB models (top panel) and histograms of the θ angle calculated from simulations of the MET:InlB321 model, the MET model, and the monomers in the MET dimer in complex with its endogenous ligand HGF (based on PDB 7MO7) (bottom panel). E Render of one of the monomers involved in the MET:HGF dimer aligned to the MET:InlB321 model. F Left: Render of the entire N-glycosylated MET ectodomain model in isolation. Right: Ectodomain configurations obtained by three replicas (R1–R3), each simulated for 2.5 µs. G Left: Render of the N-glycosylated MET entire ectodomain model bound to InlB321. Right: Ectodomain configurations obtained by three replicas (R1-R3), each simulated for 1 µs. H Radius of gyration (Rg) computed on the Cα atoms of the replicas of the MET entire ectodomain model (yellow to red) and of the MET:InlB321 entire ectodomain model (blue to black). The black dashed horizontal line at 45 Å indicates the threshold between extended (Rg > 45 Å) and collapsed conformations. I Left: render of the MET:InlB321 model in quasi-atomistic resolution. Right: radius of gyration of the quasi-atomistic models of MET (orange) and MET:InlB321 (green shades). Source data are provided as a Source Data file.
Fig. 2
Fig. 2. InlB321 site-specifically labeled variants in two possible MET:InlB dimer structures differing by the orientation of the MET:InlB monomers (MET in gray and InlB in blue).
A Two InlB variants, K64C (H variant, mutation site highlighted in orange) and K280C (T variant, mutation site highlighted in green), are labeled with donor and acceptor fluorophores for single-molecule FRET. The protein structure is adapted from PDB 1H6T. B Form I assembly of (MET741:InlB321)2 dimer. Donor-acceptor distances between various combinations of two InlB variants were determined by AV simulations, yielding 7.6 nm (H-H), 7.6 nm (T-T), and 7.1 nm (T-H/H-T). The protein structure is adapted from PDB 2UZX. C Form II assembly of (MET741:InlB321)2 dimer. Donor-acceptor distances between two InlB variants were determined by AV simulations, yielding 12.2 nm (H-H), 5.9 nm (T-T), and 6.0 nm (T-H/H-T). The protein structure is adapted from PDB 2UZY.
Fig. 3
Fig. 3. Single-molecule super-resolution imaging of MET receptor densities at the plasma membrane of various cell lines.
A dSTORM imaging of MET in U-2 OS cells. The super-resolution image (top), the widefield (WF) image (bottom), and the brightfield image (inset) are shown. The image is representative of four biological replicates. Scale bars 5 µm. B MET receptor cluster densities on the plasma membrane of different cell lines. The negative controls (orange) were obtained by incubating the cells with secondary antibodies without prior incubation with primary antibodies. The diamonds represent the receptor densities of single cells. The bounds of the boxes of the box plots display the 25th and 75th percentile, and the whiskers are the minima and maxima. In addition, the median (line) and the mean (square) are shown. Receptor densities were obtained from 16/13 (pos./neg.) (23132/87), 14/13 (HeLa), 19/12 (Huh7.5), 16/12 (U-2 OS), and 21/22 (U-251) cells from at least 3 independent experiments. Source data are provided as a Source Data file.
Fig. 4
Fig. 4. Single-molecule FRET of (MET:InlB321)2 dimers in U-2 OS cells.
A smFRET with alternating laser excitation in fixed cells. Left: E,S-histogram for InlB T-Cy3B and T-ATTO 647N (N = 113 smFRET traces from 64 cells, 4 independent experiments); Right: E,S-histogram for InlB T-Cy3B and H-ATTO 647N and InlB H-Cy3B and T-ATTO 647N variants (N = 49 smFRET traces from 39 cells, 5 independent experiments). B Exemplary smFRET trajectories showing donor (green, DexDem) and acceptor (orange, DexAem) intensity traces (direct activation of acceptor not shown for clarity). C Exemplary single-molecule intensity traces extracted from colocalized spots showing the fluorescence signal of H-Cy3B and H-ATTO 647N variants showing donor (green, DexDem), acceptor (orange, DexAem), and direct excitation of the acceptor (red, AexAem) fluorescence (see also Supplementary Fig. 7). Traces are normalized to 1. D Live-cell smFRET of (MET:InlB)2 dimers. FRET efficiency histograms of Cy3B-T-InlB321 and ATTO 647N-T-InlB321 (left, N = 564 smFRET traces from 27 cells, 5 independent experiments) and for Cy3B-H-InlB321 and ATTO 647N-T-InlB321 variants (right, N = 757 smFRET traces from 24 cells, 3 independent experiments). E Exemplary trajectories of single FRET pairs of the T-T and H-T combination. The donor trajectory is shown in green, while the acceptor trajectory (acceptor emission upon donor excitation, i.e., FRET signal) is shown in orange and simultaneously represents the colocalized movement of the donor and acceptor. Scale bars 500 nm. Source data are provided as a Source Data file.
Fig. 5
Fig. 5. Molecular dynamics simulation of the (MET:InlB321)2 dimer.
A Renders of the initial form II (MET:InlB321)2 complex model (Sema and PSI domain of MET in silver cartoon and IPT1 domain in red cartoon; InlB in blue cartoon. Water, ions, and glycans not shown for clarity). B RMSD time series of the form II (MET:InlB321)2 complex model replicas calculated with respect to the first frame. C Representative assemblies of the two different dimer interfaces explored during the simulations (InlB321 in cyan cartoon, MET in silver cartoon, positive side chains in blue, negative side chains in red). Replica 1 explored a broader dimer interface (black frame), while Replica 3 explored a more compact one (blue frame; water, ions, and glycans not shown for clarity). D Render of the proposed antisymmetric dimer structure (explored by R3, compact dimer interface) showing top view (top panel) and side view (bottom panel) (water, ions, and glycans not shown for clarity). Source data are provided as a Source Data file.
Fig. 6
Fig. 6. Mechanistic model of MET receptor activation upon InlB binding.
In the ligand-free state, the ectodomain of MET shows pronounced flexibility, while the binding of InlB stabilizes an extended conformation. The extended conformation facilitates the association of two MET:InlB complexes to form the signaling-active (MET:InlB)2 complex.

References

    1. Lemmon, M. A., Schlessinger, J. & Ferguson, K. M. The EGFR family: not so prototypical receptor tyrosine kinases. Cold Spring Harb. Perspect. Biol.6, a020768 (2014). - PMC - PubMed
    1. Yuzawa, S. et al. Structural basis for activation of the receptor tyrosine kinase KIT by stem cell factor. Cell130, 323–334 (2007). - PubMed
    1. Opatowsky, Y. et al. Structure, domain organization, and different conformational states of stem cell factor-induced intact KIT dimers. Proc. Natl. Acad. Sci. USA111, 1772–1777 (2014). - PMC - PubMed
    1. Chen, P.-H., Unger, V. & He, X. Structure of full-length human PDGFRβ bound to its activating ligand PDGF-B as determined by negative-stain electron microscopy. J. Mol. Biol.427, 3921–3934 (2015). - PMC - PubMed
    1. Ognjenović, J., Grisshammer, R. & Subramaniam, S. Frontiers in cryo electron microscopy of complex macromolecular assemblies. Annu. Rev. Biomed. Eng.21, 395–415 (2019). - PubMed

Publication types

MeSH terms

LinkOut - more resources