. 2024 Nov 2;14(1):26449.
doi: 10.1038/s41598-024-76186-3.

Five-gene prognostic model based on autophagy-dependent cell death for predicting prognosis in lung adenocarcinoma

Affiliations

Five-gene prognostic model based on autophagy-dependent cell death for predicting prognosis in lung adenocarcinoma

Zhanshuo Zhang et al. Sci Rep. .

Abstract

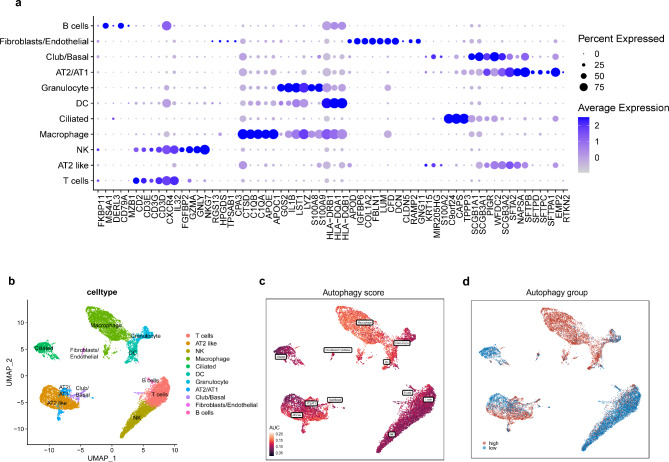
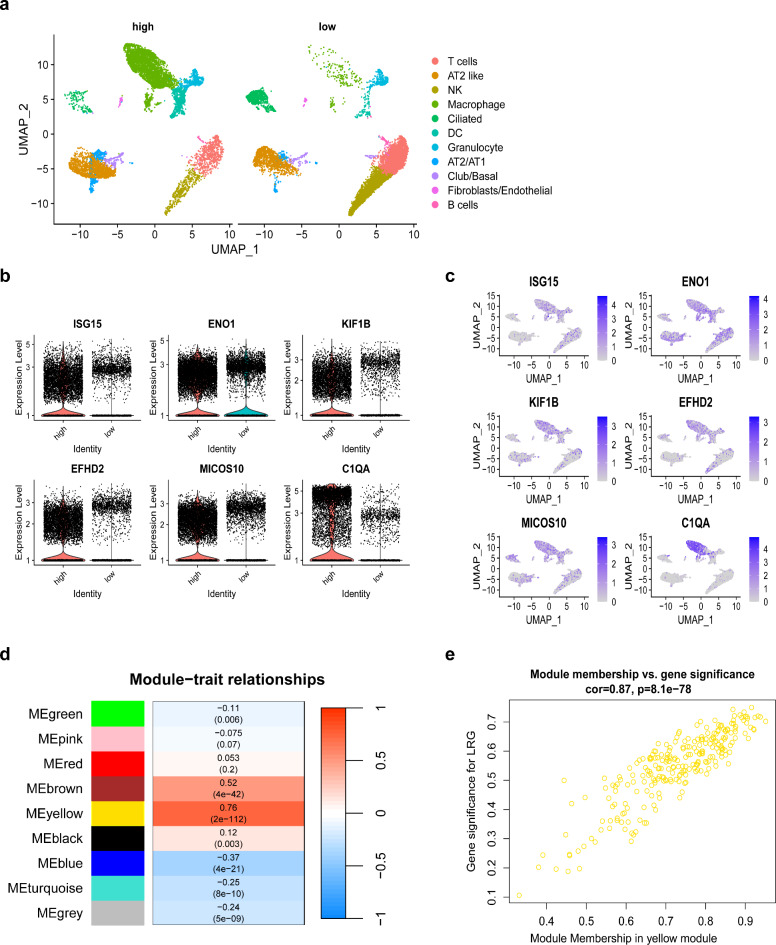
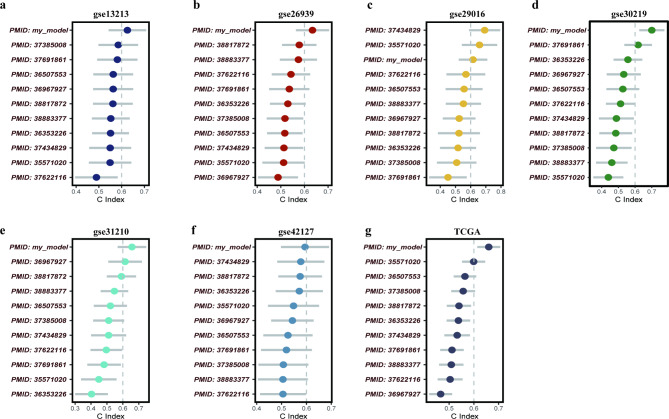
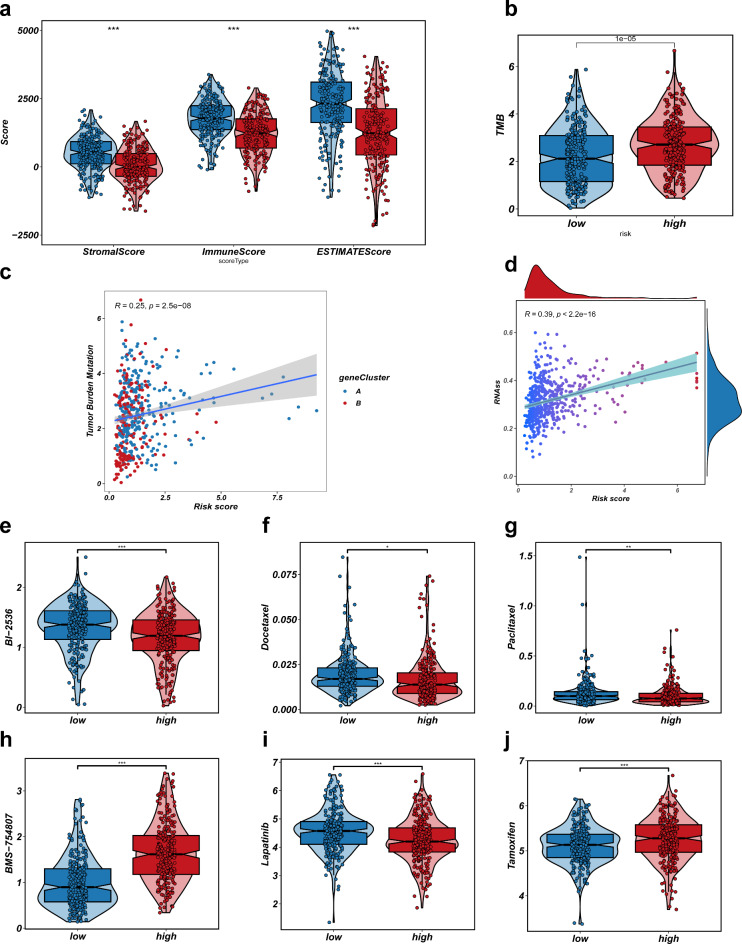
Non-small cell lung adenocarcinoma (LUAD) is the predominant form of lung cancer originating from lung epithelial cells, making it the most prevalent pathological type. Currently, reliable indicators for predicting treatment efficacy and disease prognosis are lacking. Despite extensive validation of autophagy-dependent cell death (ADCD) in solid tumor studies and its correlation with immunotherapy effectiveness and cancer prognosis, systematic research on ADCD-related genes in LUAD is limited. We utilized AddModuleScore, ssGSEA, and WGCNA to identify genes associated with ADCD across single-cell and bulk transcriptome datasets. The TCGA dataset, comprising 598 cases, was randomly divided into training and validation sets to develop an ADCD-related LUAD prediction model. Internal validation was performed using the TCGA validation set. For external validation, datasets GSE13213 (119 LUAD samples), GSE26939 (115 LUAD samples), GSE29016 (39 LUAD samples), and GSE30219 (86 LUAD samples) were employed. We evaluated the model's accuracy and effectiveness in predicting prognostic risk. Additionally, CIBERSORT, ESTIMATE, and ssGSEA techniques were used to explore immunological characteristics, drug response, and gene expression in LUAD. Real-time RT-PCR was conducted to assess variations in mRNA expression levels of the gene XCR1 between cancerous and normal tissues in 10 lung cancer patients. We identified 249 genes associated with autophagy-dependent cell death (ADCD) at both single-cell and bulk transcriptome levels. Univariate COX regression analysis revealed that 18 genes were significantly associated with overall survival (OS). Using LASSO-Cox analysis, we developed an ADCD signature based on five genes (BIRC3, TAP1, SLAMF1, XCR1, and HLA-DMB) and created the ADCD-related risk scoring system (ADCDRS). Validation of this model demonstrated its ability to predict disease prognosis and its correlation with clinical characteristics, immune cell infiltration, and the tumor microenvironment. To enhance clinical applicability, we integrated an ADCDRS nomogram. Furthermore, we identified potential drugs targeting specific risk subgroups. We successfully identified a model based on five ADCD genes to predict disease prognosis and treatment efficacy in LUAD, as well as to assess the tumor immune microenvironment. An efficient and practical ADCDRS nomogram was designed.

Keywords: Autophagy-dependent cell death; Immunotherapy; Lung adenocarcinoma; Non-small cell lung cancer; Tumor microenvironment.


Conflict of interest statement

The authors declare that the research was conducted in the absence of any commercial or financial relationships that could be construed as a potential conflict of interest.

Figures

Fig. 1
Fig. 1
Characteristics of Autophagy-Dependent Cell Death (ADCD) in Single-Cell Transcriptomes. (a) Cell annotation using bubble plots based on marker genes for different cell types in single-cell data. (b) UMAP-1 plot displaying cell types identified by marker genes. (c) ADCD activity scores in various cell types. (d)Grouping of ADCD activity scores in different cell types.
Fig. 2
Fig. 2
Identification of ADCD-Related Module Genes. (a) Cells are divided into high ADCD group and low ADCD group. (b) Violin plots of the top six ADCD-related DEGs identified at the single-cell sequence level. (c) UMAP plots of the top six ADCD-related DEGs identified at the single-cell sequence level. (d) Module-trait heatmap showing that the MEblue module is closely related to ADCD traits. (e) Scatter plot showing the relationship between gene significance (GS) and module membership (MM) in the yellow module.
Fig. 3
Fig. 3
Biological and Clinicopathological Characteristics of ADCD Subtypes. (a) Forest plot of univariate Cox regression analysis for ADCDR genes, identifying 18 significant genes with p-values less than 0.05. (b) Interaction between ADCD subtypes (red and blue indicate positive and negative correlations, respectively; the intensity of the correlation is indicated by the color shade). (c) Consensus matrix heatmap for two clusters (k = 2). (d) Kaplan-Meier OS curves for specific subtypes. (e) PCA analysis showing significant transcriptomic differences between the two subtypes. (f) Scatter plot showing the relationship between gene significance (GS) and module membership (MM) in the yellow module. (g) Scatter plot showing the relationship between gene significance (GS) and module membership (MM) in the yellow module.
Fig. 4
Fig. 4
ADCD Subtypes Associated with TME Infiltration. (a-b) DEG enrichment analysis between the two ADCD subtypes using GO. *p < 0.05, **p < 0.01, ***p < 0.001. (c-d) DEG enrichment analysis between the two ADCD subtypes using KEGG. *p < 0.05, **p < 0.01, ***p < 0.001. (e)C onsensus matrix heatmap defining the two clusters (k = 2). (f) Kaplan-Meier OS curves for the two gene subtypes. (g) Differences in clinicopathological characteristics between the two gene subtypes. (h) Expression changes of eighteen ADCDR genes in the two gene subtypes. ***p < 0.001.
Fig. 5
Fig. 5
Construction and Validation of the Predictive Model. (a-b) LASSO regression visualization to obtain the optimal λ when partial likelihood deviance reaches its minimum. (c-d) Distribution of patient survival status and ADCDRS scores in the training and testing sets. (e-p) Kaplan-Meier OS curves and ROC curves for the training set, testing set, validation set GSE13213, validation set GSE26939, validation set GSE29016, and validation set GSE30219, respectively, to verify the differences between high-risk and low-risk groups and predict 1-year, 3-year, and 5-year OS in the cohorts. *p < 0.05, ***p < 0.001.
Fig. 6
Fig. 6
A comparison of lung adenocarcinoma prognostic signatures based on gene expression. The C-index analysis of ADCDRS and 15 published signatures was conducted across the TCGA, GSE13213, GSE26939, GSE29016, GSE30219, GSE31210, and GSE42127 cohorts. Statistical test: two-sided z-score test. * p < 0.05; ** p < 0.01; *** p < 0.001; **** p < 0.0001.
Fig. 7
Fig. 7
Relationship Between ADCDRS Scores and Immune Cell Quantities. (a) The correlation between the quantity of immune cells and the five genes within the model. (b-i) The correlation between immune cell types and ADCDRS scores.
Fig. 8
Fig. 8
Relationship Between ADCDRS Scores, Tumor Microenvironment, Tumor Mutation Burden, and Drug Sensitivity Analysis. (a) The relationship between ADCDRS scores and stromal and immune cells in the tumor microenvironment. (b) Violin plot depicting differences in Tumor Mutation Burden (TMB) scores between high and low ADCDRS risk groups. (c) Spearman correlation analysis between ADCDRS scores and TMB. (d) The correlation between CSC index and CRG scores. (e-g) The relationship between ADCDRS scores and drug sensitivity (BI-2536, docetaxel, paclitaxel, BMS-754801, lapatinib, tamoxifen).
Fig. 9
Fig. 9
Differential Expression of XCR1 Gene in Normal and Tumor Tissues. (a) Expression of XCR1 gene in normal cells (BEAS-2B) and tumor cells (A549, PC9). (b) Expression of XCR1 gene in 10 pairs of normal and tumor tissues.

References

    1. Leiter, A., Veluswamy, R. R. & Wisnivesky, J. P. The global burden of lung cancer: current status and future trends. Nat. Rev. Clin. Oncol.20 (9), 624–639 (2023). - PubMed
    1. Li, S. et al. Coexistence of EGFR with KRAS, or BRAF, or PIK3CA somatic mutations in lung cancer: a comprehensive mutation profiling from 5125 Chinese cohorts. Br. J. Cancer. 110 (11), 2812–2820 (2014). - PMC - PubMed
    1. Kris, M. G. et al. Using multiplexed assays of oncogenic drivers in lung cancers to select targeted drugs. JAMA. 311 (19), 1998–2006 (2014). - PMC - PubMed
    1. Zhang, Y. L. et al. A systematic review and meta-analysis was conducted to determine the frequency of EGFR mutation in individuals diagnosed with non-small cell. lung cancer Oncotarget. 7 (48), 78985–78993 (2016). - PMC - PubMed
    1. Planchard, D. et al. Osimertinib with or without Chemotherapy in EGFR-Mutated Advanced NSCLC. N. Engl. J. Med.389 (21), 1935–1948 (2023). - PubMed

Substances