. 2024 Nov 2;14(1):26470.
doi: 10.1038/s41598-024-77469-5.

Spatially resolved gene expression profiles of fibrosing interstitial lung diseases

Affiliations

Spatially resolved gene expression profiles of fibrosing interstitial lung diseases

Seung J Kim et al. Sci Rep. .

Abstract

Fibrosing interstitial lung diseases (ILDs) encompass a diverse range of scarring disorders that lead to progressive lung failure. Previous gene expression profiling studies focused on idiopathic pulmonary fibrosis (IPF) and bulk tissue samples. We employed digital spatial profiling to gain new insights into the spatial resolution of gene expression across distinct lung microenvironments (LMEs) in IPF, chronic hypersensitivity pneumonitis (CHP) and non-specific interstitial pneumonia (NSIP). We identified differentially expressed genes between LMEs within each condition, and across histologically similar regions between conditions. Uninvolved regions in IPF and CHP were distinct from normal controls, and displayed potential therapeutic targets. Hallmark LMEs of each condition retained distinct gene signatures, but these could not be reproduced in matched lung tissue samples. Based on these profiles and unsupervised clustering, we grouped previously unclassified ILD cases into NSIP or CHP. Overall, our work uniquely dissects gene expression profiles between LMEs within and across different types of fibrosing ILDs.

Keywords: Digital spatial profiling; Gene expression; Interstitial lung disease; Lung microenvironment; Spatial transcriptomics.


Conflict of interest statement

The authors declare no competing interests.

Figures
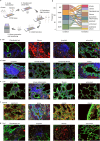
Fig. 1
Fig. 1
GeoMx workflow and summary of ILD conditions.(a) FFPE sections are stained with in situ hybridization probes and fluorescently tagged antibodies. Next, immunofluorescence imaging is used to select ROIs. These ROIs are exposed to UV light to photocleave oligonucleotide barcodes. Indexed libraries are generated from these barcodes and sequenced. (b) An alluvial diagram showing five conditions (left column), and matching annotations (right column). (c–g) Representative sections stained with immunofluorescence markers for indicated LMEs in each condition (blue: DNA; red: smooth muscle actin; yellow: CD45; green: pan-cytokeratin). Sampled ROIs are circled in white. Scale bars represent 50 µm.
Fig. 2
Fig. 2
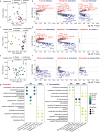
Gene expression profiles across pathologically distinct ROIs within each subtype of fibrosing ILDs. (a) PCA plot of ROIs in IPF grouped by annotation. (b) Volcano plots showing up (red) or downregulated (blue) genes for indicated comparisons between annotations in IPF. (c) PCA plot of ROIs in NSIP grouped by annotation. (d) Volcano plots showing up (red) or downregulated (blue) genes for indicated comparisons between annotations in NSIP. (e) PCA plot of ROIs in CHP grouped by annotation. (f) Volcano plots showing up (red) or downregulated (blue) genes for indicated comparisons between annotations in CHP. (g) GO “biological process” gene sets (y axis) that are overrepresented by significantly upregulated genes in indicated comparisons (x axis). Top horizontal labels indicate which condition a comparison belongs to. (h) GO “biological process” gene sets (y axis) that are overrepresented by significantly downregulated genes in indicated comparisons (x axis). Top horizontal labels indicate which condition a comparison belongs to. (b), (d), (e): horizontal and vertical dotted lines indicate log2 fold change of 1 and adjusted P value of 0.05, respectively. f.foci: fibroblastic foci. peripheral f: peripheral fibrosis. central f: central fibrosis. Inflam.: inflammatory.
Fig. 3
Fig. 3
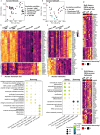
Gene expression profiles across subtypes of fibrosing ILDs. (a) PCA plot of ROIs (fibrosis or fibrotic foci) across IPF, NSIP and CHP. (b) Two clusters of top differentially expressed genes (sorted by F statistic) between central fibrosis of NSIP, fibrosis of CHP, fibrosis of IPF, and fibroblastic foci of IPF. Expression is shown as row-scaled Z scores. Each column represents a unique ROI that belongs to indicated annotation-subtype. A row dendrogram is shown on the left. (c) GO “biological process” gene sets (y axis) that are overrepresented by significantly downregulated genes in indicated comparisons (x axis). (d) PCA plot of ROIs that represent hallmarks of each subtype of fibrosing ILDs. (e) Two clusters of top differentially expressed genes (sorted by F statistic) between inflammatory regions of NSIP, granuloma of CHP, and fibroblastic foci of IPF as in (b). (f) GO “biological process” gene sets (y axis) that are overrepresented by differentially expressed genes in indicated comparisons (x axis). (g),(h) Expression of differentially expressed genes between fibrosis/fibroblastic foci ROIs or hallmark ROIs in matched bulk samples, respectively. f.foci: fibroblastic foci.
Fig. 4
Fig. 4
Gene expression profiles of uninvolved regions in IPF and CHP, and central regions in normal cases. (a) PCA plot of ROIs, grouped by condition. (b) Two clusters of top differentially expressed genes (sorted by F statistic) between uninvolved regions in IPF and CHP, and central regions in normal controls. Expression is shown as row-scaled Z scores. Each column represents a unique ROI that belongs to indicated annotation-subtype. A row dendrogram is shown on the left. (c) Top 5 overrepresented GO biological process pathways by significantly up or downregulated genes based on adjusted P value < 0.05 and absolute log2 fold change ≥ 1 in indicated comparisons. Dot size and color represent the number of genes in each pathway, and adjusted P value, respectively. (d) Volcano plots of differentially upregulated (red) or downregulated (blue) genes based on adjusted P value < 0.05 and absolute log2 fold change ≥ 1 for indicated pairwise comparisons between regions. (e) Venn diagrams of the number of up or downregulated genes in uninvolved regions of IPF or CHP compared to bona fide normal controls.
Fig. 5
Fig. 5
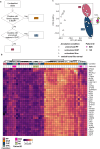
Classification of unclassified cases with gene expression profiles in fibrosis or uninvolved regions. (a) Flowchart depicting a strategy to group unclassified cases as one of IPF, CHP, or NSIP. (b) Heatmap of top (sorted by F statistic) differentially expressed genes between fibrotic regions across conditions that were identified in Fig. 3b. Expression is shown as row-scaled Z scores. Columns are clustered based on the complete agglomeration method. Patient ID and condition are indicated by color bars above the heatmap. (c) PCA plot showing central regions in bona fide normal (triangle), and uninvolved regions in IPF (circle), CHP (square), and unclassified cases (diamond). Clusters of IPF and CHP are enclosed in pink or blue ellipses, respectively. Unc.: unclassified.

Similar articles

References

    1. American Thoracic Society/European Respiratory Society International Multidisciplinary Consensus Classification of the Idiopathic Interstitial Pneumonias. Am J Respir Crit Care Med 165, 277–304 (2002).
    1. Ley, B., Collard, H. R. & King, T. E. Clinical course and prediction of survival in idiopathic pulmonary fibrosis. Am. J. Respir. Crit. Care Med. 183, 431–440 (2011). - PubMed
    1. Raghu, G. et al. An official ATS/ERS/JRS/ALAT statement: idiopathic pulmonary fibrosis: evidence-based guidelines for diagnosis and management. Am. J. Respir. Crit. Care Med. 183, 788–824 (2011). - PMC - PubMed
    1. Chambers, D. C. et al. The international thoracic organ transplant registry of the international society for heart and lung transplantation: thirty-eighth adult lung transplantation report—2021; focus on recipient characteristics. J. Heart Lung Trans. 40, 1060–1072 (2021). - PMC - PubMed
    1. Flaherty, K. R. et al. Idiopathic interstitial pneumonia: what is the effect of a multidisciplinary approach to diagnosis?. Am. J. Respir. Crit. Care Med. 170, 904–910 (2004). - PubMed

MeSH terms