. 2024 Dec;11(47):e2406714.
doi: 10.1002/advs.202406714. Epub 2024 Nov 3.

Epigenetic Activation of the CMTM6-IGF2BP1-EP300 Positive Feedback Loop Drives Gemcitabine Resistance in Pancreatic Ductal Adenocarcinoma

Affiliations

Epigenetic Activation of the CMTM6-IGF2BP1-EP300 Positive Feedback Loop Drives Gemcitabine Resistance in Pancreatic Ductal Adenocarcinoma

Ying-Qin Zhu et al. Adv Sci (Weinh). 2024 Dec.

Abstract

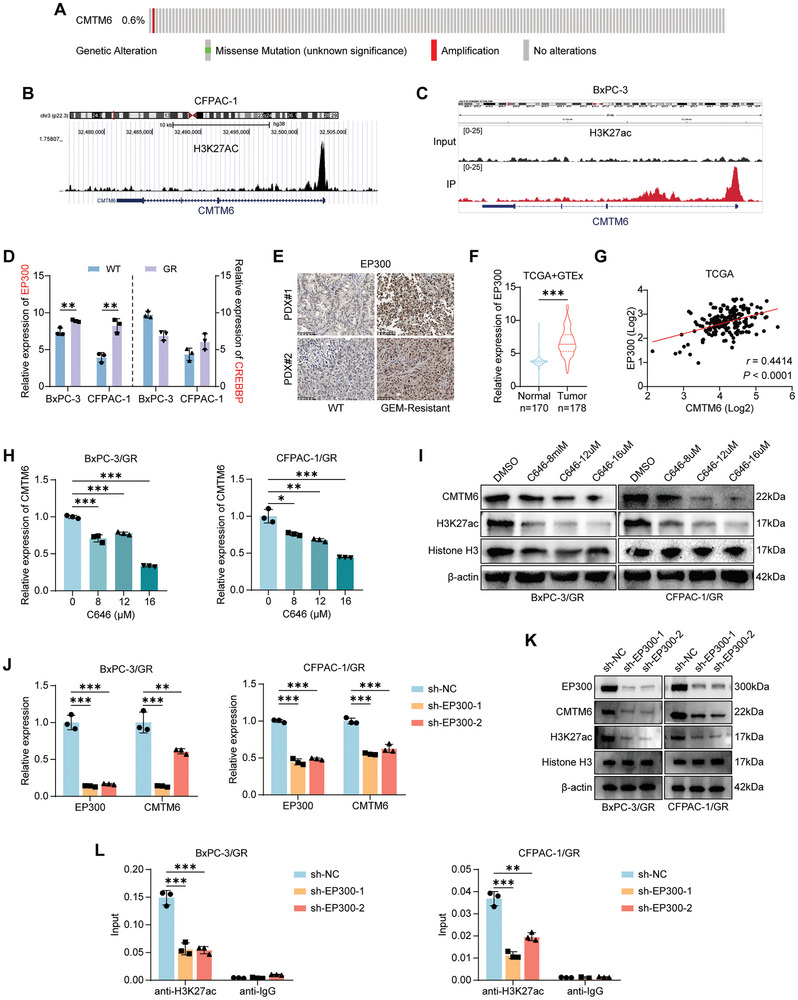
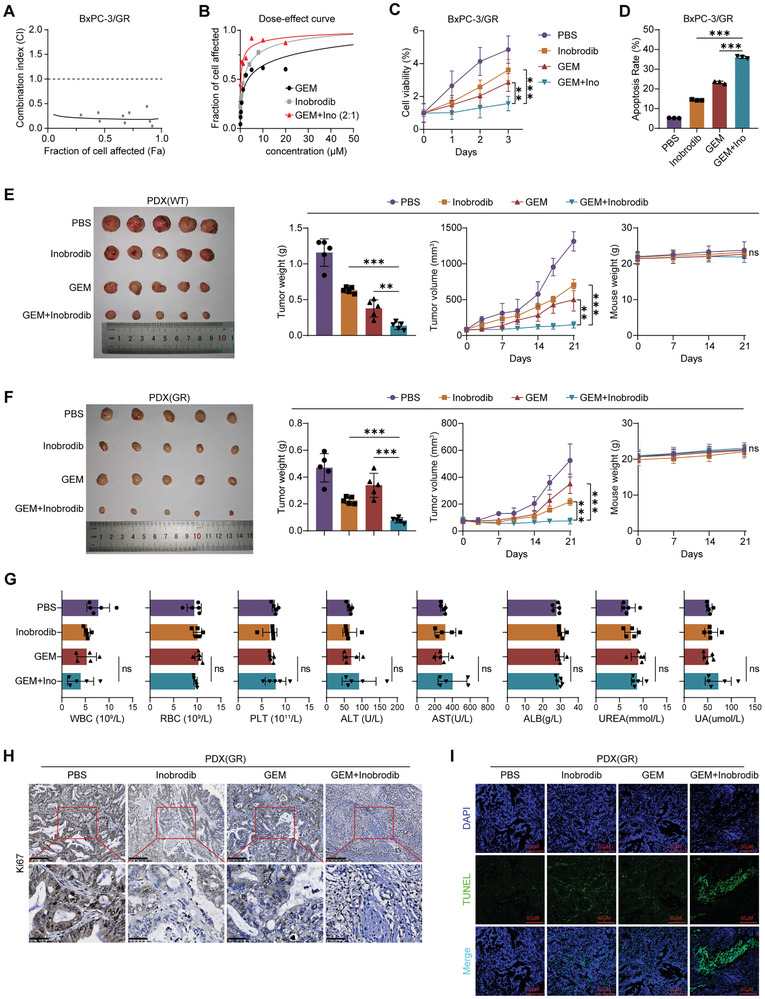
Pancreatic ductal adenocarcinoma (PDAC) is a highly malignant tumor with a dismal prognosis. Gemcitabine-based chemotherapy has emerged as a first-line treatment for PDAC. However, the development of gemcitabine resistance often results in therapeutic failure. In order to uncover the underlying mechanisms of gemcitabine resistance, gemcitabine-resistant PDAC cell lines and patient-derived xenograft (PDX) models are established and subjected to RNA sequencing. It is found that CMTM6 is closely related to gemcitabine resistance in PDAC. Multi-omics analysis revealed that EP300-mediated H3K27ac modification is involved in the transcriptional activation of CMTM6, which maintains IGF2BP1 expression by preventing its ubiquitination. The m6A reader IGF2BP1 stabilizes the EP300 and MYC mRNAs by recognizing m6A modifications, forming a positive feedback loop that enhances tumor stemness and ultimately contributes to PDAC resistance. The combined application of the EP300 inhibitor inobrodib and gemcitabine exerts a synergistic effect on PDAC. Overall, these findings reveal that the EP300-CMTM6-IGF2BP1 positive feedback loop facilitates gemcitabine resistance via epigenetic reprogramming and the combined use of inobrodib and gemcitabine represents a promising strategy for overcoming chemoresistance in PDAC, warranting further investigation in clinical trials.

Keywords: CMTM6; N6‐methyladenosine; chemoresistance; epigenetic modification; pancreatic ductal adenocarcinoma.


Conflict of interest statement

The authors declare no conflict of interest.

Figures

Figure 1
Figure 1
CMTM6 is upregulated in GEM‐resistant PDAC. A) Schematic representation of the establishment of wild‐type (WT) and GEM‐resistant (GR) PDX models from PDAC; B) Heatmaps displaying the gene expression profiles of WT and GR PDXs; C) Venn diagram depicting upregulated genes in GR BxPC‐3 and CFPAC‐1 cells (data from GEO database), GR PDXs (RNA‐seq), and PDAC tumor tissues (data from TCGA database); D) Representative images of IHC staining for CMTM6 in different passages of WT and GR PDXs. Scale Bars, 100 µm; E) Upregulated CMTM6 expression in BxPC‐3/GR and CFPAC‐1/GR cells (GSE140077 dataset); F) Elevated CMTM6 expression in PDAC tumor tissues compared to normal pancreatic tissues (TCGA and GTEx datasets); G) Kaplan‐Meier survival curves of PDAC patients stratified by CMTM6 expression levels (TCGA datasets); H) Dose‐dependent increase in CMTM6 expression in BxPC‐3 cells under GEM treatment; I) Time‐dependent increase in CMTM6 expression in BxPC‐3 cells under GEM treatment; J) Representative CT images illustrating GEM‐sensitive (progressive disease, PD) and GEM‐resistant (partial response, PR) PDAC tumors before and after GEM‐based chemotherapy (left). Multi‐immunofluorescence (mIF) staining for CMTM6 in corresponding needle biopsy specimens obtained before chemotherapy (right). Scale Bars, 30 µm; K) Statistical analysis of CMTM6 expression according to mIF results in PDAC tumors of PD and PR patients. Error bars represent the mean ± SD (n = 3 in E, H, and I). ** p < 0.01; *** p < 0.001 according to Student's t‐test.
Figure 2
Figure 2
EP300‐mediated epigenetic modification activates CMTM6 transcription in PDAC. A) Mutation frequency of CMTM6 in PDAC according to cBioPortal (http://www.cbioportal.org/); B) Bioinformatics analysis using Cistrome Data Browser (http://cistrome.org/) indicating enrichment of H3K27ac in the promoter of CMTM6 in CFPAC‐1 cells; C) H3K27ac ChIP‐seq data showing H3K27ac enrichment in the promoter of CMTM6 in BxPC‐3 cells; D) Comparison of EP300 and CREBBP expression levels in WT and BxPC‐3/GR and CFPAC‐1/GR cells (GSE140077); E) Representative images of IHC staining for EP300 in WT and GR PDXs. Scale Bar, 100 µm; F) Upregulation of EP300 expression in PDAC tumor tissues compared to normal pancreatic tissues (TCGA and GTEx datasets); G) Correlation between CMTM6 and EP300 mRNA expression (TCGA dataset); H) qPCR assays showing that mRNA levels of CMTM6 in BxPC‐3/GR and CFPAC‐1/GR cells decrease in a dose‐dependent manner under treatment with the EP300 inhibitor C646; I) Western blotting showing that protein expression of CMTM6 in BxPC‐3/GR and CFPAC‐1/GR cells decreases in a dose‐dependent manner under C646 treatment; J) Downregulation of CMTM6 mRNA levels in EP300‐knockout BxPC‐3/GR and CFPAC‐1/GR cells; K) Western blotting showing that protein expression of H3K27ac and CMTM6 in EP300‐KD PDAC cells (GR). L) ChIP‐qPCR analysis showing reduced H3K27ac enrichment in the CMTM6 promoter following EP300 knockdown in BxPC‐3/GR and CFPAC‐1/GR cells. Results represent three independent experiments in D and H‐L. Error bars represent the mean ± SD. ** p < 0.01; *** p < 0.001 according to Student's t‐test.
Figure 3
Figure 3
CMTM6 promotes GEM resistance in PDAC both in vitro and in vivo. A) qPCR and Western blotting verification of CMTM6 knockout and overexpression efficacy in BxPC‐3/GR and CFPAC‐1/GR cells; B) Influence of CMTM6 knockout and overexpression on IC50 values of GEM in BxPC‐3/GR cells; C‐E. Effects of CMTM6 knockout and overexpression on cell growth rate (C), apoptosis rates (D) and colony‐formation abilities (E) in BxPC‐3/GR cells treated with 500 nm GEM; F) Mice harboring xenografts derived from CMTM6 knockout and overexpressing BxPC‐3/GR cells were treated with GEM (25 mg kg−1, twice a week, intraperitoneally). Images of dissected tumors (left). Tumor growth curves, tumor weights, and mouse weights across groups (right); G) Representative images of IHC staining for Ki67 in xenografts from each group. Scale Bars, 200 µm (top) and 50 µm (bottom); H) Representative images of TUNEL analysis in xenografts from each group. Scale Bars, 60 µm. Results represent three independent experiments in A–E, and results represent five samples in F–H. Error bars represent the mean ± SD. * p < 0.05; ** p < 0.01; *** p < 0.001 according to Student's t‐test.
Figure 4
Figure 4
CMTM6 protects IGF2BP1 from ubiquitin‐mediated degradation. A) KEGG pathway enrichment analysis showing the pathways activated by CMTM6; B) CMTM6‐bound proteins in BxPC‐3/GR cells were purified by Co‐IP and identified by LC‐MS/MS. Scatterplots display proteins identified by LC‐MS/MS; C) The best unique peptide‐spectrum matches (PSM) of IGF2BP1; D) Co‐IP assays confirming the combination of CMTM6 and IGF2BP1 in BxPC‐3/GR cells; E) IF staining revealing the co‐localization of CMTM6 and IGF2BP1 in BxPC‐3/GR cells; F) Western Blotting showing the expression levels of IGF2BP1 in CMTM6 knockout and overexpressing BxPC‐3/GR cells; G) CMTM6 knockout and overexpressing BxPC‐3/GR cells were treated with 10 µm CHX to block protein synthesis, and the degradation rate of IGF2BP1 was measured by Western Blotting (left). The half‐life of IGF2BP1 protein is shown (right); H) CMTM6 knockout and overexpressing BxPC‐3/GR cells were treated with DMSO or 20 µm MG132 for 6 h to block proteasome‐mediated protein degradation, and the synthesis rate of IGF2BP1 was measured by Western Blotting; I) CMTM6 knockout and overexpressing BxPC‐3/GR cells were treated with 20 µm MG132 for 6 h, and the ubiquitination levels of IGF2BP1 were measured by IP assays. The results represent three independent experiments.
Figure 5
Figure 5
IGF2BP1 is responsible for CMTM6‐mediated GEM resistance in PDAC. A) Upregulation of IGF2BP1 expression in PDAC tumor tissues compared to normal pancreatic tissues (TCGA and GTEx datasets); B) Representative images of IHC staining for IGF2BP1 in WT and GR PDXs, Scale Bars, 100 µm; C) qPCR verification of IGF2BP1 knockout and overexpression efficacy in BxPC‐3/GR and CFPAC‐1/GR cells; D) Influence of IGF2BP1 knockout and overexpression on the cell growth rate of BxPC‐3/GR and CFPAC‐1/GR cells treated with 500 nm GEM; E) IGFB2P1 was overexpressed in CMTM6knockout cells. Cell growth curve showing that the cell proliferation of BxPC‐3/GR and CFPAC‐1/GR cells treated with 500 nm GEM is inhibited by CMTM6 knockout and rescued by IGF2BP1 overexpression; F) CMTM6 knockout promotes cell apoptosis in BxPC‐3/GR cells treated with 500 nm GEM, which is rescued by IGF2BP1 overexpression; G) IGF2BP1 was silenced using shRNA or BTYNB in CMTM6‐overexpressing cells. Cell growth curve showing that proliferation of BxPC‐3/GR and CFPAC‐1/GR cells treated with 500 nm GEM is accelerated by CMTM6 overexpression, which is abolished by IGF2BP1 silencing; H) CMTM6 overexpression represses cell apoptosis in BxPC‐3/GR cells treated with 500 nm GEM, which is rescued by IGF2BP1 silencing. The results represent three independent experiments. Error bars represent the mean ± SD. ** p < 0.01; *** p < 0.001 according to Student's t‐test.
Figure 6
Figure 6
IGF2BP1 maintains EP300 and MYC mRNA expression via m6A Modification. A) Venn diagram illustrating the overlap of genes containing m6A and IGF2BP1 binding sites, and those downregulated by IGF2BP1 knockout in PDAC cells; B) Integrative genomics viewer (IGV) plots visualizing the m6A binding sites and IGF2BP1 binding sites on EP300 and MYC mRNAs in BxPC‐3/GR cells; C) Quantification of EP300 and MYC mRNA expression levels after IGF2BP1 knockout and overexpression in BxPC‐3/GR cells; D) IGF2BP1‐knockout BxPC‐3/GR cells were treated with 5 µg mL−1 actinomycin D (ATCD) to block RNA synthesis, and the decay rate of EP300 and MYC mRNAs was measured by qPCR; E) RIP‐qPCR analysis using an IGF2PB1‐specific antibody and IgG control antibody confirming that IGF2BP1 binds to the mRNAs of EP300 and MYC; F) meRIP‐qPCR analysis using an m6A‐specific antibody confirming m6A binding sites on EP300 mRNA; G) Influence of CMTM6 knockout on the sphere formation efficiency of BxPC‐3/GR and CFPAC‐1/GR cells treated with 500 nm GEM; H) mIF staining for CMTM6 (red), IGF2BP1 (green) and EP300 (yellow) in GEM‐resistant and GEM‐sensitive needle biopsy specimens obtained before chemotherapy (n = 20). Scale Bars, 100 µm. The results represent three independent experiments. Error bars represent the mean ± SD. * p < 0.05; ** p < 0.01; *** p < 0.001 according to Student's t‐test.
Figure 7
Figure 7
Blocking the CMTM6/EP300 positive feedback loop sensitizes PDAC cells to GEM. A) Combination Index (CI) depicting the synergistic effect of GEM and Inobrodib on BxPC‐3/GR cells; B) Dose‐response curves illustrating the individual and combined treatment effects of GEM and Inobrodib on BxPC‐3/GR cells; C) Cell growth curves of BxPC‐3/GR cells treated with PBS, Inobrodib, GEM, or the combination of GEM and Inobrodib; D) Apoptosis assays revealing the effects of PBS, Inobrodib, GEM, and the combination of GEM and Inobrodib on BxPC‐3/GR cells; E) Mice harboring WT PDXs were treated with PBS, Inobrodib, GEM, and the combination of GEM and Inobrodib. Tumor photos, tumor weights, tumor volume growth curves, and mouse weights across groups are displayed. F) Mice harboring GR PDXs were treated with PBS, Inobrodib, GEM, and the combination of GEM and Inobrodib. Tumor photos, tumor weights, tumor volume growth curves, and mouse weights across groups are presented. G) Statistical analysis showing blood routine examination, liver function, and kidney function of mice in different treatment groups; H) Typical images of IHC staining for Ki67 in GR PDXs from different treatment groups. Scale Bars, 200 µm (top) and 50 µm (bottom); I) Representative images of TUNEL analysis in GR PDXs from different treatment groups. Scale Bars, 60 µm. Results represent three independent experiments in A‐D, and results represent five samples in D‐I. Error bars represent the mean ± SD. ** p < 0.01; *** p < 0.001; ns means p > 0.05 according to Student's t‐test.

Similar articles

Cited by

References

    1. Collaborators G. B. D. P. C., Lancet Gastroenterol. Hepatol. 2019, 4, 934. - PubMed
    1. Griffin J. F., Poruk K. E., Wolfgang C. L., Chin. J. Cancer Res. 2015, 27, 332. - PMC - PubMed
    1. Oettle H., Neuhaus P., Hochhaus A., Hartmann J. T., Gellert K., Ridwelski K., Niedergethmann M., Zulke C., Fahlke J., Arning M. B., Sinn M., Hinke A., Riess H., JAMA, J. Am. Med. Assoc. 2013, 310, 1473. - PubMed
    1. Zeng S., Pottler M., Lan B., Grutzmann R., Pilarsky C., Yang H., Int. J. Mol. Sci. 2019, 20, 4504. - PMC - PubMed
    1. Han W., Ding P., Xu M., Wang L., Rui M., Shi S., Liu Y., Zheng Y., Chen Y., Yang T., Ma D., Genomics 2003, 81, 609. - PubMed

MeSH terms

LinkOut - more resources