. 2024 Dec;11(47):e2405092.
doi: 10.1002/advs.202405092. Epub 2024 Nov 3.

Endosomal Trafficking Bypassed by the RAB5B-CD109 Interplay Promotes Axonogenesis in KRAS-Mutant Pancreatic Cancer

Affiliations

Endosomal Trafficking Bypassed by the RAB5B-CD109 Interplay Promotes Axonogenesis in KRAS-Mutant Pancreatic Cancer

Dingwen Zhang et al. Adv Sci (Weinh). 2024 Dec.

Abstract

Perineural invasion (PNI) represents a unique biological feature associated with poor prognosis in pancreatic ductal adenocarcinoma (PDAC), especially in the presence of KRAS mutations. Extracellular vesicle (EV)-packaged circular RNAs (circRNAs) function as essential mediators of tumor microenvironment communication, triggering PDAC cell invasion and distant metastasis. However, the regulatory mechanisms of EV-packaged circRNAs in the PNI of KRAS-mutant PDAC have not yet been elucidated. Herein, a KRASG12D mutation-responsive EV-packaged circRNA, circPNIT, which positively correlated with PNI in PDAC patients is identified. Functionally, KRASG12D PDAC-derived EV-packaged circPNIT promoted axonogenesis and PNI both in vitro and in vivo. Mechanistically, the circPNIT-mediated Rab5B-CD109 interplay bypassed traditional endosomal trafficking to anchor Rab5B to the lipid rafts of multivesicular bodies and packaged circPNIT into CD109+ EVs. Subsequently, CD109+ EVs delivered circPNIT to neurons by binding to TRPV1 and facilitating DSCAML1 transcription-induced axonogenesis, which in turn enhanced the PNI by activating the GFRα1/RET pathway. Importantly, circPNIT-loaded CD109+ EVs are established to dramatically promote PNI in a KRASG12D/+ Trp53R172H/+ Pdx-1-Cre mouse model. Collectively, the findings highlight the mechanism underlying how EV-packaged circRNAs mediate the PNI of KRAS-mutant PDAC cells through the Rab5B endosomal bypass, identifying circPNIT as an effective target for the treatment of neuro-metastatic PDAC.

Keywords: KRAS mutation; circular RNA; engineered extracellular vesicle; pancreatic cancer; perineural invasion.


Conflict of interest statement

The authors declare no conflict of interest.

Figures

Figure 1
Figure 1
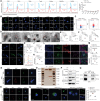
KRASG12D mutation is associated with axonogenesis and PNI in PDAC. A‐B) Representative images and quantification of PNI severity (A) and nerve density (B) in PDAC specimen from patients with the KRAS mutation (KRASWT , n = 71; KRASG12D , n = 266; KRASG12V , n = 144; KRASG12C , n = 49). Scale bars: 50 µm. The nonparametric Mann‒Whitney U test was used. C) Schematic illustration of the PNI‐associated transwell assay. (D‐E) Representative images D) and quantification of neural invasion and migration E) of KRAS subtypes PDAC cells treated with EVs. Scale bar: 50 µm. One‐way ANOVA followed by Dunnett's test was used. F) Representative DRG matrix images and quantification of EV‐treated PDAC cells with the indicated KRAS subtypes. Scale bar: 50 µm. One‐way ANOVA followed by Dunnett's test was used. G) Schematic illustration of the establishment of the orthotopic xenograft model of the KRAS‐mutant PDAC cells. H‐I) Representative H&E staining and mIHC images (H), and quantification (I) of PNI severity and nerve density in KRAS‐mutant PDAC. Scale bars: 50 µm. One‐way ANOVA followed by Dunnett's test was used. The data are presented as the mean ± SD of three independent experiments. *P < 0.05, **P < 0.01.
Figure 2
Figure 2
KRASG12D PDAC‐derived EV‐packaged circPNIT enhances axonogenesis in vitro. A) Schematic representation of circPNIT screening in KRASG12D PDAC tissues, high PNI PDAC tissues, and PDAC patient serum EVs. B‐D) The qRT‒PCR analysis of circPNIT expression in PDAC tissues (B), PDAC with KRAS mutation (KRASWT : n = 71; KRASG12D : n = 266; KRASG12V : n = 144; KRASG12C : n = 49) (C), and PDAC with different PNI severity (D). The nonparametric Mann‒Whitney U test was used. E) Representative H&E and ISH images and percentages of PNI in KRASG12D PDAC patients according to the circPNIT expression level. Scale bars: 50 µm. Original magnification, × 4 (insets in E). The χ2 test was used to assess statistical significance. F‐G) Representative Matrigel/DRG images and quantification of neural invasion and outgrowth in PANC‐1 cells treated with the indicated EVs. Scale bar: 50 µm. One‐way ANOVA followed by Dunnett's test and a 2‐tailed Student's t test was used. H‐K) Representative images and quantification of nerve density in DRG cells treated with the indicated EVs. Scale bar: 50 µm. One‐way ANOVA followed by Dunnett's test and a 2‐tailed Student's t test was used. L) Schematic illustration of the EV‐induced DRG‐matrix assays. M‐N) Representative DRG‐matrix images and quantification of neural invasion by PANC‐1 cells treated with the indicated EVs. Scale bar: 50 µm. One‐way ANOVA followed by Dunnett's test and a 2‐tailed Student's t test was used. The data are presented as the mean ± SD of three independent experiments. *P < 0.05, **P < 0.01.
Figure 3
Figure 3
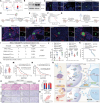
circPNIT packaged in EVs promoted the neural metastasis of KRASG12D PDAC cells in vivo. A) Representative images of the EV‐induced orthotopic xenograft model and PET‐CT image. B) The PNI ratio of the primary tumor tissues treated with indicated EVs (n = 12 per group). The statistical differences between the groups were calculated using the χ2 test. C‐D) Representative mIHC images (C) and quantification of neural invasion (D) in PANC‐1 cells treated with the indicated EVs. Scale bar: 50 µm. A 2‐tailed Student's t test was used. E‐F) Representative mIHC images (E) and quantification of nerve density (F) in PANC‐1 cells treated with the indicated EVs. Scale bar: 50 µm. A 2‐tailed Student's t test was used. G) Schematic illustration of the establishment of the EV‐induced in vivo model of neural infiltration. H) The nerve function scores of nude mice inoculated with PANC‐1 cells and treated with PBS or the indicated EVs (n = 6 per group). One‐way ANOVA followed by Dunnett's test was used. I) Representative images of neural invasion monitored by MRI; the circles indicate tumors. J‐K) Representative H&E images (J) and quantification (K) of neural invasion were determined by measuring the length and area between the injection and invasion sites. Scale bar: 50 µm. One‐way ANOVA followed by Dunnett's test was used. L‐M) Representative images (L) and quantification (M) of sciatic nerve volume. Scale bar: 1 cm. One‐way ANOVA followed by Dunnett's test was used. The data are presented as the mean ± SD of three independent experiments. *P < 0.05, **P < 0.01.
Figure 4
Figure 4
circPNIT binds to Rab5B and CD109 to form a ternary complex. A,B) Silver staining and mass spectrometry of the proteins from the RNA pull‐down assay. C) Western blot analysis confirmed that circPNIT was associated with CD109, and Rab5B. D) RIP assays confirmed that circPNIT interacted with CD109 and Rab5B. Negative control: IgG; nonspecific control: U1. E) Immunofluorescence was performed to assess the colocalization of circPNIT, CD109, and Rab5B in PANC‐1 cells. Scale bars: 5 µm. F) Sequential deletion assays confirmed that 401–514 nt of circPNIT is essential for binding Rab5B to CD109. G) Prediction of the stem‐loop structures of the CD109/Rab5B binding sites in circPNIT on the basis of CatRapid, a website for indicating the binding sites between non‐coding RNA and targeting proteins. H‐I) RIP assay showed that circPNIT enrichment of CD109 and Rab5B was effectively inhibited by mutations of 451–502 nt and 426–477 nt in circPNIT. J) Schematic illustration of the mechanism by which circPNIT promotes the binding of CD109 to Rab5B. K‐M) Co‐IP K and L) and IF M) assays analyzing the interaction between circPNIT‐mediated CD109 and Rab5B in PANC‐1 cells. N) Co‐IP assays analyzing the interaction between CD109 and Rab5B after the circPNIT426‐502nt mutation in PANC‐1 cells. O) Schematic representation of the circPNIT/CD109/Rab5B complex localization in MVBs. P) Representative IF images showing CD63 and Rab5B colocalization mediated by CD109 in PANC‐1 cells. Scale bar: 5 µm. Q‐R) Co‐IP revealing the interaction of His‐labeled Rab5B with FLOT1 in PANC‐1 cells. S‐T) IF assays were performed to evaluate the localization between Rab5B and FLOT1, which was regulated by CD109 and circPNIT. U) Assessment of circPNIT expression in PANC‐1 cell‐secreted EVs after knockdown of Rab5B. V) Evaluation of circPNIT expression in PANC‐1 cell‐secreted EVs after treated by MβCD and si‐FLOT1. W) Analysis of CD109 expression in PANC‐1 cell‐secreted EVs after Rab5B was knocked down. X) Evaluation of CD109 expression in EVs secreted by Rab5B‐overexpressing PANC‐1 cells after lipid raft inhibition. Statistical significance was assessed using a 2‐tailed Student's t test (Figures D, H, and I) and one‐way ANOVA followed by Dunnett's test (Figures U and V). The data are presented as the mean ± SD of three independent experiments. *P < 0.05, **P < 0.01.
Figure 5
Figure 5
EV‐packaged circPNIT specifically targets neurons via the CD109‐TRPV1 interplay. A) Flow cytometric analysis and quantification of EVs taken up by stromal cells in the tumor microenvironment of PKH67‐labeled PANC‐1‐EVWT or PANC‐1‐EVcircPNIT‐KO cells. B) Representative IF images of stromal cells treated with PKH67‐labeled PANC‐1‐EVWT or PANC‐1‐EVcircPNIT‐KO cells. Scale bar: 5 µm. C) Nanoflow cytometric analysis confirmed the expression of CD109 in EVs derived from PANC‐1‐EVVector or PANC‐1‐EVRab5B cells. D) Representative electron microscopy image of EVs secreted by PANC‐1 and AsPC‐1 cells as indicated. E‐F) qRT‒PCR analysis of circPNIT expression in DRG treated with the indicated EVs. G‐H) Representative IF images (G) and quantification (H) of DRG cells treated with PKH67‐labeled PANC‐1‐EVVector, PANC‐1‐EVcircPNIT or PANC‐1‐EVcircPNIT+αCD109. Scale bar: 5 µm. I) Flow cytometric analysis of DRG cells treated with PKH67‐labeled PANC‐1‐EVVector, PANC‐1‐EVcircPNIT, or PANC‐1‐EVcircPNIT+αCD109 cells. J‐K) qRT‒PCR analysis of circPNIT expression in DRG cells treated with the indicated EVs. L‐M) Representative mIHC images (L) and quantification (M) of EVs in the perineural region from primary tumor tissues treated with the indicated EVs. Scale bar: 50 µm. N) Representative PLA images showing the localization of GST‐CD109 on the surface of DRG cells. Scale bar: 50 µm. O,P) Representative silver staining (O) and GST pull‐down assay (P) of CD109 combined with the TRPV1 protein in DRG cells. Q) Co‐IP confirmed the interaction between CD109 and TRPV1. R) Representative PLA images showing the colocalization of CD109 and TRPV1 in the DRG membrane. Scale bar: 50 µm. S) Representative IF and quantification of PANC‐1‐EVCD109‐treated DRG cells with or without TRPV1 knockdown. Scale bar: 50 µm. Statistical significance was assessed using a 2‐tailed Student's t test, as shown in Figure A (right panel), and one‐way ANOVA followed by Dunnett's test, as shown in Figures E‐F, H, J‐K, M, and S (right panel). The data are presented as the means ± SDs of three independent experiments. *P < 0.05, **P < 0.01.
Figure 6
Figure 6
CD109+ EV‐packaged circPNIT induced axonogenesis to foster PNI. A) Axonogenesis associated biological process enrichment of differentially expressed genes identified from three pairs of DRG cells treated with PANC‐1‐EVVector or PANC‐1‐EVcircPNIT. B) Heatmap of differentially expressed genes enriched in the GO biological process category associated with axonogenesis. C‐D) qRT‒PCR analysis of DSCAML1 expression in DRG cells treated with the indicated EVs. E) Transcriptional activity of DSCAML1 in DRG cells treated with truncated DSCAML1 promoter luciferase plasmids and EVs derived from PANC‐1 cells. F) Schematic representation of the predicted circPNIT binding sites in the DSCAML1 promoter. G) ChIRP assays detected circPNIT‐associated chromatin fragments in the DSCAML1 promoter in DRG cells. H) Luciferase activity in DRG cells treated with DSCAML1‐P3 promoter mutant luciferase plasmids and EVs derived from PANC‐1 cells. I‐J) ChIPChr‒qPCR assay of H3K9Ac enrichment on the DSCAML1 promoter in DRG cells treated with EVs derived from PANC‐1 cells as indicated. K‐L) Representative Matrigel/DRG images K) and quantification L) of neural invasion and outgrowth in PANC‐1 cells treated with the indicated EVs. Scale bar: 50 µm. M‐N) Representative images (M) and quantification (N) of the nerve density of DRG cells treated with EVs secreted by PANC‐1 and AsPC‐1 cells as indicated. O‐P) Western blotting of crucial proteins in the GFRα1/RET and MAPK/ERK signaling pathways in DRG cells treated with EVs derived from PANC‐1 cells as indicated. Q) Representative transwell images and quantification of the migration and invasion of PANC‐1 cells treated with EVs. Scale bar: 50 µm. R) Representative DRG‐matrix images and quantification of neural invasion by PANC‐1 cells treated with the indicated EVs and the GFRα1/RET inhibitor AST‐487. Scale bar: 50 µm. Statistical significance was assessed using a 2‐tailed Student's t test (Figures E, G, H, and J). One‐way ANOVA followed by Dunnett's test was used in Figures C‐D, I, L, N, and Q‐R(right panel). The data are presented as the mean ± SD of three independent experiments. *P < 0.05, **P < 0.01.
Figure 7
Figure 7
CD109+EVs‐mediated targeted delivery of circPNIT promotes axonogenesis and PNI of KRASG12D PDAC in mice. A,B) The nanoflow cytometric analysis (A) and western blotting (B) were used to evaluate the expression of CD109 in Engineered EV. C) Representative images the circPNIT targeting engagement in the PANC‐1 induced tumor tissue. Scale bar: 5 µm. D) Schematic illustration of the establishment of the EV‐induced orthotopic xenograft model. E) Quantification of the PNI severity and nerve density in the primary tumor tissues treated with indicated EVs. F) The survival times of the mice treated with indicated EVs. G) Schematic illustration of the KPC spontaneous tumorigenesis mouse model. H‐I) Representative mIHC images (H) and quantification of neural invasion (I). Scale bar: 50 µm. One‐way ANOVA followed by Dunnett's test was used. J) Quantification of PNI severity and nerve density in KPC mouse tumor tissue treated with indicated EVs. Scale bar: 50 µm. One‐way ANOVA followed by Dunnett's test was used. K) Kaplan‐Meier analysis of survival time after treatment with indicated EVs. L) qRT‒PCR analysis of cirPNIT expression in serum EVs obtained from 266 KRASG12D PDAC patients with high PNI or low PNI. The nonparametric Mann‒Whitney U test was used. M‐N) Kaplan‐Meier survival analysis of OS and DFS in patients with KRASG12D PDAC according to the EV‐packaged circPNIT expression level (the cutoff value was the median). O‐P) Representative H&E and IHC images (O) and percentages (P) of PNI in KRASG12D PDAC patients according to EV‐packaged circPNIT expression. Scale bars: 50 µm. The χ2 test was used to assess statistical significance. Q) Correlation analysis of DSCAML1 expression in tumor tissues and serum circPNIT levels in a cohort of 266 patients with KRASG12D PDAC. R) The proposed model of how KRASG12D PDAC‐secreted EV‐packaged circPNIT induces the DSCAML1/GFRα1/RET axis to promote axonogenesis and PNI in KRASG12D PDAC. The data are presented as the mean ± SD of three independent experiments. *P < 0.05, **P < 0.01.

References

    1. a) Kanda M., Matthaei H., Wu J., Hong S.‐M., Yu J., Borges M., Hruban R. H., Maitra A., Kinzler K., Vogelstein B., Goggins M., Gastroenterology 2012, 142, 730; - PMC - PubMed
    2. b) Li S., Balmain A., Counter C. M., Nat. Rev. Cancer 2018, 18, 767. - PubMed
    1. Siegel R. L., Miller K. D., Wagle N. S., Jemal A., CA Cancer J Clin 2023, 73, 17. - PubMed
    1. a) Lemstrova R., Brynychova V., Hughes D. J., Hlavac V., Dvorak P., Doherty J. E., Murray H. A., Crockard M., Oliverius M., Hlavsa J., Honsova E., Mazanec J., Kala Z., Lovecek M., Havlik R., Ehrmann J., Strouhal O., Soucek P., Melichar B., Mohelnikova‐Duchonova B., Oncol Lett 2017, 14, 5980; - PMC - PubMed
    2. b) Nakao A., Harada A., Nonami T., Kaneko T., Takagi H., Pancreas 1996, 12, 357; - PubMed
    3. c) Amit M., Na'ara S., Gil Z., Nature reviews. Cancer 2016, 16, 399. - PubMed
    1. a) Chang W.‐H., Nguyen T.‐T. T., Hsu C.‐H., Bryant K. L., Kim H. J., Ying H., Erickson J. W., Der C. J., Cerione R. A., Antonyak M. A., Cancer Lett 2021, 517, 66; - PMC - PubMed
    2. b) Luo Y., Li Z., Kong Y., He W., Zheng H., An M., Lin Y., Zhang D., Yang J., Zhao Y., Chen C., Chen R., J. Clin. Invest. 2022, 132, 157644. - PMC - PubMed
    1. a) Kamerkar S., LeBleu V. S., Sugimoto H., Yang S., Ruivo C. F., Melo S. A., Lee J. J., Kalluri R., Nature 2017, 546, 498; - PMC - PubMed
    2. b) Cheng L., Hill A. F., Nat. Rev. Drug Discov. 2022, 21, 379. - PubMed

MeSH terms