Randomized Controlled Trial
. 2024 Dec 24;332(24):2068-2080.
doi: 10.1001/jama.2024.22362.

A Digital Health Behavior Intervention to Prevent Childhood Obesity: The Greenlight Plus Randomized Clinical Trial

Affiliations
Randomized Controlled Trial

A Digital Health Behavior Intervention to Prevent Childhood Obesity: The Greenlight Plus Randomized Clinical Trial

William J Heerman et al. JAMA. .

Abstract

Importance: Infant growth predicts long-term obesity and cardiovascular disease. Previous interventions designed to prevent obesity in the first 2 years of life have been largely unsuccessful. Obesity prevalence is high among traditional racial and ethnic minority groups.

Objective: To compare the effectiveness of adding a digital childhood obesity prevention intervention to health behavior counseling delivered by pediatric primary care clinicians.

Design, setting, and participants: Individually randomized, parallel-group trial conducted at 6 US medical centers and enrolling patients shortly after birth. To be eligible, parents spoke English or Spanish, and children were born after 34 weeks' gestational age. Study enrollment occurred between October 2019 and January 2022, with follow-up through January 2024.

Interventions: In the clinic-based health behavior counseling (clinic-only) group, pediatric clinicians used health literacy-informed booklets at well-child visits to promote healthy behaviors (n = 451). In the clinic + digital intervention group, families also received health literacy-informed, individually tailored, responsive text messages to support health behavior goals and a web-based dashboard (n = 449).

Main outcomes and measures: The primary outcome was child weight-for-length trajectory over 24 months. Secondary outcomes included weight-for-length z score, body mass index (BMI) z score, and the percentage of children with overweight or obesity.

Results: Of 900 randomized children, 86.3% had primary outcome data at the 24-month follow-up time point; 143 (15.9%) were Black, non-Hispanic; 405 (45.0%) were Hispanic; 185 (20.6%) were White, non-Hispanic; and 165 (18.3%) identified as other or multiple races and ethnicities. Children in the clinic + digital intervention group had a lower mean weight-for-length trajectory, with an estimated reduction of 0.33 kg/m (95% CI, 0.09 to 0.57) at 24 months. There was also an adjusted mean difference of -0.19 (95% CI, -0.37 to -0.02) for weight-for-length z score and -0.19 (95% CI, -0.36 to -0.01) for BMI z score. At age 24 months, 23.2% of the clinic + digital intervention group compared with 24.5% of the clinic-only group had overweight or obesity (adjusted risk ratio, 0.91 [95% CI, 0.70 to 1.17]) based on the Centers for Disease Control and Prevention criteria of BMI 85th percentile or greater. At that age, 7.4% of the clinic + digital intervention group compared with 12.7% of the clinic-only group had obesity (adjusted risk ratio, 0.56 [95% CI, 0.36 to 0.88]).

Conclusions and relevance: A health literacy-informed digital intervention improved child weight-for-length trajectory across the first 24 months of life and reduced childhood obesity at 24 months. The intervention was effective in a racially and ethnically diverse population that included groups at elevated risk for childhood obesity.

Trial registration: ClinicalTrials.gov Identifier: NCT04042467.


Conflict of interest statement

Conflict of Interest Disclosures: Dr Sanders reported serving as a paid advisor to Medeloop.ai, an artificial intelligence–driven platform that supports clinical research, which was not related to this study. Dr Flower reported previously reviewing abstracts for Patient-Centered Outcomes Research Institute (PCORI)–funded studies unrelated to this study. No other disclosures were reported.

Figures

Figure 1.
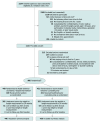
Figure 1.. Flow of Participants Through a Trial of a Digital Health Behavior Intervention to Prevent Childhood Obesity
The clinic + digital intervention group received health behavior counseling delivered by pediatric primary care clinicians plus the digital intervention (ie, text messages and web dashboard); the clinic-only group received health behavior counseling only. Additional information about the 6-, 12-, and 18-month time points, and text message discontinuation within the clinic + digital intervention group, is shown in eFigure 4 in Supplement 2; the number of measures across the trial for each child is shown in eFigures 5 and 6 in Supplement 2. aCould be more than 1 criterion not met. bRandomization was stratified by medical center, parent preferred language, and baseline health literacy level. cAll intervention participants received at least 1 text message. There was no crossover between groups, meaning no participants in the clinic-only group received text messages intended for the clinic + digital intervention group.
Figure 2.
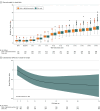
Figure 2.. Intervention Effect on Child Weight-for-Length Trajectory (Primary Outcome)
A, Box plots show the observed weight-for-length data for children who received only health behavior counseling delivered by pediatric primary care clinicians (clinic only) and those who received the combined health behavior counseling + digital intervention (clinic + digital intervention), after data cleaning. The number of weight-for-length measures that were marked invalid based on data cleaning is detailed in eTable 1 in Supplement 2. The middle line of the box represents the median; boxes represent the interquartile range; whiskers extend to 1.5 times the interquartile range; and dots represent observed values outside that range. Triangles represent the mean weight-for-length. B, The adjusted intervention effect over time is also shown, comparing the clinic + digital intervention group with the clinic-only group. The heavy curve line represents the mean weight-for-length difference (clinic + digital intervention minus clinic only), and the shaded gray area corresponds to the point-wise 95% confidence interval across follow-up. The P value shown is from a test of the null hypothesis that the growth trajectories across 24 months were equal in the clinic + digital intervention and clinic-only groups against the alternative that they differed.
Figure 3.
Figure 3.. Heterogeneity of Intervention Effect by Parent Race and Ethnicity and Parent Preferred Language
Each panel shows the model-estimated difference in the weight-for-length trajectory comparing children who received health behavior counseling delivered by pediatric primary care clinicians (clinic only) with those who received the combined health behavior counseling plus digital intervention consisting of text messages and a web dashboard (clinic + digital intervention) for prespecified subgroups. A negative weight-for-length difference represents a desirable intervention effect. Shaded regions indicate 95% confidence intervals. The P value corresponds to the test of the null hypothesis that no intervention effect heterogeneity exists against the alternative that intervention effect heterogeneity exists. Additional details regarding interpretation of the heterogeneity of intervention effect analyses are provided in Supplement 2.
Figure 4.
Figure 4.. Heterogeneity of Intervention Effect by Parent Health Literacy and Food Insecurity Score
Each panel shows the model-estimated difference in the weight-for-length trajectory comparing children who received health behavior counseling delivered by pediatric primary care clinicians (clinic only) with those who received the combined health behavior counseling plus digital intervention consisting of text messages and a web dashboard (clinic + digital intervention) for prespecified subgroups. A negative weight-for-length difference represents a desirable intervention effect. Shaded regions indicate 95% confidence intervals. The P value corresponds to the test of the null hypothesis that no intervention effect heterogeneity exists against the alternative that intervention effect heterogeneity exists. Additional details regarding interpretation of the heterogeneity of intervention effect analyses are provided in Supplement 2.

Comment on

References

    1. Hu K, Staiano AE. Trends in obesity prevalence among children and adolescents aged 2 to 19 years in the US from 2011 to 2020. JAMA Pediatr. 2022;176(10):1037-1039. doi:10.1001/jamapediatrics.2022.2052 - DOI - PMC - PubMed
    1. Narzisi K, Simons J. Interventions that prevent or reduce obesity in children from birth to five years of age: a systematic review. J Child Health Care. 2021;25(2):320-334. doi:10.1177/1367493520917863 - DOI - PMC - PubMed
    1. Woo Baidal JA, Locks LM, Cheng ER, Blake-Lamb TL, Perkins ME, Taveras EM. Risk factors for childhood obesity in the first 1,000 days: a systematic review. Am J Prev Med. 2016;50(6):761-779. doi:10.1016/j.amepre.2015.11.012 - DOI - PubMed
    1. Isong IA, Richmond T, Avendano M, Kawachi I. Racial/ethnic disparities: a longitudinal study of growth trajectories among US kindergarten children. J Racial Ethn Health Disparities. 2018;5(4):875-884. doi:10.1007/s40615-017-0434-1 - DOI - PubMed
    1. Brown T, Moore THM, Hooper L, et al. . Interventions for preventing obesity in children. Cochrane Database Syst Rev. 2019;7(7):CD001871. doi:10.1002/14651858.CD001871.pub4 - DOI - PMC - PubMed

MeSH terms

Associated data