. 2024 Dec:90:102056.
doi: 10.1016/j.molmet.2024.102056. Epub 2024 Nov 1.

TOMM40 regulates hepatocellular and plasma lipid metabolism via an LXR-dependent pathway

Affiliations

TOMM40 regulates hepatocellular and plasma lipid metabolism via an LXR-dependent pathway

Neil V Yang et al. Mol Metab. 2024 Dec.

Abstract

Objective: The gene encoding TOMM40 (Transporter of Outer Mitochondrial Membrane 40) is adjacent to that encoding APOE, which has a central role in lipid and lipoprotein metabolism. While human genetic variants near APOE and TOMM40 have been shown to be strongly associated with plasma lipid levels, a specific role for TOMM40 in lipid metabolism has not been established, and the present study was aimed at assessing this possibility.

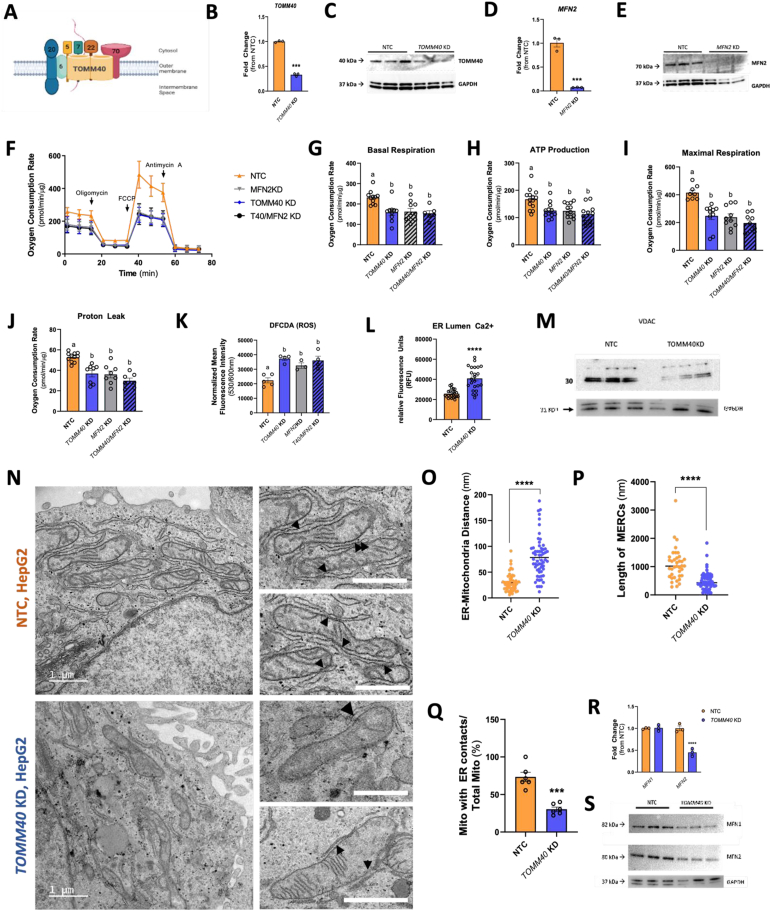
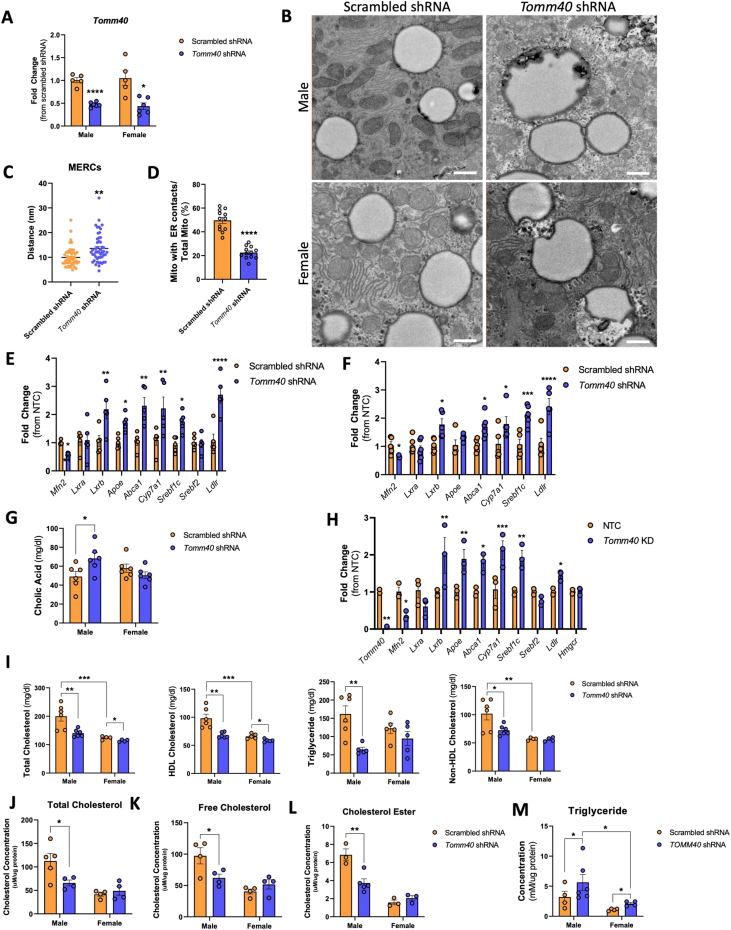
Methods: TOMM40 was knocked down by siRNA in human hepatoma HepG2 cells, and effects on mitochondrial function, lipid phenotypes, and crosstalk between mitochondria, ER, and lipid droplets were examined. Additionally, hepatic and plasma lipid levels were measured in mice following shRNA-induced knockdown of Tomm40 shRNA.

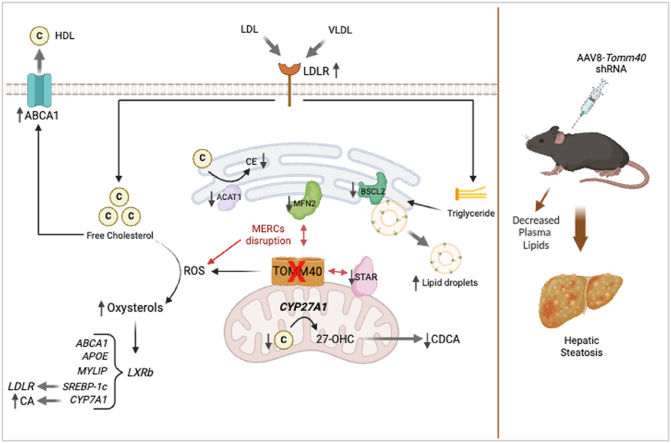
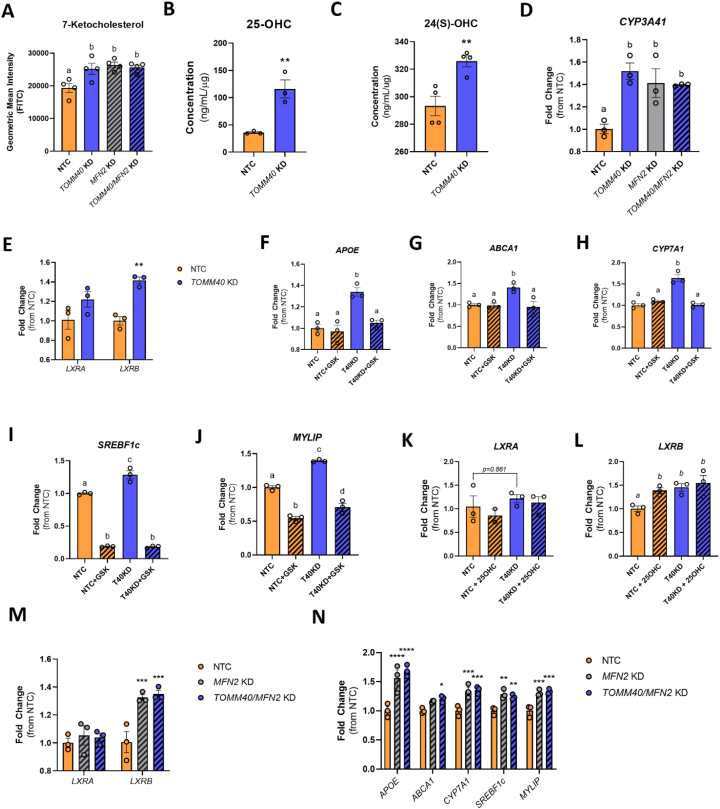
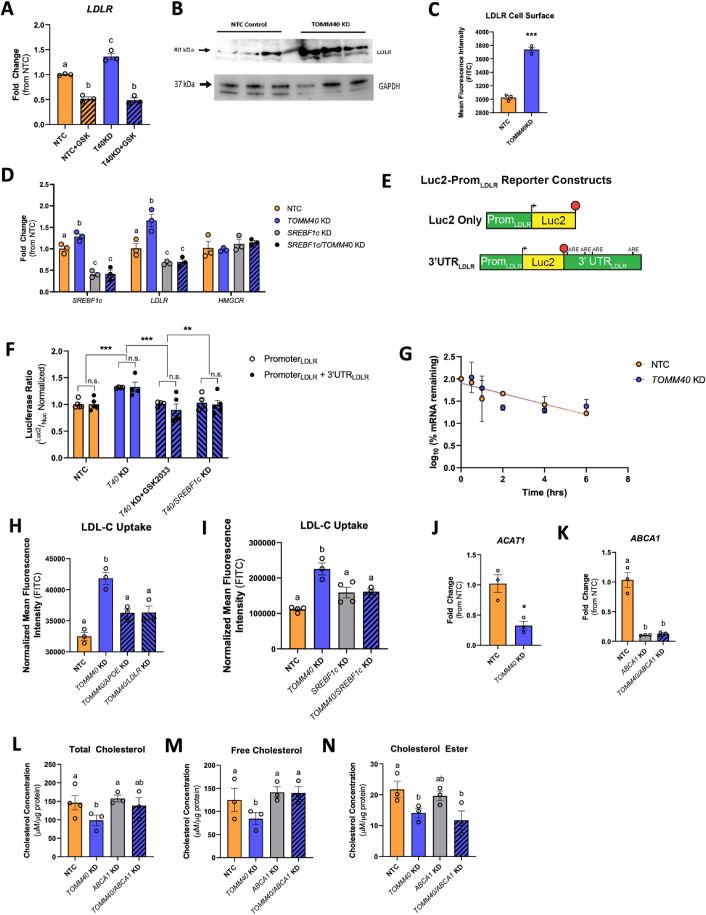
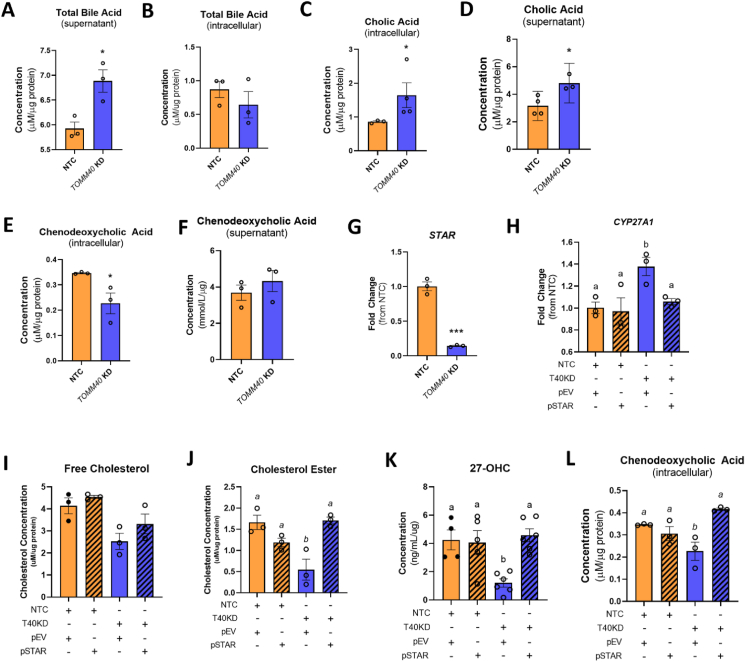
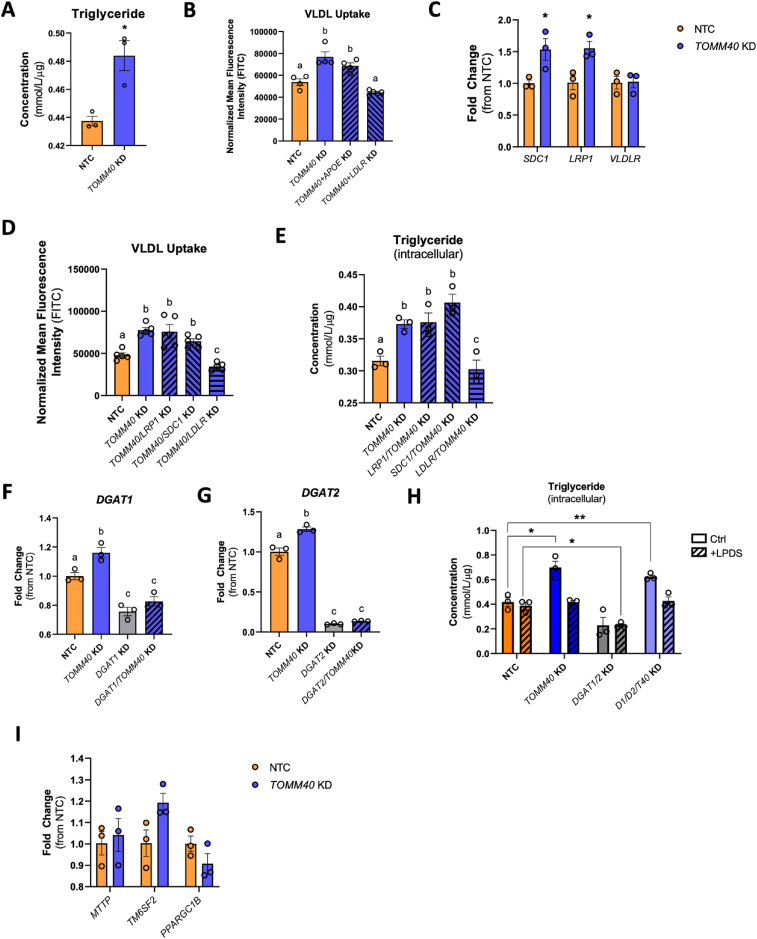
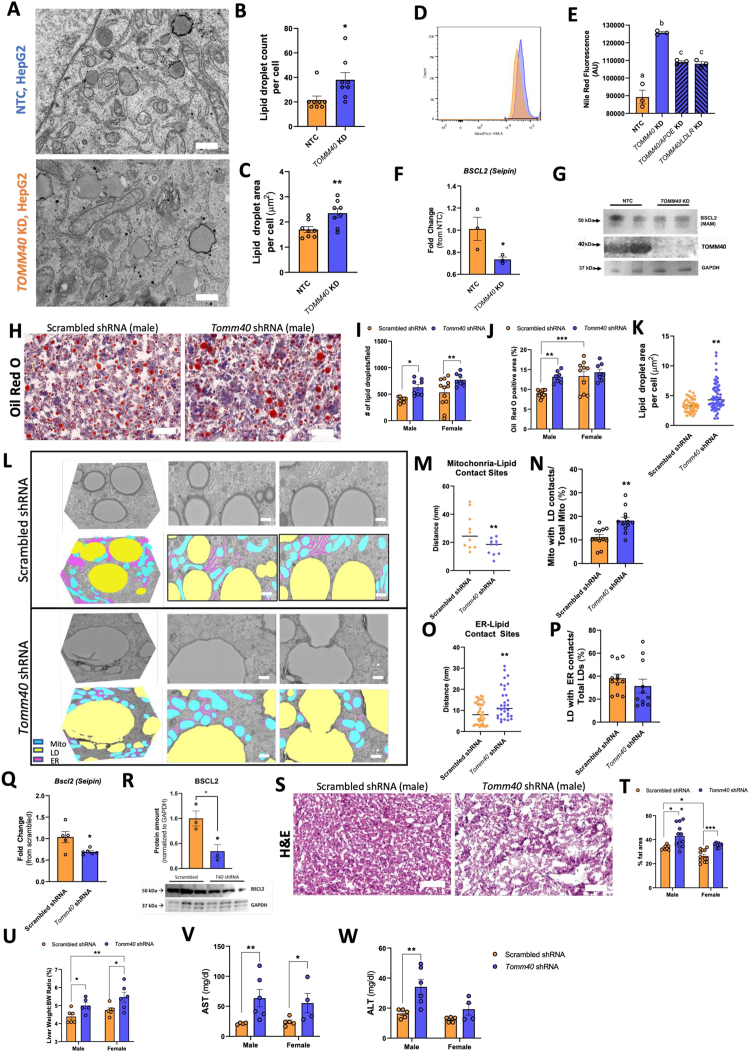
Results: In HepG2 cells, TOMM40 knockdown upregulated expression of APOE and LDLR in part via activation of LXRB (NR1H2) by oxysterols, with consequent increased uptake of VLDL and LDL. This is in part due to disruption of mitochondria-endoplasmic reticulum contact sites, with resulting accrual of reactive oxygen species and non-enzymatically derived oxysterols. With TOMM40 knockdown, cellular triglyceride and lipid droplet content were increased, effects attributable in part to receptor-mediated VLDL uptake, since lipid staining was significantly reduced by concomitant suppression of either LDLR or APOE. In contrast, cellular cholesterol content was reduced due to LXRB-mediated upregulation of the ABCA1 transporter as well as increased production and secretion of oxysterol-derived cholic acid. Consistent with the findings in hepatoma cells, in vivo knockdown of TOMM40 in mice resulted in significant reductions of plasma triglyceride and cholesterol concentrations, reduced hepatic cholesterol and increased triglyceride content, and accumulation of lipid droplets leading to development of steatosis.

Conclusions: These findings demonstrate a role for TOMM40 in regulating hepatic lipid and plasma lipoprotein levels and identify mechanisms linking mitochondrial function with lipid metabolism.

Keywords: ApoE; LXR; Lipid metabolism; Mitochondria; Mitochondria-ER contact sites; TOMM40.


Conflict of interest statement

Declaration of competing interest The authors declare that they have no known competing financial interests or personal relationships that could have appeared to influence the work reported in this paper.

Figures

Image 1
Graphical abstract
Figure 1
Figure 1
TOMM40 is essential for maintaining mitochondrial function and MERCs in hepatocytes. (A) Schematic diagram of the mammalian TOM complex, consisting of 7 subunits, located in the outer mitochondrial membrane. (B) Confirmation of TOMM40 KD in HepG2 human hepatoma cells by ∼75%, measured by qPCR. (n = 3 biological replicates) (C) Representative western blot of TOMM40 protein expression in TOMM40 KD HepG2 cells compared to GAPDH control. (D) Confirmation of MFN2 KD in HepG2 cells by ∼90%, measured by qPCR. (n = 3 biological replicates) (E) Representative western blot of MFN2 protein expression in MFN2 KD HepG2 cells compared to GAPDH control. (F–J) (D) Oxygen consumption rates of HepG2 cells transfected with TOMM40, MFN2, and/or NTC siRNAs were quantified using the Seahorse 96e Extracellular Flux Analyzer. With the addition of oligomycin, FCCP, and Antimycin A + Rotenone, basal respiration (E), ATP production (F), maximal respiration (G), and proton leak (H) were quantified. (n = 10-12 biological replicates) (K) Cellular ROS in TOMM40 and MFN2 KD vs. NTC HepG2 cells was quantified by DFCDA fluorescence probe. (n = 4-6 biological replicates) (L) ER Lumen Ca2+ levels were measured by Mag-Fluo-4 AM fluorescence probe. (n = 12 biological replicates) (M) Representative western blot of VDAC protein expression in HepG2 cells compared to GAPDH control. (N) TEM micrographs of NTC and TOMM40 KD in HepG2 cells. Arrowheads indicate MERCs; scale bars, 1 μm. (O–Q) Analysis of MERCs using ImageJ software: (M) ER-mitochondria distance (nm), (N) length of MERCs (nm), (O) percentage of mitochondria with ER contacts out of total mitochondria per cell. (n = 12-24 cells/group) (R) mRNA transcript levels of MFN1 and MFN2 in HepG2 cells quantified by qPCR. (n = 3 biological replicates) (S) Representative western blot of MFN1 and MFN2 protein expression in HepG2 cells compared to GAPDH control. For all: ∗p < 0.05, ∗∗p < 0.01, ∗∗∗p < 0.005, ∗∗∗∗p < 0.001 vs. NTC by one-way ANOVA, with post-hoc Student’s t-test to identify differences between groups. P < 0.05 for a vs. b by two-way ANOVA, with Sidak’s multiple comparisons test. Data are represented as mean ± SEM.
Figure 2
Figure 2
TOMM40 KD upregulates LXRB and downstream gene targets by promoting oxysterol production. (A) 7-ketocholesterol levels in HepG2 cells transfected with NTC vs. TOMM40, MFN2, or TOMM40/MFN2 siRNAs by flow cytometry. (n = 4 biological replicates) (B–C) Analysis of enzymatic-derived 25-OHC levels and 24(S)–OHC in TOMM40 KD vs. NTC HepG2 cells by ELISAs. (n = 3 biological replicates) (D) mRNA transcript levels of CYP3A4, responsible for the synthesis of 4β-OHC, in HepG2 cells, quantified by qPCR. (n = 3 biological replicates) (E–J) (E) mRNA transcript levels of LXRA and LXRB and their downstream targets: APOE (F), ABCA1 (G), CYP7A1 (H), SREBF1c (I), and MYLIP (J), in HepG2 cells quantified by qPCR. (K–L) mRNA transcript levels of LXRA (K) and LXRB (L) in HepG2 cells transfected with NTC vs. TOMM40 siRNAs after the addition of 10 μM GSK2033 (LXR antagonist). (n = 3 biological replicates) (M−N) (M) mRNA transcript levels of LXRA and LXRB and their downstream targets (N) in NTC, TOMM40 KD, MFN2 KD, and TOMM40/MFN2 KD HepG2 cells, quantified by qPCR. (n = 3 biological replicates) For all: ∗p < 0.05, ∗∗p < 0.01, ∗∗∗p < 0.005, ∗∗∗∗p < 0.001 vs. NTC by one-way ANOVA, with post-hoc Student’s t-test to identify differences between groups. P < 0.05 for a vs. b vs. c vs. d by two-way ANOVA, with Sidak’s multiple comparisons test. Data are represented as mean ± SEM.
Figure 3
Figure 3
TOMM40 KD promotes LDL uptake via an LXR-mediated pathway. (A) LDLR mRNA transcripts were quantified by qPCR in HepG2 cells treated with NTC vs. TOMM40 KD, with or without GSK2033. (n = 3 biological replicates) (B) Representative western blot of LDLR protein expression in NTC vs. TOMM40 KD HepG2 cells. (C) LDLR cell surface protein levels were stained with anti-LDLR antibody and analyzed by flow cytometry. (n = 3 biological replicates) (D) mRNA transcripts confirming KD of SREBF1c and changes in expression of LDLR and HMGCR in SREBF1, TOMM40, and NTC siRNAs-treated HepG2 cells. (n = 3 biological replicates) (E) Schematic diagram of Luc2-PromLDLR reporter constructs, illustrating LDLR promoter, start site (arrowhead), stop codon (red octagon), and 3′UTR region, containing adenylate-uridylate (AU)-rich elements (AREs) implicated in mRNA stability, of the LDLR gene. (F) Ratiometric luciferase outputs of HepG2 cells transfected with indicated reporters. (n = 4-5 biological replicates) n.s. = non-significant. Two-way ANOVA, ∗∗p < 0.01, ∗∗∗p < 0.005 by Holm–Sidak test. Data are represented as mean ± SEM. (G) Relative expression of LDLR mRNA in NTC vs. TOMM40 KD HepG2 cells after arrest of transcription with actinomycin D. (n = 3 biological replicates) (H–I) BODIPY-labelled LDL-C was taken up in HepG2 cells and fluorescence was quantified on a microplate fluorescence spectrophotometer. (n = 3 biological replicates) (J–K) mRNA transcripts of ACAT1 (J) and ABCA1 (K) expression quantified by qPCR. (L–N) Intracellular total cholesterol (L), free cholesterol (M), and cholesterol ester (N) levels quantified from HepG2 cells transfected with NTC, TOMM40, and ABCA1 siRNAs, singly and in combination, using Amplex Red Cholesterol Assay. (n = 3-4 biological replicates) For all (except F): ∗p < 0.05, ∗∗p < 0.01, ∗∗∗p < 0.005, ∗∗∗∗p < 0.001 vs. NTC by one-way ANOVA, with post-hoc Student’s t-test to identify differences between groups. P < 0.05 for a vs. b vs. c by two-way ANOVA, with Sidak’s multiple comparisons test. Data are represented as mean ± SEM. (For interpretation of the references to color in this figure legend, the reader is referred to the Web version of this article.)
Figure 4
Figure 4
TOMM40 KD in hepatocytes promotes classic bile acid synthesis pathway while inhibiting alternative pathway via interaction with STARD1 at MERCs (A–B) Total bile acid levels in NTC vs. TOMM40 KD HepG2 cells were measured in the supernatant (cell media; A) and intracellularly (B) by ELISA and normalized to protein concentration by BCA assay. (C–D) Cholic acid levels were quantified intracellularly (C) and in the supernatant (D) of HepG2 cells. (E–F) Chenodeoxycholic acid levels were measured intracellularly (E) and in the supernatant (F) in NTC vs. TOMM40 KD HepG2 cells. (G) mRNA transcripts of STAR were quantified in NTC vs. TOMM40 KD HepG2 cells by qPCR. (H) CYP27A1 gene expression was measured in NTC vs. TOMM40 KD HepG2 cells with overexpression of an empty vector (pEV) or a STAR-expressing plasmid (pSTAR). (I–J) Mitochondrial free cholesterol (I) and cholesterol ester (J) levels were measured by Amplex Red Cholesterol Assay in HepG2 cells. (K) Analysis of enzymatic-derived 27-OHC levels in TOMM40 KD vs. NTC HepG2 cells overexpressed with pEV or pSTAR by ELISA. (L) Analysis of intracellular chenodeoxycholic acid levels in NTC vs. TOMM40 KD HepG2 cells overexpressing pEV or pSTAR. For all: ∗p < 0.05, ∗∗p < 0.01, ∗∗∗p < 0.005, ∗∗∗∗p < 0.001 vs. NTC by one-way ANOVA, with post-hoc Student’s t-test to identify differences between groups. P < 0.05 for a vs. b by two-way ANOVA, with Sidak’s multiple comparisons test. Data are represented as mean ± SEM. (n = 3 biological replicates). (For interpretation of the references to color in this figure legend, the reader is referred to the Web version of this article.)
Figure 5
Figure 5
TOMM40 KD promotes VLDL uptake and triglyceride accumulation via LDLR upregulation. (A) Quantification of intracellular triglyceride in HepG2 cells transfected with NTC vs. TOMM40 siRNAs. (B) Quantification of DiI-labelled human VLDL uptake after 4 h incubation by HepG2 cells transfected with siRNA for TOMM40 singly and in combination with siRNAs for APOE, and LDLR KD, vs. NTC, measured by fluorescence spectrophotometry. (C) Relative SDC1, LRP1, and VLDLR mRNA levels in HepG2 cells transfected with NTC vs. TOMM40 siRNAs, measured by qPCR. (D) Quantification of DiI-labelled VLDL uptake after 4 h incubation by HepG2 cells transfected with siRNA for TOMM40 singly and in combination with siRNAs for LRP1, SDC1, and LDLR, vs. NTC, measured by fluorescence spectrophotometry (E) Intracellular triglyceride levels quantified in HepG2 cells transfected with siRNA for TOMM40 singly and in combination with siRNAs for LRP1, SDC1, and LDLR, vs. NTC. (F–G) Relative mRNA transcript levels of DGAT1 and DGAT2 in HepG2 cells transfected with NTC vs. siRNAs for TOMM40, DGAT1, and DGAT2, singly and in combination, measured by qPCR. (H) Quantification of intracellular triglyceride in DGAT1/DGAT2 KD vs. DGAT1/DGAT2/TOMM40 KD HepG2 cell incubated in 10% FBS or LPDS serum for 48 h. (I) Relative MTTP, TM6SF2, and PPARGC1B mRNA levels in HepG2 cells transfected with NTC vs. TOMM40 siRNA, as measured by qPCR. For all: ∗p < 0.05, ∗∗p < 0.01, ∗∗∗p < 0.005, ∗∗∗∗p < 0.001 vs. NTC by one-way ANOVA, with post-hoc Student’s t-test to identify differences between groups. P < 0.05 for a vs. b vs. c by two-way ANOVA, with Sidak’s multiple comparisons test. Data are represented as mean ± SEM. (n = 3 biological replicates).
Figure 6
Figure 6
AAV8-Tomm40 shRNA injected C57BL/6J mice show reduced plasma cholesterol and triglyceride levels. (A) Relative mRNA transcript levels of Tomm40 confirming KD in male and female mice of ∼60%, quantified by qPCR. (n = 5–6 mice/sex/group) (B) Representative TEM images of scrambled shRNA (control) vs. Tomm40 shRNA in male and female, mice. Scale bars, 1 μm. (C–D) Analysis of MERCs using ImageJ software: (C) ER-mitochondria distance (nm), (N) length of MERCs (nm), (D) percentage of mitochondria with ER contacts out of total mitochondria per cell. (n = 12–48 fields) (E–F) Relative mRNA transcript levels comparing scrambled vs. Tomm40 shRNA mice in male (E) and female (F). (n = 4-6 mice/sex/group) (G) Quantification of plasma cholic acid levels in scrambled vs. Tomm40 shRNA, male and female mice, measured by ELISA. (n = 4-6 mice/sex/group) (H) Relative mRNA transcript levels comparing NTC vs. Tomm40 siRNA transfected primary hepatocytes derived from male C57BL/6J mice, quantified by qPCR. (n = 3 male mice/group) (I) Plasma total cholesterol, HDL-cholesterol, and triglyceride from male and female mice were quantified with AMS Liasys 330 Clinical Chemistry Analyzer, and Non-HDL-cholesterol was calculated by subtracting HDL-cholesterol from total cholesterol levels. (n = 5-6 mice/sex/group) (J–L) Hepatic total cholesterol (J), free cholesterol (K), and cholesterol ester (L) levels quantified from male and female mice liver, using Amplex Red Cholesterol Assay. (n = 4-6 mice/sex/group) (M) Quantification of hepatic triglyceride levels in male and female mice livers, using EnzyChrom™ Triglyceride Assay. (n = 4-6 mice/sex/group) For all: ∗p < 0.05, ∗∗p < 0.01, ∗∗∗p < 0.005, ∗∗∗∗p < 0.001 vs. NTC by one-way ANOVA, with post-hoc Student’s t-test to identify differences between groups. Data are represented as mean ± SEM. (For interpretation of the references to color in this figure legend, the reader is referred to the Web version of this article.)
Figure 7
Figure 7
TOMM40/Tomm40 KD induces lipid droplet accumulation and hepatic steatosis in vivo. (A) Representative TEM images of lipid droplets in NTC vs. TOMM40 KD HepG2 cells. Scale bars, 1000 nm. (B–C) Analysis of lipid droplets in HepG2 cells using ImageJ software: (B) lipid droplet count per cell, (C) average lipid droplet area per cell (μm2). (n = 8–12 cells) (D) Representative flow cytometry histogram of NTC vs. TOMM40 KD HepG2 cells. Neutral lipids were stained with Nile red. (E) Analysis of flow cytometry data in NTC vs. TOMM40 KD, singly and in combination with APOE and LDLR KD, HepG2 cells stained with Nile red. (n = 3 biological replicates) (F) Relative mRNA transcript levels of BSCL2 (Seipin) in NTC vs. TOMM40 KD HepG2 cells. (n = 3 biological replicates) (G) Representative western blot of BSCL2 and TOMM40 protein expression in isolated MAMs of NTC vs. TOMM40 KD HepG2 cells, compared to GAPDH control. (H) Representative ORO images of scrambled vs. Tomm40 shRNA male mouse liver (magnification ×400). Scale bars, 50 μm. (I–J) Analysis of ORO staining using ImageJ software: (I) # of lipid droplets/field, (J) ORO positive area (%). (n = 10-15 fields/sex/group) (K) Analysis of lipid droplet surface area (μm2) in male mouse liver tissue using ImageJ software. (n = 24–48 fields) (L) Representative FIB-SEM micrographs of 3D reconstructed and 2D slices from scrambled vs. Tomm40 shRNA male mice liver. Segmentation analysis indicates mitochondria (blue), lipid droplets (yellow), and endoplasmic reticulum (purple). Scale bars, 1 μm. (M−P) Analysis of organelle contact sites in scrambled vs. Tomm40 shRNA male mice liver from TEM images using ImageJ software: (M) mitochondria-lipid contact site distance (nm), (N) percentage of mitochondria with lipid droplet contacts out of total mitochondria (%), (O) ER-lipid contact site distance (nm), (P) percentage of lipid droplets with an ER contact site out of total lipid droplets (%). (n = 10-40 fields) (Q) Relative mRNA transcript levels of Bscl2 (Seipin) in scrambled vs. Tomm40 shRNA male mice livers. (n = 5-6 mice/group) (R) Relative protein amount and representative western blot of BSCL2 protein expression in isolated MAMs of scrambled vs. Tomm40 shRNA male mice livers. (S) Representative hematoxylin-eosin stained images of scrambled vs. Tomm40 shRNA male mouse livers (magnification ×400). Scale bars, 50 μm. (T) Analysis of % fat area/field in hematoxylin-eosin stained liver samples using ImageJ software. (n = 10-15 fields/sex/group) (U) Liver weight-to-body weight ratio (%) of scrambled vs. Tomm40 shRNA mice. (n = 5-6 mice/sex/group) (V–W) Plasma AST and ALT from male and female mice were quantified with AMS Liasys 330 Clinical Chemistry Analyzer. (n = 5-6 mice/sex/group) For all: ∗p < 0.05, ∗∗p < s0.01, ∗∗∗p < 0.005, ∗∗∗∗p < 0.001 vs. NTC by one-way ANOVA, with post-hoc Student’s t-test to identify differences between groups. Data are represented as mean ± SEM. (For interpretation of the references to color in this figure legend, the reader is referred to the Web version of this article.)

References

    1. Gottzchalk W.K., Lutz M.W., He W.T., Saunders A.M., Burns D.K., Roses A.D., et al. The broad impact of TOM40 on neurodegenerative diseases in aging. J Parkinson’s Dis Alzheimer’s Dis. 2014;1(1):12. doi: 10.13188/2376-922X.1000003. - DOI - PMC - PubMed
    1. Namba T. BAP31 regulates mitochondrial function via interaction with Tom40 within mitochondria contact sites. Sci Adv. 2019;5(6) doi: 10.1126/sciadv.aaw1386. - DOI - PMC - PubMed
    1. Hansson Petersen C.A., Alikhani N., Behbahani H., Wiehager B., Pavlov P.F., Alafuzoff A., et al. The amyloid beta-peptide is imported into mitochondria via the TOM import machinery and localized to mitochondrial cristae. Proc Natl Acad Sci U S A. 2008;105(35):13145–13150. doi: 10.1073/pnas.0806192105. - DOI - PMC - PubMed
    1. Patergnani S., Suski J.M., Agnoletto C., Bononi A., Bonora M., De Marchi E., et al. Calcium signaling around mitochondria associated membranes (MAMs) Cell Commun Signal. 2011;9:19. doi: 10.1186/1478-811X-9-19. - DOI - PMC - PubMed
    1. Camara A.K.S., Zhou Y., Wen P.C., Tajkhorshid E., Kwok W.M. Mitochondrial VDAC1: a key gatekeeper as potential therapeutic target. Front Physiol. 2017;8:460. doi: 10.3389/fphys.2017.00460. - DOI - PMC - PubMed

MeSH terms

LinkOut - more resources