. 2024 Nov 3;15(1):9492.
doi: 10.1038/s41467-024-53761-w.

Interplay between Two Paralogous Human Silencing Hub (HuSH) Complexes in Regulating LINE-1 Element Silencing

Affiliations

Interplay between Two Paralogous Human Silencing Hub (HuSH) Complexes in Regulating LINE-1 Element Silencing

Zena D Jensvold et al. Nat Commun. .

Abstract

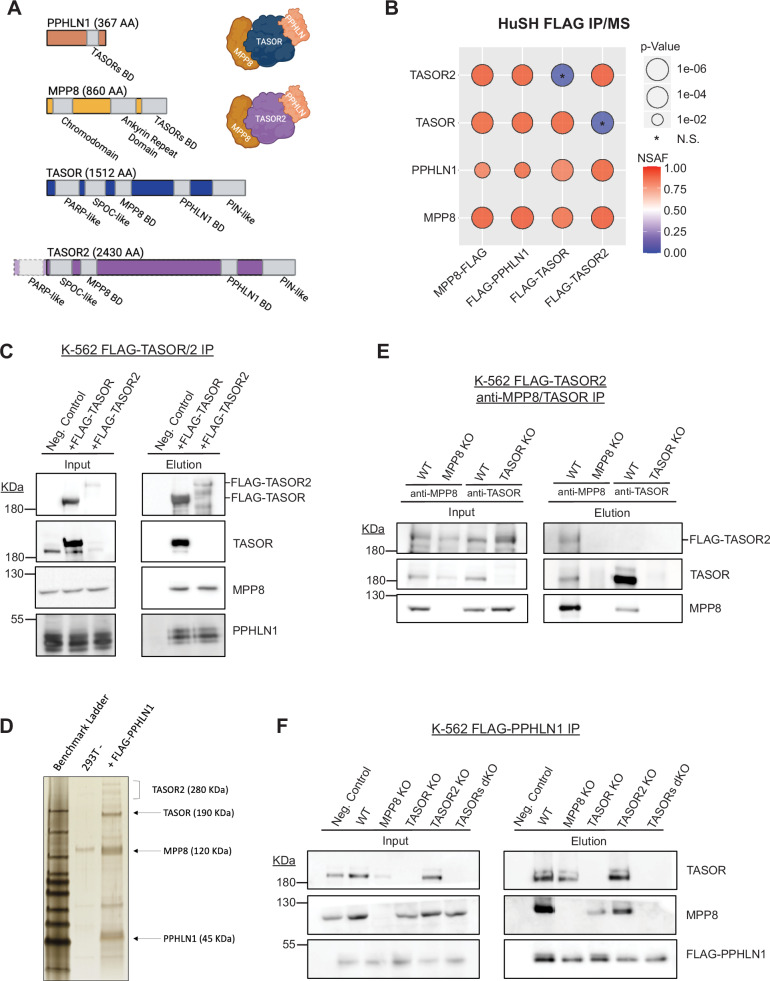
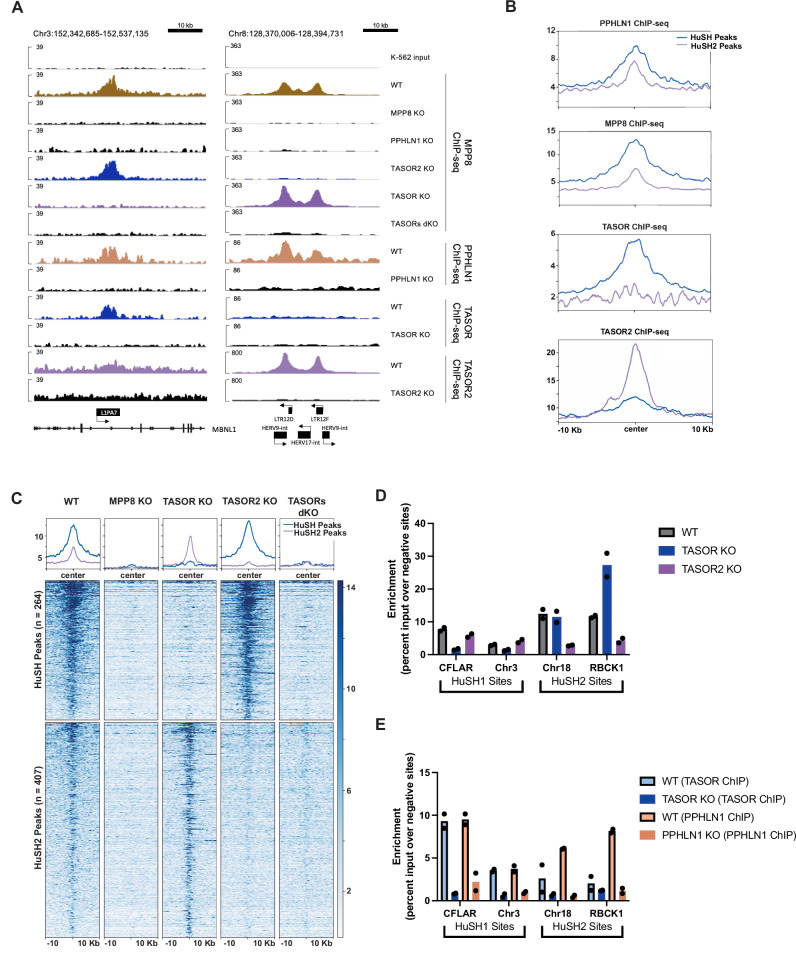
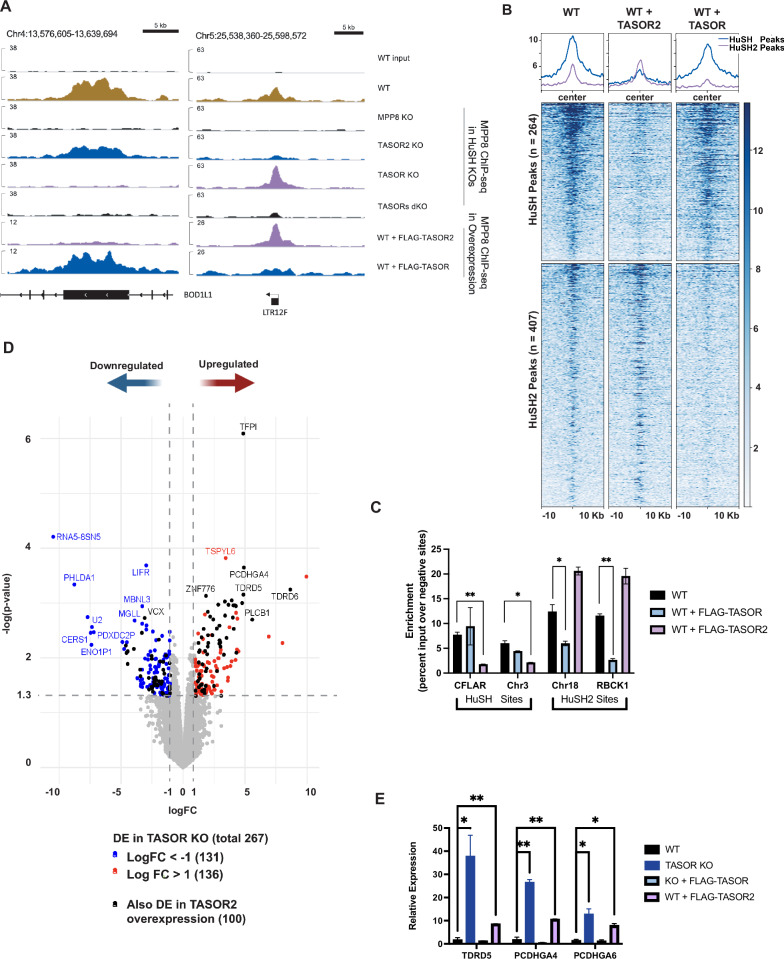
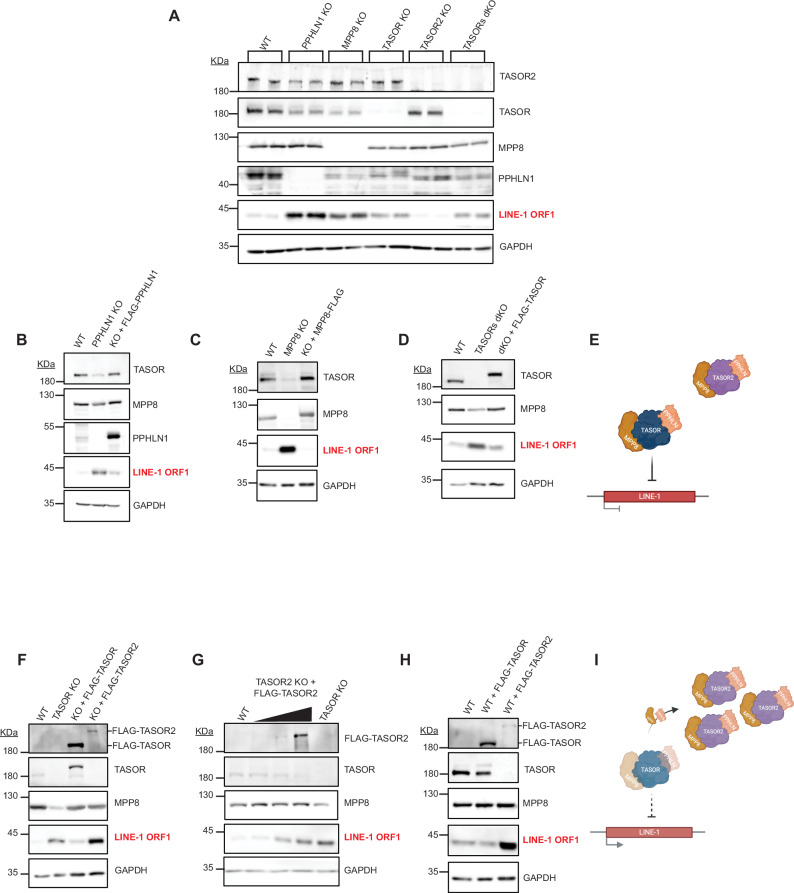
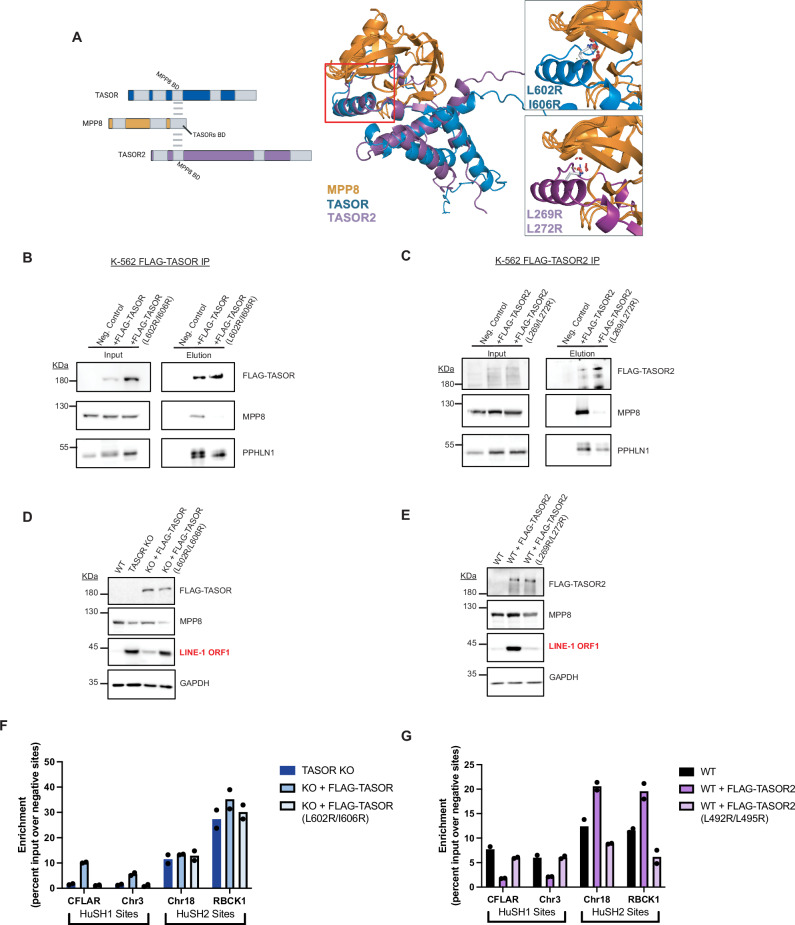
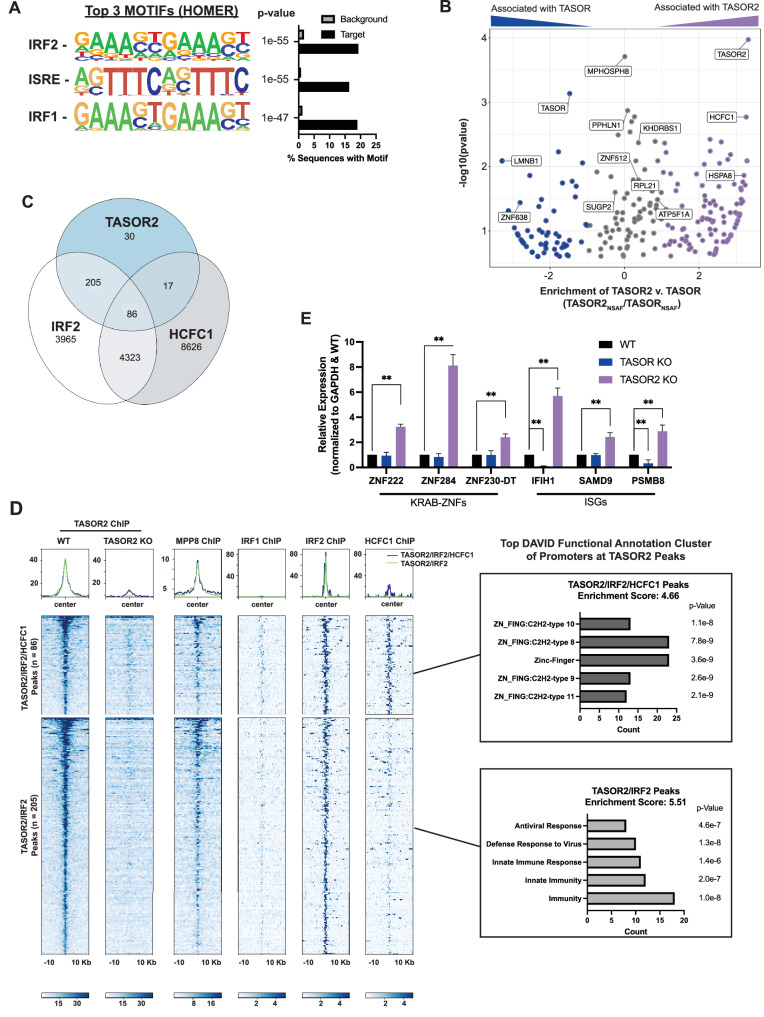
The Human Silencing Hub (HuSH) complex silences retrotransposable elements in vertebrates. Here, we identify a second HuSH complex, designated HuSH2, which is centered around TASOR2, a paralog of the core TASOR protein in HuSH. Our findings reveal that HuSH and HuSH2 localize to distinct and non-overlapping genomic loci. Specifically, HuSH localizes to and represses LINE-1 retrotransposons, whereas HuSH2 targets and represses KRAB-ZNFs and interferon signaling and response genes. We use in silico protein structure predictions to simulate MPP8 interactions with TASOR paralogs, guiding amino acid substitutions that disrupted binding to HuSH complexes. These MPP8 transgenes and other constructs reveal the importance of HuSH complex quantities in regulating LINE-1 activity. Furthermore, our results suggest that dynamic changes in TASOR and TASOR2 expression enable cells to finely tune HuSH-mediated silencing. This study offers insights into the interplay of HuSH complexes, highlighting their vital role in retrotransposon regulation.


Conflict of interest statement

The authors declare no competing interests.

Figures

Fig. 1
Fig. 1. Identification of a second HuSH complex in human cells.
A Molecular representation of each HuSH complex member and TASOR2, with position of FLAG epitope tag and each known domain named. BD= Binding Domain, AA=amino acid. B Immunoprecipitation-mass spectrometry (IP/MS) analysis performed in HEK293T cells expressing FLAG-tagged transgenes (x-axis). This analysis revealed the association of TASOR2 with PPHLN1 and MPP8 (y-axis). The data is presented as the Normalized Spectral Abundance Factor (NSAF), normalized to the length of prey targets and compared to a wild-type HEK293T immunoprecipitation negative control. Immunoprecipitation-mass spectrometry was conducted in biological duplicates and a standard student’s t-test was performed to calculate p-values for statistical significance. C Immunoblots of FLAG immunoprecipitation (IP) in K-562 cell-line expressing no transgene (wild type; WT -), FLAG-TASOR, or FLAG-TASOR2. This experiment was repeated at least twice independently with similar results. D Silver stain of FLAG-PPHLN1 immunoprecipitation (IP) from ammonium sulfate nuclear extract of 293 F cells. This experiment was repeated three independent times with similar results. E Immunoblots of MPP8 and TASOR immunoprecipitation (IP) in parental wild-type cells or MPP8 knockouts (KO) or TASOR KOs expressing FLAG-TASOR2. This experiment was repeated at least twice independently with similar results. F Immunoblots of FLAG immunoprecipitation (IP) performed in stable genome edited HuSH knockout K-562 cells, expressing no transgene (Neg. Control) or FLAG-PPHLN1 (isoform 3). This experiment was repeated at least twice independently with similar results.
Fig. 2
Fig. 2. Distinct Genomic Localization of Two HuSH Complexes.
A IGV genome browser tracks of MPP8, PPHLN1, TASOR, and TASOR2 ChIP-seq in parental wild type (WT) and knockout (KO) cell lines. One HuSH site is shown (left) at an L1PA7 element within MBNL1. One HuSH2 site is shown (right) at LTR elements. B Average profile of PPHLN1, MPP8, TASOR, and TASOR2 ChIP-seq across HuSH and HuSH2 sites created using Deeptools. C Heatmap and peak profiles illustrating MPP8 ChIP-seq results, performed in K-562 cells in HuSH knockout backgrounds. Peaks were called using MACS2 in biological replicates (n = 2) of TASOR knockout and TASOR2 knockout, generating two non-overlapping regions, corresponding to HuSH2 and HuSH sites, respectively. D Bar chart showing MPP8 ChIP-qPCR results, performed in technical replicates (n = 2) of knockout cell lines at HuSH and HuSH2 sites. Enrichment was measured as the percent input over the average percent input at negative control sites (GNG and RABL3). Each replicate is plotted as a dot and bars are graphed to depict the mean of each measurement. E Bar chart showing TASOR (blue) and PPHLN1 (peach) ChIP-qPCR results, performed in technical replicates (n = 2) of WT and knockout cell lines at HuSH and HuSH2 sites. Enrichment was measured as the percent input over the average percent input at negative control sites (GNG and RABL3). Each replicate is plotted as a dot and bars are graphed to depict the mean of each measurement.
Fig. 3
Fig. 3. TASOR overexpression indicates competition for the limiting subunits.
A IGV genome browser tracks of MPP8 ChIP-seq in parental wild-type (WT), knockout (KO) cell lines, and FLAG-TASOR or FLAG-TASOR2 overexpression systems. One HuSH site is shown on the left at the exon of BOD1L1, and one HuSH2 site is shown on the right at an LTR element. B Heatmap and peak profiles displaying MPP8 ChIP-seq results, performed in K-562 cells with FLAG-TASOR or FLAG-TASOR2 overexpression. The results are sorted into either HuSH or HuSH2 dependent peaks. C Bar chart illustrating MPP8 ChIP-qPCR conducted in technical replicates (n = 2) of FLAG-TASOR or FLAG-TASOR2 overexpressing cell lines at HuSH and HuSH2 sites. Enrichment is measured as a percentage of input over the average percentage input at negative control sites (GNG and RABL3). Each replicate is plotted as a dot and bars are graphed to depict the mean of each measurement. D Volcano plot presenting total RNA-seq (ribo-depleted) differential expression analysis of genes in K-562 TASOR knockout (KO) cells, performed with two biological replicates, compared to WT puromycin-resistant biological replicates. Differentially expressed (DE) genes (red and blue) meet the following criteria: logCPM > 1, |logFC| > 1, and p-value < 0.05. Statistical analysis was performed using EdgeR default settings. Out of the 267 differentially expressed genes, 100 (black) are differentially expressed in the same direction in WT + FLAG-TASOR2 cells. E Bar chart showing RT-qPCR performed in biological replicates (n = 2) using RNA collected from WT clones, TASOR KO, TASOR KO rescued with FLAG-TASOR transgene, and WT overexpressing FLAG-TASOR2. Expression levels are measured relative to GAPDH and WT RNA. Each replicate is plotted as a dot and bars are graphed to depict the mean of each measurement.
Fig. 4
Fig. 4. The competition between two HuSH complexes regulates LINE-1 expression in K-562 cells.
A Immunoblot of whole-cell lysate generated from K-562 CRISPR-Cas9 stable KOs in bioreplicate. This experiment was repeated at least four independent times with similar results. B Immunoblot of whole-cell lysate generated from K-562 wild type (WT), knockout (KO), and FLAG transgene rescues (BD). These experiments were repeated at least twice independently with similar results. B PPHLN1 KO and FLAG-PPHLN1 (isoform 3); (C) MPP8 KO and MPP8-FLAG; (D) TASORs dKO and FLAG-TASOR. E Schematic representation of the HuSH complex silencing LINE-1 elements. F Immunoblot of whole-cell lysate from K-562 WT, TASOR KO, and TASOR KO with either FLAG-TASOR or FLAG-TASOR2 expressed, highlighting the differential expression and rescue efficiency. This experiment was repeated at least twice independently with similar results. G Immunoblot of whole-cell lysate from K-562 WT, TASOR2 KO with increasing levels of FLAG-TASOR2 transgene expressed, compared to a TASOR KO, illustrating dose-dependent effects. This experiment was repeated at least twice independently with similar results. H Immunoblot of whole-cell lysate from K-562 WT, overexpression of FLAG-TASOR or FLAG-TASOR2 in a wild type (WT) background, showing the impact of overexpression on HuSH complexes. This experiment was repeated at least twice independently with similar results. I Diagram depicting the competitive interaction between TASOR2 and other HuSH components (MPP8 and PPHLN1), demonstrating how increasing TASOR2 levels can destabilize the HuSH complex and impair its ability to silence LINE-1 elements.
Fig. 5
Fig. 5. Analysis of the TASOR/MPP8 binding interface.
A AlphaFold2 predicted structure of MPP8 -TASORs binding domains with DomI of both TASOR and TASOR2 overlapped. Mutated residues highlighted, predicted to disrupt interaction of MPP8 with TASOR (L602R, L606R) or TASOR2 (L269R, L272R). B Immunoblots of FLAG immunoprecipitation (IP) performed in TASOR KO cell-lines stably expressing empty vector (WT-), FLAG-TASOR wild type, or mutant transgene. This experiment was repeated at least twice independently with similar results. C Immunoblots of FLAG immunoprecipitation (IP) performed in TASOR2 KO cell-lines stably expressing empty vector (WT-), FLAG-TASOR2 wild type, or mutant transgene. This experiment was repeated at least twice independently with similar results. D Immunoblot of whole-cell lysate generated from K-562 WT, TASOR KO, and WT/mutant transgene rescue cell-lines. This experiment was repeated at least twice independently with similar results. E Immunoblot of whole-cell lysate generated from K-562 WT, TASOR2 KO, and WT/mutant transgene rescue cell-lines. This experiment was repeated at least twice independently with similar results. F Bar chart showing MPP8 ChIP-qPCR done in technical replicates (n = 2) of WT, TASOR KO, or WT/mutant transgene rescue cell-lines. Intensity measured at HuSH and HuSH2 sites measured by enrichment of percent input over average percent input at negative control sites (GNG and RABL3). Each replicate is plotted as a dot and bars are graphed to depict the mean of each measurement. G Bar chart showing MPP8 ChIP-qPCR done in technical replicates (n = 2) of WT or WT/mutant transgene overexpression cell-lines. Intensity measured at HuSH and HuSH2 sites measured by enrichment of percent input over average percent input at negative control sites (GNG and RABL3). Each replicate is plotted as a dot and bars are graphed to depict the mean of each measurement.
Fig. 6
Fig. 6. TASOR2 and IRF2 binding and repression of IFN-related genes.
A The results from HOMER findMotif analysis of peaks identified by MACS2 in TASOR2 ChIP-seq data. The top three significant motifs identified include members of the IRF transcription factor family, such as IRF2, ISRE, and IRF1. B Scatter plot illustrating the comparison of Normalized Spectral Abundance Factor (NSAF) enrichment in IP-MS data between TASOR2 and TASOR. Points in purple represent proteins more enriched in TASOR2 pulldowns, with -log(p-value) from TASOR2 NSAF enrichment being used. Points in blue represent proteins more enriched in TASOR pulldowns, with -log(p-value) from TASOR NSAF enrichment being used. All labeled proteins were found to be statistically significant using a standard Student’s t test (p-value < 0.05) and also associated with MPP8 and PPHLN1, as shown in Supplementary Fig. 2). C Venn diagram depicting the overlap of peaks for TASOR2, IRF2, and HCFC1. Overlaps were determined using the BedTools window command with a default distance of 1Kb. D Heatmap and peak profiles showing the MACS2-called shared ChIP peaks for TASOR2/IRF2/HCFC1 or TASOR2/IRF2. TASOR2 ChIP-seq was conducted in both WT and TASOR2 KO cell lines, MPP8 ChIP-seq in WT cell lines, and IRF1, IRF2, and HCFC1 ChIP-seq data were obtained from the ENCODE K-562 public datasets. Accompanying bar charts depict the top DAVID functional annotation clusters for promoters found within the two groups of called peaks. E Bar chart displaying qRT-PCR results performed in biological replicates (n = 3) using RNA from WT clones, TASOR KO, and TASOR2 KO. Gene expression levels were normalized to GAPDH and WT RNA. Each replicate is plotted as a dot and bars are graphed to depict the mean of each measurement with error bars depicting ±SD. Statistical analysis using a Students t test revealed significant (*p < 0.05) or strongly significant (**p < 0.01) differences in expression compared to WT. Specifically for TASOR2 KO expression compared to WT the p-values are as follows from left to right (0.0016, 0.0039, 0.0119, 0.0053, 0.0222, 0.0295). For TASOR KO expression compared to WT the p-values are as follows from left to right (0.7264, 0.4031, 0.7702, 1.6494e-05, 0.4034, and 0.0691).
Fig. 7
Fig. 7. Regulatory balance between HuSH and HuSH2 in K-562 cells.
HuSH and HuSH2 exist in a critical balance, each occupying distinct loci within the genome, as demonstrated by MPP8 ChIP-seq analysis (right panel). In the absence of either TASOR or TASOR2, the targeted complex fails to form, resulting in the inability of MPP8 to localize to the chromatin targeted by the missing complex. Consequently, an excess of MPP8 is available to stabilize and enhance the still intact complex. This redistribution of MPP8 from HuSH or HuSH2 sites leads to alterations in the silencing of LINE-1 elements, immune response-related genes (ISGs), and KRAB-ZNFs (ZNFs) in K-562 cells. The shift in MPP8 localization thereby significantly impacts the transcriptional regulation of these genomic elements, highlighting the delicate interplay between HuSH and HuSH2 in maintaining genomic stability and gene expression homeostasis in K-562 cells. Created in BioRender. Jensvold, Z. (2024) BioRender.com/z18k565.

Update of

References

    1. Tchasovnikarova, I. A. et al. Epigenetic silencing by the HUSH complex mediates position-effect variegation in human cells. Science348, 1481–1485 (2015). - PMC - PubMed
    1. Tchasovnikarova, I. A. et al. Hyperactivation of HUSH complex function by Charcot–Marie–Tooth disease mutation in MORC2. Nat. Genet.49, 1035–1044 (2017). - PMC - PubMed
    1. Timms, R. T., Tchasovnikarova, I. A., Antrobus, R., Dougan, G. & Lehner, P. J. ATF7IP-mediated stabilization of the histone methyltransferase SETDB1 is essential for heterochromatin formation by the HUSH complex. Cell Rep.17, 653–659 (2016). - PMC - PubMed
    1. Liu, N. et al. Selective silencing of euchromatic L1s revealed by genome-wide screens for L1 regulators. Nature553, 228–232 (2018). - PMC - PubMed
    1. Tunbak, H. et al. The HUSH complex is a gatekeeper of type I interferon through epigenetic regulation of LINE-1s. Nat. Commun.3, 54–67 (2020). - PMC - PubMed

Publication types

Associated data