. 2024 Nov 3;15(1):9495.
doi: 10.1038/s41467-024-53821-1.

Genomic and transcriptomic landscape of human gastrointestinal stromal tumors

Affiliations

Genomic and transcriptomic landscape of human gastrointestinal stromal tumors

Feifei Xie et al. Nat Commun. .

Abstract

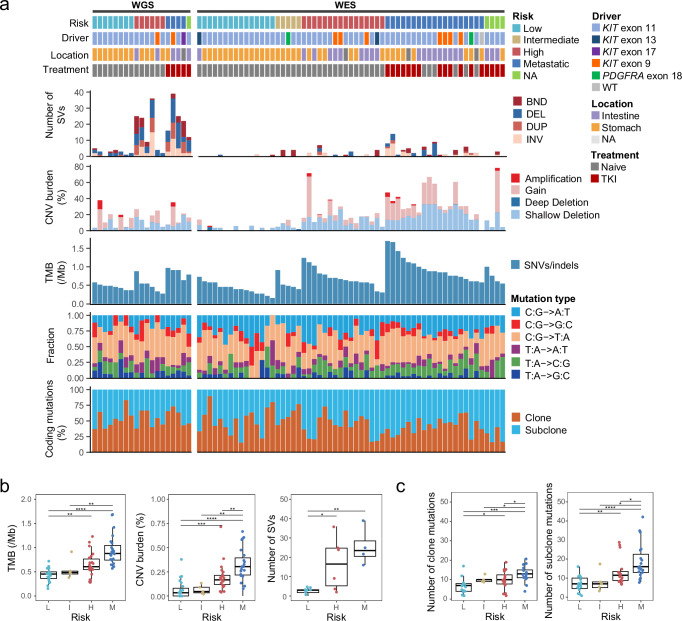
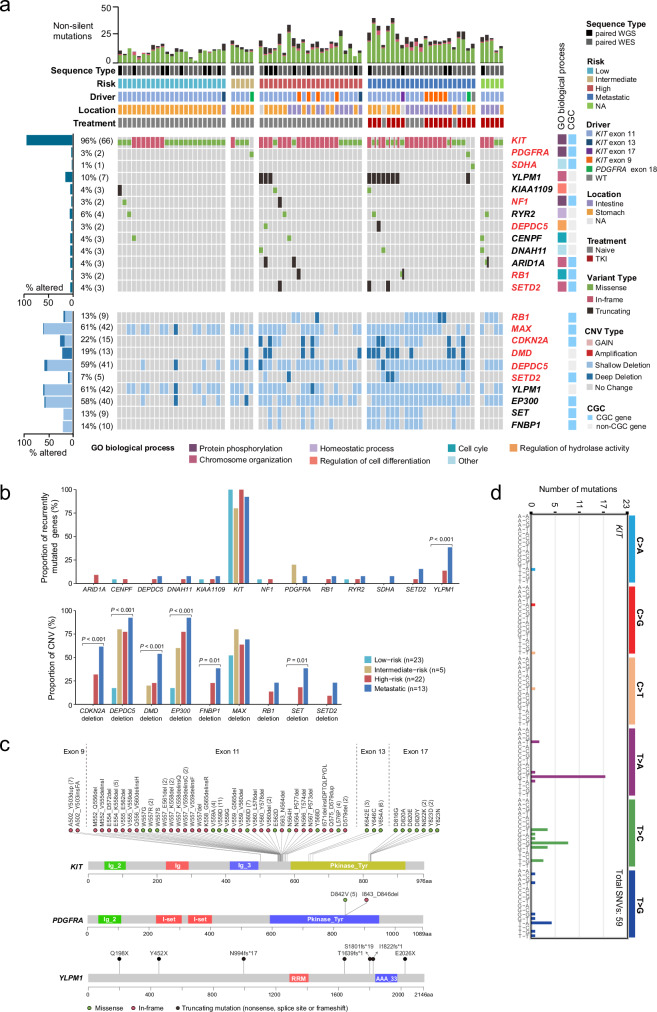
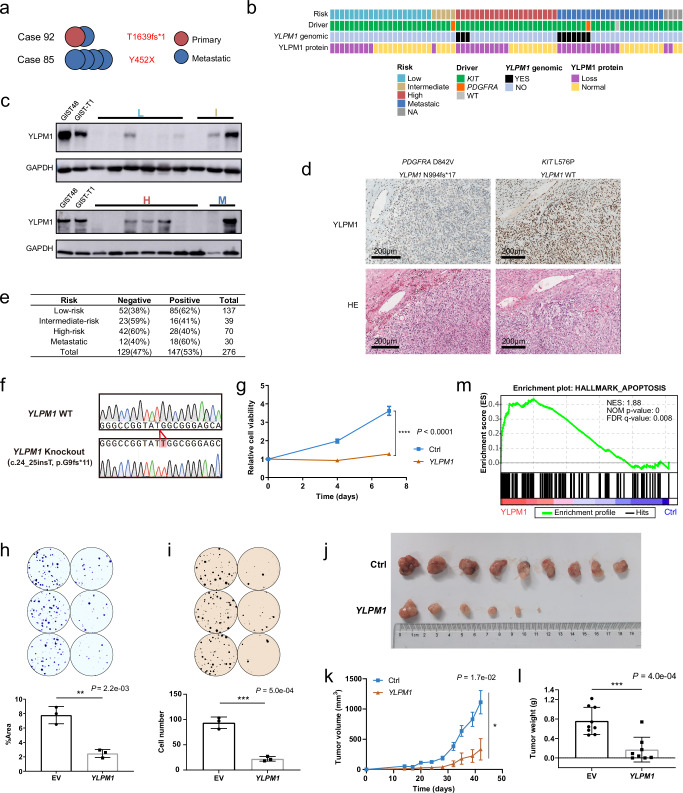
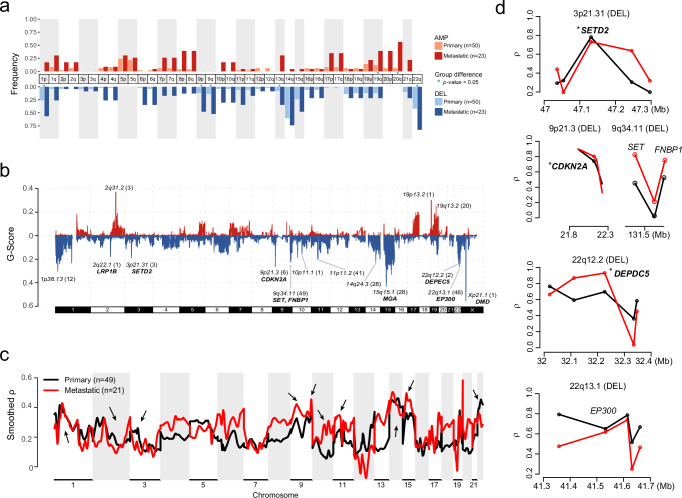
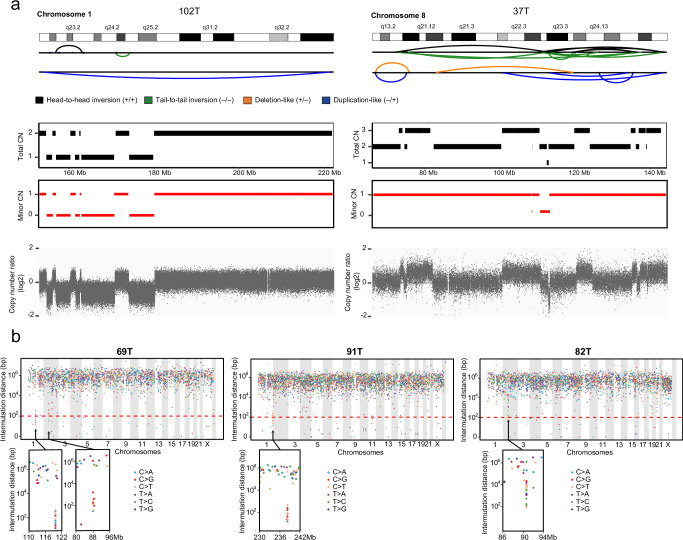
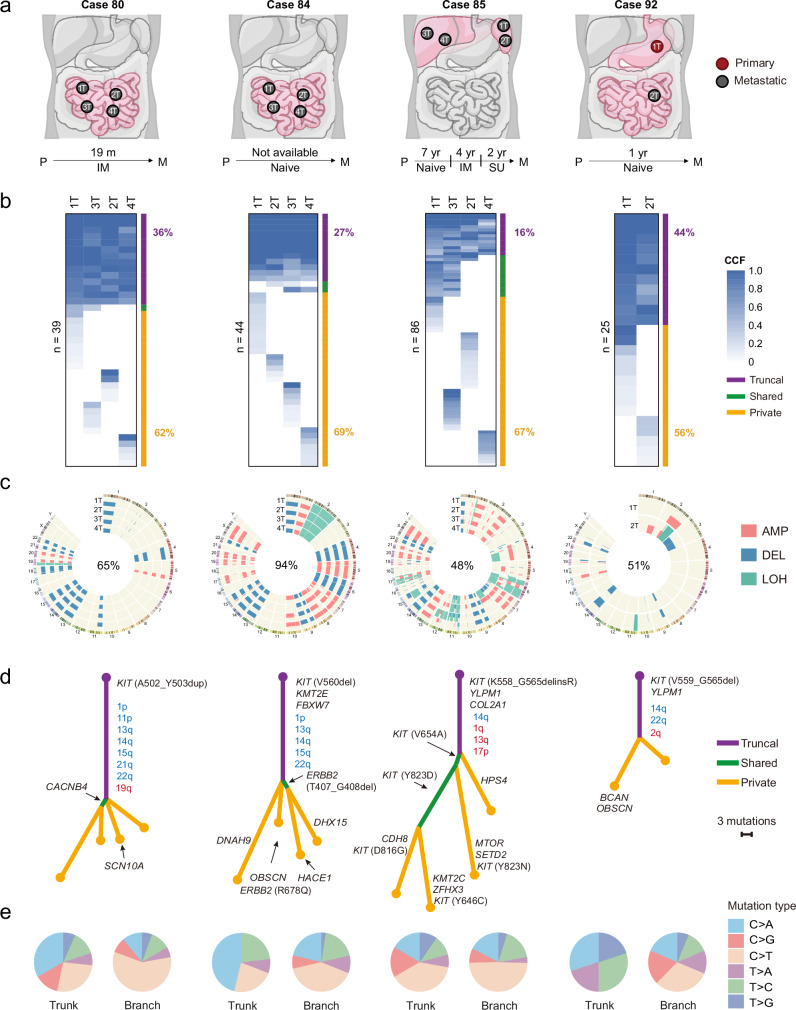
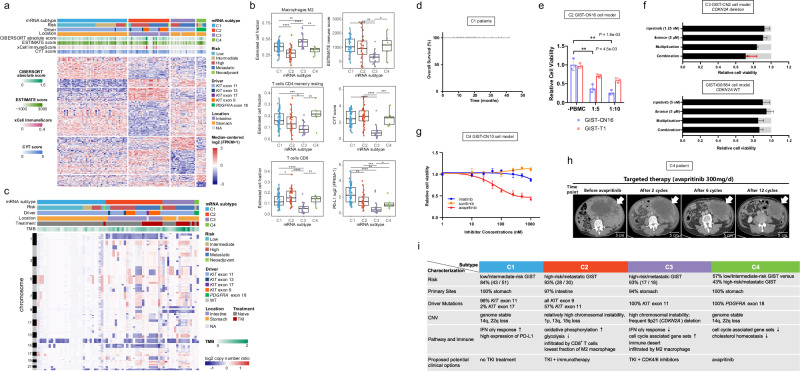
Gastrointestinal stromal tumor (GISTs) are clinically heterogenous exhibiting varying degrees of disease aggressiveness in individual patients. We comprehensively describe the genomic and transcriptomic landscape of a cohort of 117 GISTs including 31 low-risk, 18 intermediate-risk, 29 high-risk, 34 metastatic and 5 neoadjuvant GISTs from 105 patients. GISTs have notably low tumor mutation burden but widespread copy number variations. Aggressive GISTs harbor remarkably more genomic aberrations than low-/intermediate-risk GISTs. Complex genomic alterations, chromothripsis and kataegis, occur selectively in aggressive GISTs. Despite the paucity of mutations, recurrent inactivating YLPM1 mutations are identified (10.3%, 7 of 68 patients), enriched in high-risk/metastatic GIST and functional study further demonstrates YLPM1 inactivation promotes GIST proliferation, growth and oxidative phosphorylation. Spatially and temporally separated GISTs from individual patients demonstrate complex tumor heterogeneity in metastatic GISTs. Finally, four prominent subtypes are proposed with different genomic features, expression profiles, immune characteristics, clinical characteristics and subtype-specific treatment strategies. This large-scale analysis depicts the landscape and provides further insights into GIST pathogenesis and precise treatment.


Conflict of interest statement

The authors declare no competing interests.

Figures

Fig. 1
Fig. 1. Molecular landscape of the GIST cohort.
a Each column represents an individual tumor (n = 78). Patients with paired tumor and normal samples are separated into two groups: WGS (n = 19) and WES (n = 59). The top panel shows information about the clinical risk stratification, mutated exon of KIT or PDGFRA, primary tumor sites, and TKI treatment information. Each subsequent panel displays a specific molecular profile. NA, not available. Samples are ranked according to the risk stratification followed by the TMB. In the top panel, TKI indicates TKI treatment prior to surgery (tumor collection), and the GIST samples show pathologically progression (resistance) on TKIs before samples were collected. DEL, deletion; BND, translocation; INV, inversion; DUP, duplication. b Boxplots showing that the alternation burdens increase with risk stratification. Left, TMB of coding mutations, L (n = 23), I (n = 5), H (n = 22), and M (n = 23). Center, the percentage of CNV segments in autosomal genome region, L (n = 23), I (n = 5), H (n = 22), and M (n = 23). Right, the number of SVs in 19 WGS tumors, L (n = 8), H (n = 6), and M (n = 4). c Number of clone (left) and subclone (right) mutations in coding region among different risk stratification. L (n = 15), I (n = 5), H (n = 16), and M (n = 19). The P values in (b, c) are calculated using the two-sided wilcoxon rank-sum test (*P < 0.05; **P < 0.01; ***P < 0.001; ****P < 0.0001). L denotes low-risk, I denotes intermediate-risk, H denotes high-risk, M denotes metastatic. The low, centerline, and upper of boxplot represent the first quartile, the median, and the third quartile of data, respectively. The whiskers extend to the largest and smallest values within 1.5 times the interquartile range (IQR). Source data are provided as a Source Data file.
Fig. 2
Fig. 2. Landscape of genomic alterations in 78 GISTs.
a Integrated plots of clinical and genomic alterations in 78 GISTs from 68 patients. The middle panel shows selected mutated genes and variant types. Known driver genes of GIST and recurrently mutated genes detected in at least 3 patients are included. The mutation frequency of each gene is shown as a bar plot on the left with the number of affected cases labeled in parentheses. The corresponding GO biological process for each gene are shown as colored blocks on the right. Blue annotations on the right indicate whether the genes are in the Cancer Gene Census (CGC) list. The bottom panel shows selected focal CNV genes detected by GISTIC2.0. The copy number: CN = 0 indicates a Deep Deletion, CN = 1 indicates a Shallow Deletion, CN = 3 indicates a Gain and ≥4 indicates an Amplification. The red gene symbols indicate known GIST drivers. b Bar plots illustrating relative proportion of recurrently mutated genes (top) and copy number alterations (bottom) by different risk. c Lollipop plots showing the distribution of all non-silent mutations in KIT, PDGFRA, and YLPM1. The scale bars represent the length (amino acids) of the protein sequence and the protein domains of the gene are indicated by colors. The number in parentheses denotes the number of patients. d 96-mutation spectrum of KIT mutations in GISTs. A total of 59 SNVs are identified in 46 GISTs. The distributions of KIT mutations are different from the overall SNV distributions, showing T > C and T > A bias. Source data are provided as a Source Data file.
Fig. 3
Fig. 3. High frequency of YLPM1 inactivation in GISTs and YLPM1 inactivation promotes tumor growth and proliferation in vitro and in vivo.
a Multiple tumors from the same patients share the same YLPM1 mutation. b Summary of YLPM1 genomic and protein aberrations in 73 GISTs. c YLPM1 protein inactivation is demonstrated by immunoblotting of GIST biopsies. YLPM1 wild-type GIST48 and GIST-T1 cell lines are used as positive controls. YLPM1 inactivation is defined by relative expression level (YLPM1/GAPDH) < 0.3, normalized to GIST-T1. All panels represent data from 3 times independent experiments. d Hematoxylin and eosin stains (bottom) and YLPM1 immunohistochemistry (IHC) stains (top): case 94 with wild-type YLPM1 shows retained YLPM1 expression; case 104 with YLPM1 frameshift mutation shows a loss of YLPM1 expression. e Summary of YLPM1 expression assessed by IHC in tissue microarrays validation cohort. fm Restoration of YLPM1 suppresses tumor growth and proliferation in YLPM1-inactivated GISTs. f Sanger sequencing shows that GIST-T1YLPM1 KO isogenic cells are successfully established. g Lentivirus-mediated YLPM1 restoration reduces the viability of GIST-T1YLPM1 KO cells, as assessed by CellTiter-Glo viability assay. Data are presented as mean values ± s.d. n = 3. h Crystal violet staining assays show that restoration of YLPM1 suppresses cell proliferation. Representative plates (top) and mean percentage area (bottom) are shown. Data are presented as mean values ± s.d. n = 3. i Restoration of YLPM1 inhibits anchorage-independent growth. Representative plates (top) and mean colony numbers (bottom) are shown. Data are presented as mean values ± s.d. n = 3. jl Restoration of YLPM1 suppresses the growth of GIST-T1YLPM1 KO xenografts in nude mice. Photo images (j) (n = 9 mice for Ctrl, n = 8 mice for YLPM1 restoration, note that no tumor growth in 2 mice), growth curves (k), and tumor weight (l) of transplanted tumors are shown. Error bars are the mean ± s.e.m.. m GSEA reveals that genes involved in Hallmark apoptosis gene set are upregulated in GIST-T1YLPM1 KO group. NES, normalized enrichment score. NOM P-value, Nominal P-value. All the P values are calculated using the two-sided Student’s t test. Source data are provided as a Source Data file.
Fig. 4
Fig. 4. Genomic imbalances.
a Chromosome arm-level CNV frequencies in different risk stratification of 73 GISTs. Dark red, red and light red represent the amplification (AMP) frequencies in primary (low-risk, intermediate-risk and high-risk, n = 50) and metastatic GISTs (n = 23), respectively. Dark blue, blue and light blue represent the deletion (DEL) frequencies in low or intermediate-risk, high-risk and metastatic GISTs, respectively. Arms with significant group differences are denoted by green asterisks (both the GISTIC q value and chi-square test P value < 0.05). b Focal-level copy number gains and losses across chromosomes 1-22 and X detected by GISTIC 2.0, with the G-score labeled on the vertical axis. Selected cancer-associated genes are labeled in the significant peak regions. c, d Associations between quantitative measurements of CNV and gene expression in different risk groups using MVisAGe R-package. Black represent primary GISTs (n = 49) and red represent metastatic GISTs (n = 21). c Genome-wide plot of smoothed gene-level Pearson correlation coefficients (smoothed ρ values) across chromosomes 1–22. Arrows indicate focal-CNV peaks from GISTIC. d Unsmoothed ρ values and selected genes are plotted based on genomic positions in selected regions from focal-CNV peaks. The asterisks indicate known drivers in GIST. Source data are provided as a Source Data file.
Fig. 5
Fig. 5. Complex genomic aberrations.
a SV and CNV profiles for two aggressive cases with CN oscillation features of chromothripsis. (Left) Evidence of chromothripsis on chromosome 1 in a metastatic GIST with CN oscillations between 2 CN levels and LOH. (Right) Evidence of chromothripsis on chromosome 8 in a high-risk GIST with CN oscillations that span 3 CN levels. The chromosome location and the SV calls in the chromothripsis region are shown on the top panel. The subsequent panel displays the total CN (black rectangle), minor CN (red rectangle) and the total copy number log-ratio for SNPs (gray dots) within the affected region. CN, copy number. b Rainfall plots showing the inter-mutation distance versus the genomic position for 3 GISTs with localized hypermutations. The horizontal axis shows mutations ordered by chromosome loci (from the first mutated position on chromosome 1 to the last mutated position on chromosome Y), and the vertical axis represents the inter-mutation distance. The lower section shows the localized hypermutation loci in detail. Source data are provided as a Source Data file.
Fig. 6
Fig. 6. Delineation of the metastatic evolution of GISTs.
a Diagram of metastatic foci (P = primary GIST; M=metastatic GIST), time to recurrence (m=months, yr=years) and TKI target therapy (IM = imatinib, SU = sunitinib, Naïve = no TKI therapy). b Heatmaps indicate the cancer cell fraction (CCF) of non-silent mutations in each lesion from 4 patients. The number of mutations is labeled on the left. The percentage of truncal (purple) and private (yellow) mutations is labeled on the right. c Identified regions of CNV and copy-neutral (CN-LOH) in each lesion from 4 patients. The percentage of truncal CNVs is labeled at the center of the Circos plot. d Phylogenetic trees of 4 patients based on all non-silent mutations. Branch and trunk lengths are proportional to their number mutations. Selected cancer-associated genes and truncal CNV arms are indicated with arrows. For non-silent mutations: purple=mutations present in all samples; green=mutations shared by partial samples, yellow=private mutations. For CNVs: truncal arm-level copy number deletion events are labeled in blue, and truncal arm-level copy number amplification events are labeled in red. e Relative contribution of 6 base mutations in the trunks (left circles) and branches (right circles). Trunk equals to truncal SNVs in (b), branch equals to shared and private SNVs in (b). Source data are provided as a Source Data file.
Fig. 7
Fig. 7. Molecular subtypes of GISTs.
a Consensus clustering results of GISTs (n = 106) based on the RNA expression. Heatmap shows 520 differentially expressed genes among 4 subtypes. The number of tumors for C1, C2, C3, and C4 subtype is 51, 30, 18, and 7, respectively. Clinical risk stratification, driver mutations, location, immune scores from CIBERSORT, ESTIMATE and xCell and cytolytic (CYT) score are shown. b Boxplots showing the estimated cell fractions, immune score, CYT score and PD-L1 expression among 4 subtypes. The P values are calculated using the two-sided wilcoxon rank-sum test (*P < 0.05; **P < 0.01; ***P < 0.001; ****P < 0.0001). The low, centerline, and upper of boxplot represent the first quartile, the median, and the third quartile of data, respectively. The whiskers extend to the largest and smallest values within 1.5 times IQR. c Copy-number-based clustering results. Heatmap shows log2 copy-number ratio across the genome. d Overall survival of C1 patients (n = 29). e T cell-mediated tumor cell killing assay in C2 subtype cells. After 3 days of incubation of GIST-CN16 or GIST-T1 cells with PBMC, CTG viability assay was performed. Data are presented as mean values ± s.d. n = 3. The P values are calculated using the two-sided Student’s t test. f Cell viability assay reveals the synergistic effect of KIT inhibitor and CDK4/6 inhibitor. Top, GIST-CN2 primary cells established from C3 subtype GIST (94T, CDKN2A deletion). Bottom, GIST430/654 cell line (CDKN2A WT). Light gray bars indicate control values. “Multiplication” indicates expected effect of combined treatment if single-treatment effects are multiplied; red arrow indicates actual effect of combination. Data are presented as mean values ± s.d. n = 3. g GIST-CN10 primary cells established from PDGFRA D842V-mutant, C4 subtype show response to avapritinib, but resistance to imatinib or sunitinib. Data are presented as mean values ± s.d. n = 3. h Clinical data with avapritinib confirm evidence of activity in patient with metastatic C4 subtype GIST. Avapritinib induces rapid radiographic clinical response. i Highlights of the genomic features, expression profiles, immune characteristics and potential treatment strategies for the GIST subtypes. Source data are provided as a Source Data file.

References

    1. Hirota, S. et al. Gain-of-function mutations of c-kit in human gastrointestinal stromal tumors. Science279, 577–580 (1998). - PubMed
    1. Heinrich, M. C. et al. PDGFRA activating mutations in gastrointestinal stromal tumors. Science299, 708–710 (2003). - PubMed
    1. Corless, C. L., Barnett, C. M. & Heinrich, M. C. Gastrointestinal stromal tumours: origin and molecular oncology. Nat. Rev. Cancer11, 865–878 (2011). - PubMed
    1. Blay, J. Y., Kang, Y. K., Nishida, T. & von Mehren, M. Gastrointestinal stromal tumours. Nat. Rev. Dis. Prim.7, 22 (2021). - PubMed
    1. Abraham, S. C., Krasinskas, A. M., Hofstetter, W. L., Swisher, S. G. & Wu, T. T. Seedling” mesenchymal tumors are common incidental tumors of the esophagogastric junction. Am. J. Surg. Pathol.31, 1629–1635 (2007). - PubMed

Publication types

LinkOut - more resources