. 2024 Nov 3;15(1):9494.
doi: 10.1038/s41467-024-53758-5.

Decoding the epigenetics and chromatin loop dynamics of androgen receptor-mediated transcription

Affiliations

Decoding the epigenetics and chromatin loop dynamics of androgen receptor-mediated transcription

Umut Berkay Altıntaş et al. Nat Commun. .

Abstract

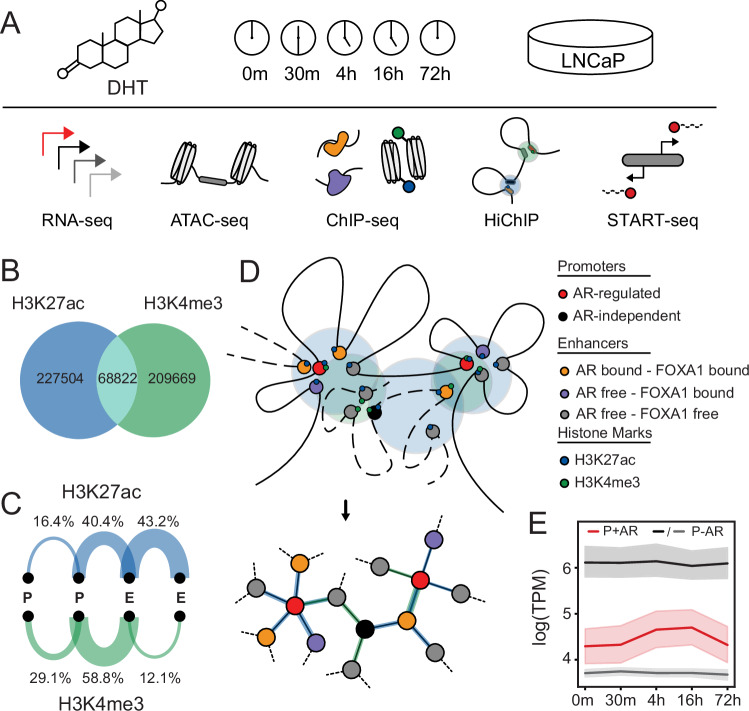
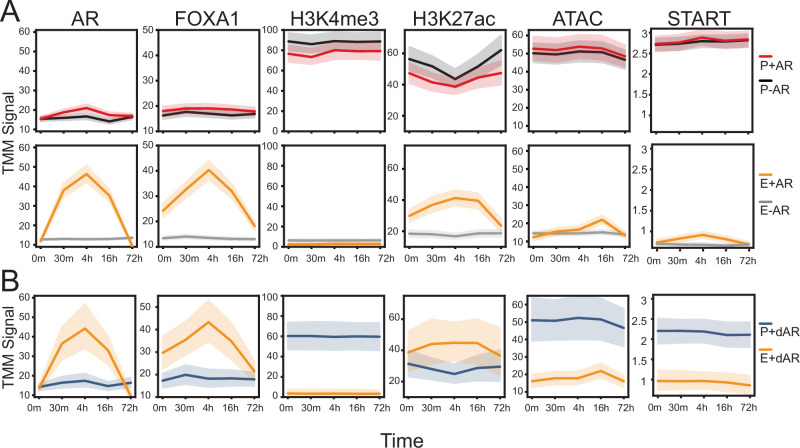
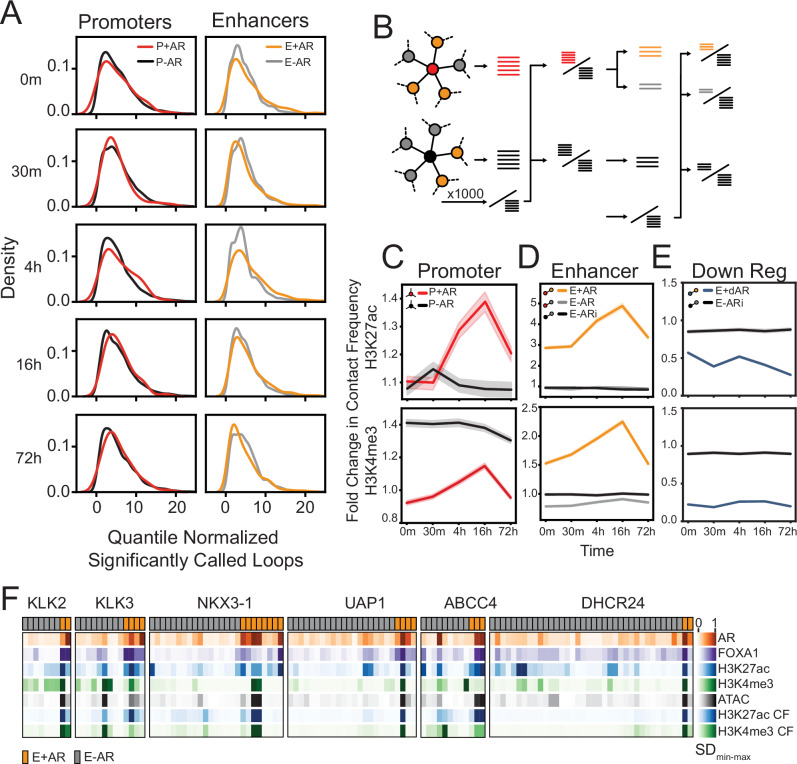
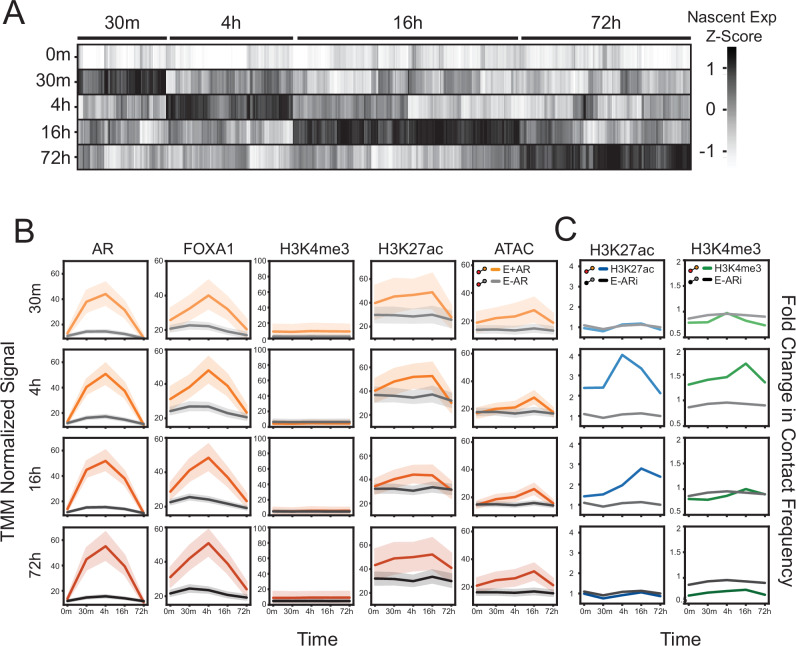
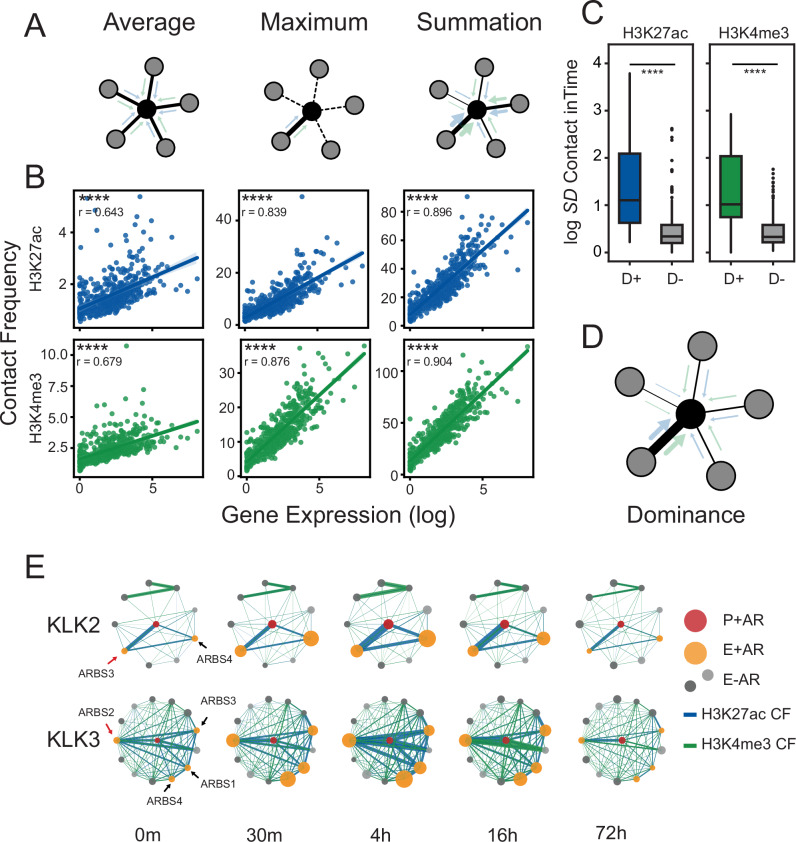
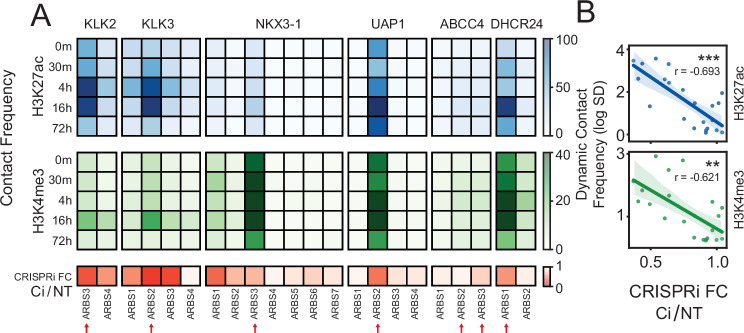
Androgen receptor (AR)-mediated transcription plays a critical role in development and prostate cancer growth. AR drives gene expression by binding to thousands of cis-regulatory elements (CRE) that loop to hundreds of target promoters. With multiple CREs interacting with a single promoter, it remains unclear how individual AR bound CREs contribute to gene expression. To characterize the involvement of these CREs, we investigate the AR-driven epigenetic and chromosomal chromatin looping changes by generating a kinetic multi-omic dataset comprised of steady-state mRNA, chromatin accessibility, transcription factor binding, histone modifications, chromatin looping, and nascent RNA. Using an integrated regulatory network, we find that AR binding induces sequential changes in the epigenetic features at CREs, independent of gene expression. Further, we show that binding of AR does not result in a substantial rewiring of chromatin loops, but instead increases the contact frequency of pre-existing loops to target promoters. Our results show that gene expression strongly correlates to the changes in contact frequency. We then propose and experimentally validate an unbalanced multi-enhancer model where the impact on gene expression of AR-bound enhancers is heterogeneous, and is proportional to their contact frequency with target gene promoters. Overall, these findings provide insights into AR-mediated gene expression upon acute androgen simulation and develop a mechanistic framework to investigate nuclear receptor mediated perturbations.


Conflict of interest statement

The authors declare no competing interests.

Figures

Fig. 1
Fig. 1. Design of temporal multi-omics dataset and construction of a bioinformatic framework.
A Schematic representation of the experimental design. LNCaP cells were treated with 10 nM DHT and samples were collected at five different time points (0 m, 30 m, 4 h, 16 h, 72 h) for RNA-seq, ATAC-seq, ChIP-seq (AR, FOXA1, H3K27ac, H3K4me3), HiChIP (H3K27ac, H3K4me3), and Start-seq. B Venn diagram representing significantly called chromatin loops from merged H3K27ac and H3K4me3 HiChIP datasets. C Arc plots representing percentages of promoter-promoter (P-P), enhancer/CRE-promoter (E-P), and enhancer/CRE-enhancer/CRE (E-E) loops for H3K27ac and H3K4me3 HiChIP. D Graphical representation of a regulatory network. E Gene expression profile of androgen response hallmark genes (P + AR; red), highly expressed (first quartile; P-AR; black) and mid-high (second quartile; P-AR; gray) expressed genes at all time points. The solid line represents the mean, and the error bars indicate the 95% confidence.
Fig. 2
Fig. 2. Activation of the androgen receptor leads to a delayed increase in histone modifications and chromatin accessibility.
A Trimmed mean of M values (TMM) normalized ChIP-seq or ATAC-seq or Start-seq signal were compared across all time points at different regulatory elements, including: Promoters of AR upregulated genes (P + AR: red), promoters of AR-independent genes (P-AR: black), AR-bound enhancers (E + AR: yellow) of AR-regulated genes, AR-free enhancers (E-AR: gray) of AR-independent genes. B A similar analysis was done for the promoters of AR-downregulated genes (P+dAR: blue), and their AR-bound enhancers (E+dAR: yellow). For all figures, the solid line represents the mean, and the error bars indicate the 95% confidence.
Fig. 3
Fig. 3. AR-bound enhancers only increase contact frequency to AR-regulated gene promoters.
A Kernel density estimation of the number of significantly called loop anchoring promoters (left; AR-regulated promoters are in red; AR-independent promoter backgrounds are in black) or enhancers (right; AR-bound enhancers are in yellow; AR-free CRE background are in gray) at each time point (H3K27ac HiChIP). Each row represents the significantly called loops at each time point separately, and not reference loops. B Schematic representation of fold change in contact frequency calculation for a given gene set (left), from its promoter’s viewpoint (middle), from its enhancers’ viewpoint (right). The query loop sets are compared to the same reference loop set. Promoter view: The AR-regulated gene promoter loops (red sticks) and a random set of AR-independent gene promoter loops (black sticks) are compared to the reference loops, which are selected from AR-independent promoter loops (denominator black sticks). Enhancer view: The loops of AR-bound enhancers (yellow sticks) and AR-free enhancers (gray sticks), and loops of AR-free enhancers (black sticks) that interact with AR-independent gene promoters are compared to the reference loops which are selected from AR-independent promoters that interact with AR-free enhancers (denominator black sticks). C Fold change in chromatin loop contact frequency of AR-regulated gene promoters (P + AR; red) and highly expressed AR-independent gene promoters (P-AR; black). D Fold change in contact frequency of AR-bound enhancers that loop to AR-regulated genes (E + AR; yellow), AR-free enhancers looping to AR-regulated genes (E-AR; gray), and AR-free enhancers looping to highly expressed AR-independent genes (E-ARi; black). E Fold change in contact frequency in AR-bound enhancers looping to AR-downregulated genes (E+dAR; blue), and AR-free enhancers looping to highly expressed genes (E-ARi; black). F Min-max normalized standard deviation (SD) following androgen treatment for AR, FOXA1, H3K27ac, and H3K4me3 ChIP-seq, ATAC-seq and H3K27ac and H3K4me3 HiChIP contact frequency (CF) are depicted for AR-bound (E + AR; orange) and AR-free (E-AR; gray) CREs of six selected AR-regulated genes (KLK2, KLK3, NKX3-1, UAP1, ABBCC4, and DHCR24). For all line plots (CE), the solid line represents the mean, and the error bars indicate the 95% confidence.
Fig. 4
Fig. 4. Temporal changes of nascent RNA.
A Clustering of nascent capped mRNA (Start-seq) according to time-dependent maximum expression. The union of upregulated transcripts’ nascent expression level across all time points were z-score normalized. B TMM normalized ChIP-seq or ATAC-seq of the following regulatory elements: AR-bound enhancers (E + AR: yellow) and AR-free enhancers (E-AR: gray). Each row represents the enhancers that loop to those genes that are maximally expressed at that time point (see A). C Fold change in contact frequency of AR-bound enhancers looping to maximally expressed genes for H3K27ac (E + AR; blue) and H3K4me3 (E + AR; green) HiChIP. These CREs were compared to AR-free enhancers of highly expressed genes (E-ARi; black) in both HiChIP datasets. For all line plots (B, C), the solid line represents the mean, and the error bars indicate the 95% confidence.
Fig. 5
Fig. 5. Multi-enhancer contact is strongly influenced by a dominant loop.
A Schematic representation of tested multi-enhancer models. The average model (left) represents an equal impact of all CREs (surrounding nodes; gray) on gene promoter (center node; black). The maximum model (middle) represents only one neighbor (unbroken line) impact on the gene promoter (center node; black). The summation model (right) proposes that all variable CREs (different widths of blue/green arrows) impact additively with their contact frequency to gene promoter. B Scatter plot of binned (k = 25) log expression (x-axis) vs. contact frequency (y-axis) according to the proposed multi-enhancer models function (16 h HiChIP). The solid line represents the mean, and the error bars indicate the 95% confidence. The correlation was calculated by linear regression. The significance was assessed by Spearman’s rank correlation (pH3K27ac_avg ~1.81 × 10e-60, pH3K27ac_max ~3.07 × 10e-135, pH3K27ac_sum ~1.69 × 10e-179, pH3K4me3_avg ~1.42 × 10e-69, pH3K4me3_max ~1.74 × 10e-161, pH3K4me3_sum ~3.46 × 10e-188). C Standard deviation of H3K27ac and H3K4me3 HiChIP contact frequency change over time for dominant AR-bound CREs (D+) and non-dominant AR-bound CREs (D−) that interact with promoters of AR-regulated genes. The significance was assessed by Mann–Whitney U-test (pH3K27ac ~6.41 × 10e-12, pH3K4me3 ~4.34 × 10e-10). D Schematic representation of hypothesized multi-enhancer dominance model. The width of the arrows (blue/green) represents the contact frequency. E Circle plot representation of first-degree regulatory interactions of KLK2 (top) and KLK3 (bottom) genes. Promoters are shown in the center (red) and the first-degree interactions are either AR-bound (yellow) or AR-free (grays) CREs. The size of the nodes represents the AR ChIP-seq signal, and the width of the edges represents contact frequency (H3K27ac CF: blue, H3K4me3 CF: green). For all data ns p > 0.05, *p < 0.05, **p < 0.01, ***p < 0.001, ****p < 0.0001.
Fig. 6
Fig. 6. Androgen-induced gene expression is significantly affected by perturbing the most dominant AR-bound enhancers.
A Functional characterization of individual AR-bound CRE on androgen-induced expression. Heatmap of contact frequency strength at each time point (H3K27ac: blue, H3K4me3: green) for individual AR-bound CREs to a target gene promoter (KLK2, KLK3, NKX3-1, UAP1, ABCC4, and DHCR24). Each AR-binding site (ARBS) was individually inhibited with CRISPRi and treated with androgen (10 nM DHT). The inhibition of the target gene induction was calculated compared to the non-targeting control (CRISPRi FC Ci/NT; red). Dominant enhancers based on contact frequency are represented with a red arrow. B Correlation of CRISPRi-induced gene-knockdown and chromatin loop dynamic (standard deviation in time) contact frequency for each ARBS. The solid line represents the mean, and the error bars indicate the 95% confidence. The significance was assessed by Spearman’s rank correlation (pH3K27ac ~0.0003, pH3K4me3 ~0.002) (ns p > 0.05, *p < 0.05, **p < 0.01, ***p < 0.001, ****p < 0.0001).

Update of

References

    1. Nelson, P. S. et al. The program of androgen-responsive genes in neoplastic prostate epithelium. Proc. Natl Acad. Sci. USA99, 11890–11895 (2002). - DOI - PMC - PubMed
    1. Davey, R. A. & Grossmann, M. Androgen receptor structure, function and biology: from bench to bedside. Clin. Biochem. Rev.37, 3–15 (2016). - PMC - PubMed
    1. Georget, V., Térouanne, B., Nicolas, J.-C. & Sultan, C. Mechanism of antiandrogen action: key role of hsp90 in conformational change and transcriptional activity of the androgen receptor. Biochemistry41, 11824–11831 (2002). - DOI - PubMed
    1. Ozanne, D. M. et al. Androgen receptor nuclear translocation is facilitated by the f-actin cross-linking protein filamin. Mol. Endocrinol.14, 1618–1626 (2000). - DOI - PubMed
    1. Teng, M., Zhou, S., Cai, C., Lupien, M. & He, H. H. Pioneer of prostate cancer: past, present and the future of FOXA1. Protein Cell12, 29–38 (2021). - DOI - PMC - PubMed

Publication types

Associated data