. 2025 Feb;44(3):130-146.
doi: 10.1038/s41388-024-03208-9. Epub 2024 Nov 3.

Manipulating the EphB4-ephrinB2 axis to reduce metastasis in HNSCC

Affiliations

Manipulating the EphB4-ephrinB2 axis to reduce metastasis in HNSCC

Khalid N M Abdelazeem et al. Oncogene. 2025 Feb.

Abstract

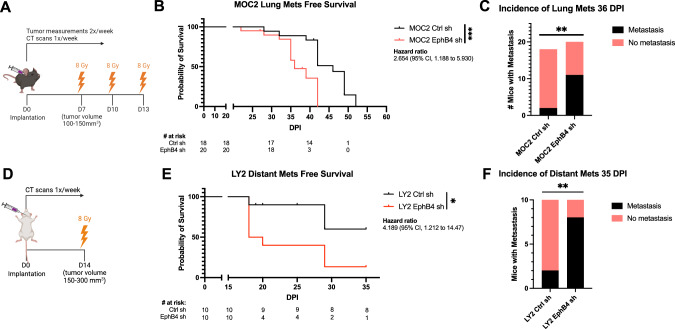
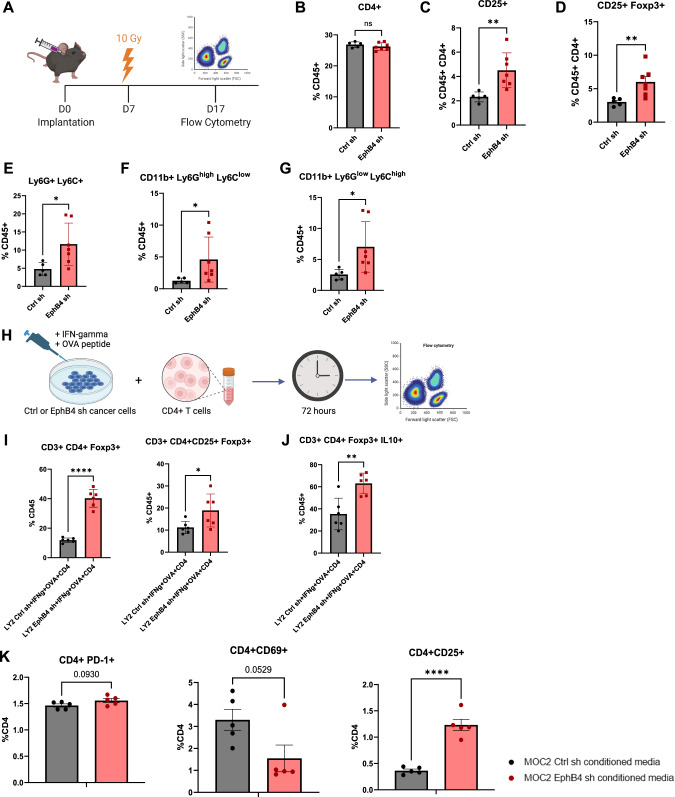
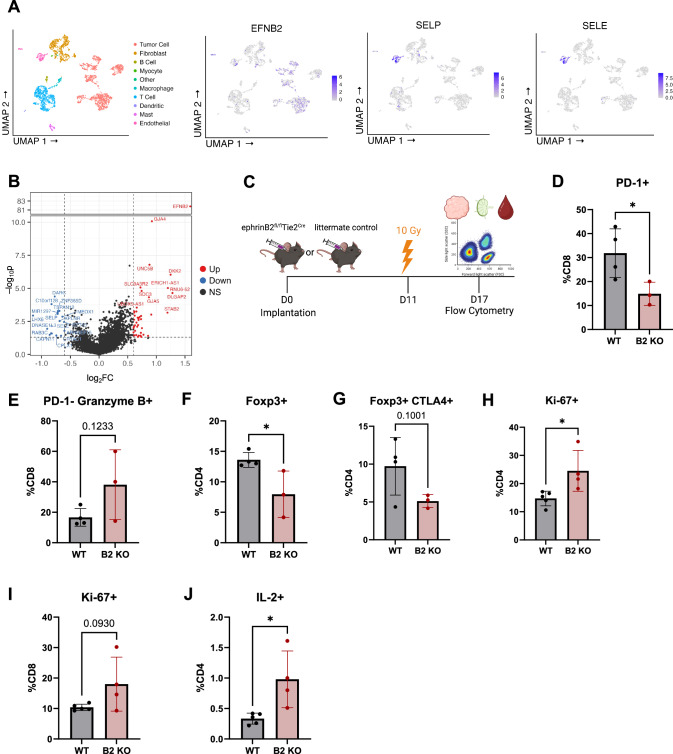
The EphB4-ephrinB2 signaling axis has been heavily implicated in metastasis across numerous cancer types. Our emerging understanding of the dichotomous roles that EphB4 and ephrinB2 play in head and neck squamous cell carcinoma (HNSCC) poses a significant challenge to rational drug design. We find that EphB4 knockdown in cancer cells enhances metastasis in preclinical HNSCC models by augmenting immunosuppressive cells like T regulatory cells (Tregs) within the tumor microenvironment. EphB4 inhibition in cancer cells also amplifies their ability to metastasize through increased expression of genes associated with hallmark pathways of metastasis along with classical and non-classical epithelial-mesenchymal transition. In contrast, vascular ephrinB2 knockout coupled with radiation therapy (RT) enhances anti-tumor immunity, reduces Treg accumulation into the tumor, and decreases metastasis. Notably, targeting the EphB4-ephrinB2 signaling axis with the engineered ligands ephrinB2-Fc-His and Fc-TNYL-RAW-GS reduces local tumor growth and distant metastasis in a preclinical model of HNSCC. Our data suggests that targeted inhibition of vascular ephrinB2 while avoiding inhibition of EphB4 in cancer cells could be a promising strategy to mitigate HNSCC metastasis.


Conflict of interest statement

Competing interests: Dr. Karam receives clinical funding from Genentech that does not relate to this work. She receives clinical trial funding from AstraZeneca which is not related to this manuscript. She also receives preclinical research funding from Roche and Amgen, neither one of which is related to this manuscript. The remaining authors declare no competing interests. Ethics approval and consent to participate: All mice were handled and euthanized consistent with the ethics guidelines and conditions set and overseen by the University of Colorado, Anschutz Medical Campus Animal Care and Use Committee. The study has been approved by the Institutional Animal Care and Use Committee (Protocol number: 250). This study did not use any human subjects or identifiable images from human research patients.

Figures

Fig. 1
Fig. 1. Knockdown of EphB4 in HNSCC cancer cells promotes distant metastasis.
A Schematic showing experimental design for C57BL/6 J mice implanted with 100k MOC2 cancer cells. 3 fractions of 8 Gray (Gy) radiation therapy (RT) were given as indicated. B Kaplan-Meier curves showing lung metastasis free survival of MOC2 control (Ctrl) shRNA (sh) (n = 18) versus EphB4 shRNA(n = 20) tumors implanted in C57BL/6 J mice. Numbers at risk indicate mice that were alive without metastases at specified timepoints. C Contingency table quantifying the incidence of lung metastasis detected by computed tomography (CT) scans in C57BL/6 mice implanted with MOC2 cancer cells by 36 days post-implantation (DPI). D Schematic showing experimental design for BALB/c mice implanted with 100k LY2 cancer cells. One fraction of 8 Gy RT was given as indicated. E Kaplan-Meier curves showing distant metastasis free survival of LY2 Ctrl shRNA (n = 10) vs LY2 EphB4 (n = 10) shRNA tumors implanted in BALB/c mice. Numbers at risk indicate mice that were alive without metastases at specified timepoints. F Contingency table quantifying the incidence of distant metastases detected by CT scans in BALB/c mice implanted with LY2 Ctrl shRNA or EphB4 shRNA tumors by 35 DPI. The experiments were replicated twice. For Kaplan-Meier survival curves, significance was determined by a log-rank Mantel-Cox test. For contingency tables indicating the incidence of metastases, significance was determined by a Chi-square test. Significance was determined if the p-value was < 0.05*, < 0.01**, and < 0.001***. p-values are indicated for the figures (B) ***p = 0.0009, (C) **p = 0.0044, (E) *p = 0.0200, (F) **p = 0.0073. The error bars represent the standard error of the mean ( ± SEM).
Fig. 2
Fig. 2. Loss of EphB4 in cancer cells induces protein dysregulation concomitant with increased metastatic capacity.
A Representative images and quantification for Boyden chamber invasion assay conducted on MOC2 control (n = 4) or EphB4 (n = 4) CRISPR knockout (KO) cell lines. B Variable importance in projection (VIP) score plots of mass spectrometry proteomics data conducted on MOC2 EphB4 KO (n = 5) and Ctrl (n = 5) tumors displaying upregulation of BCCIP and Ube2v1 proteins in EphB4 KO tumors compared to control tumors. C Hallmark pathways generated from RNA-sequencing of MOC2 control (n = 3) versus EphB4 (n = 3) shRNA cell lines. D RNA-sequencing of MOC2 control (n = 3) and EphB4 (n = 3) shRNA knockdown (KD) cells showing expression of genes associated with IL6-Jak-Stat3 and TNF-alpha signaling via NFκB. E Expression of genes quantified using RNA-sequencing of MOC2 control (n = 3), EphB4 (n = 3), and ephrinB2 (EFNB2) (n = 3) CRISPR KO cells. F Expression of genes associated with intermediate filament cytoskeleton quantified using RNA-sequencing of MOC2 control (n = 3), EphB4 (n = 3), and ephrinB2 (n = 3) CRISPR knockout cell lines. The experiments were performed once with their own biological replicates. For Boyden chamber quantification, comparison of invaded cells between the control and experimental group was done using a two-sided student’s t-test. Significance was determined if the p-value was < 0.05*, < 0.01**, < 0.001***, and < 0.0001****. p-values are indicated for the figures (A) ***p = 0.0002. The error bars represent the standard error of the mean ( ± SEM).
Fig. 3
Fig. 3. Knockdown of EphB4 in cancer cells combined with radiation treatment promotes suppressive intratumoral immune populations.
A Experimental design for C57BL/6 J mice implanted with MOC2 cancer cells. The buccal tumor received single dose of radiation treatment (10 Gy) on day 7 after implantation. BG Flow cytometric quantification of CD4 + T cells (B), regulatory T cells (Tregs) defined by CD4 + CD25+ (C) and CD4 + CD25+ Foxp3+ expression (D), myeloid-derived suppressor cells (MDSCs) defined by CD45 + Ly6G + Ly6C+ (E), CD45 + CD11b+ Ly6Ghigh Ly6Clow (F), and CD45 + CD11b+ Ly6Glow Ly6Chigh (G) in the tumor microenvironment (TME) (Ctrl sh, n = 5; EphB4 sh n = 7). H Experimental design for coculture of LY2 Ctrl or EphB4 shRNA cancer cells with CD4 + T cells. Cancer cells were incubated with interferon-gamma (IFNg) for 48 h, then OVA peptide overnight. CD4 + T cells from DO11.10 BALB/c mice were then cocultured with the cancer cells for 72 hours and subsequently harvested for flow cytometry. I Flow cytometry quantification of Tregs defined by CD4+ Foxp3+ and CD4 + CD25+ Foxp3+ expression (n = 6 per group). J Flow cytometry quantification of Treg immunosuppressive function defined by IL-10 expression (n = 6 per group). K Flow cytometry quantification of CD4 + T cells treated with conditioned media from MOC2 control or EphB4 shRNA cells showing PD-1, CD69, and CD25 expression (n = 5 per group). The experiments were performed once with their own biological replicates. Comparison between control and experimental groups was done using a Mann Whitney test for the in vivo experiment and a two-sided student’s t-test for the in vitro experiments. Significance was determined if the p-value was < 0.05*, < 0.01**, < 0.001***, and < 0.0001****. p-values are indicated for the figures (B) ns p = 0.3636, (C) **p = 0.0025, (D) **p = 0.0051, (E) *p = 0.0177, (F) *p = 0.0101, (G) *p = 0.0101, (I) CD3 + CD44+Foxp3+ ****p < 0.0001; CD3 + CD4 + CD25+Foxp3+ *p = 0.0394, (J) **p = 0.0027, (K) ****p < 0.0001. The error bars represent the standard error of the mean ( ± SEM).
Fig. 4
Fig. 4. Knockout of ephrinB2 in the vasculature significantly reduces distant metastases.
A Breeding strategy for creating mice with ephrinB2 (EFNB2) KO on vascular endothelial cells. B Average tumor volume curve and dot plot showing significantly smaller average tumor volume at 34 DPI in ephrinB2fl/flTie2Cre (EFNB2 KO) mice (n = 10) implanted with MOC2 tumors compared to wild-type (WT) hosts (n = 11). C Kaplan-Meier curves showing lung metastasis free survival of WT hosts (n = 14) and ephrinB2 KO (n = 11) mice. Numbers at risk indicate mice that were alive without metastases at specified timepoints. D Contingency table showing incidence of lung metastases detected by CT scans in ephrinB2 KO mice (n = 11) versus WT hosts (n = 14) by 36 DPI. The experiment was replicated twice. Comparison of tumor volume between the control and experimental group was done using a two-sided student’s t-test. For Kaplan-Meier survival curves, significance was determined by a log-rank Mantel-Cox test. For contingency tables indicating the incidence of metastases, significance was determined by a Chi-square test. Significance was determined if the p-value was < 0.05*, < 0.01**, < 0.001***, and < 0.0001****. p-values are indicated for the figures (B) ****p < 0.0001, (C) *p = 0.0172. The error bars represent the standard error of the mean ( ± SEM).
Fig. 5
Fig. 5. Knockout of ephrinB2 in vascular endothelial cells enhances anti-tumor immune cell populations in the TME.
A UMAP plots showing expression of ephrinB2, SELP, and SELE in endothelial cells from human HNSCC single-cell sequencing. B Volcano plot showing differential gene expression of endothelial cells that do (red) or do not (blue) express ephrinB2 from human HNSCC single-cell sequencing. C Experimental design for flow cytometric analysis of MOC2 WT tumors implanted in ephrinB2 KO (B2 KO) mice and littermate controls. DG Flow cytometry analysis displaying quantification of PD-1 expressing CD8 + T cells (D), PD-1- Granzyme B+ expressing CD8 + T cells (E), Tregs defined by Foxp3 expression (F), and immunosuppressive Tregs defined by the addition of CTLA-4 expression (G) in the TME (WT, n = 4; B2 KO, n = 3). HJ Flow cytometry analysis of proliferating CD4 + T cells defined by Ki-67 expression (H), proliferating CD8 + T cells defined by Ki-67 expression (I), and IL-2 expressing CD4 + T cells (J) in the draining lymph nodes (DLNs) (WT, n = 5; B2 KO, n = 4). The experiments were performed once with their own biological replicates. Comparison of differences between the control and experimental group was done using a two-sided student’s t-test. Significance was determined if the p-value was < 0.05*, < 0.01**, < 0.001***, and < 0.0001****. p-values are indicated for the figures (D) *p = 0.0466, (F) *p = 0.0358, (H) *p = 0.0247, (J) *p = 0.0177. The error bars represent the standard error of the mean ( ± SEM).
Fig. 6
Fig. 6. EphrinB2-Fc-His and Fc-TNYL-RAW-GS reduce local tumor growth and distant metastasis in C57BL/6 mice implanted with MOC2 cells.
A Experimental design for C57BL/6 J mice implanted with MOC2 WT cancer cells and treated with different plasmids (n = 10 per group). Hydrodynamic tail vein injections (HTVI) and radiation therapy (8 Gy) were administered as indicated. Mice treated with RT alone or Sleeping Beauty (SB) + RT served as controls. B Average tumor volume curves comparing effects of different plasmids on local tumor growth. C Dot plot showing the effects of different plasmids on tumor volume 30 DPI. D, E Kaplan-Meier curves showing therapeutic effects of different plasmids on overall survival (D) and lung metastasis free survival (E) in MOC2 WT implanted C57BL/6 mice. For Kaplan-Meier curves showing lung metastasis free survival, numbers at risk indicate mice that were alive without metastases at specified timepoints. F Contingency table quantifying the incidence of lung metastasis detected by CT scans in MOC2 WT implanted mice by 35 DPI. The experiment was replicated twice. Comparison of tumor volume between the control and experimental groups was done using a Dunnett post hoc test after one-way ANOVA was performed. For Kaplan-Meier survival curves, significance was determined by a log-rank Mantel-Cox test. For contingency tables indicating the incidence of metastases, significance was determined by a Chi-square test. Significance was determined if the p-value was < 0.05*, < 0.01**, < 0.001***, and < 0.0001****. p-values are indicated for the figures (C) RT vs EFNB2-Fc-His ***p = 0.0003; RT vs Fc-TNYL-RAW-GS ***p = 0.0002; RT vs SB + RT ns p = 0.3757, (D) *p = 0.0485, (E) RT vs EFNB2-Fc-His **p = 0.0075; RT vs Fc-TNYL-RAW-GS *p = 0.0488, F **p = 0.0098. The error bars represent the standard error of the mean ( ± SEM).
Fig. 7
Fig. 7. EphrinB2-Fc-His activates EphB4 without concurrent activation of ephrinB2 while Fc-TNYL-RAW-GS activates both EphB4 and ephrinB2.
A Experimental design for C57BL/6 J mice implanted with MOC2 WT cancer cells. Hydrodynamic tail vein injections (HTVI) and radiation therapy (8 Gy) were administered as indicated (n = 10 per group). Mice treated with RT alone served as controls. B Average tumor volume curve comparing effects of different plasmids on local tumor growth. C Dot plot showing the effects of different plasmids on tumor volume 28 DPI. D Kaplan-Meier curves showing therapeutic effects of different plasmids on overall survival in MOC2 WT implanted C57BL/6 mice. E Western blots showing protein expression of EphB4, phospho-EphB4 (pEphB4), ephrinB2 (EFNB2), phospho-ephrinB2 (pEFNB2), and beta-actin in control and experimental tumors. F Dot plots showing ratios of protein expression of pEphB4/EphB4 (n = 6 per group) and pEFNB2/EFNB2 (n = 8 per group) in control and experimental tumors. Protein bands were quantified using Image lab and ImageJ software. The experiments were performed once with their own biological replicates. For the Kaplan-Meier overall survival curves, significance was determined by a log-rank Mantel-Cox test. Comparison of tumor volume between the control and experimental groups was done using a Dunnett post hoc test after one-way ANOVA was performed. Comparison of relative protein expression between the control and experimental groups was done using Mann Whitney tests. Significance was determined if the p-value was < 0.05*, < 0.01**, < 0.001***, and < 0.0001****. p-values are indicated for the figures (C) RT vs EphrinB2-Fc ***p = 0.0002; RT vs EFNB2-Fc-His ****p < 0.0001; RT vs Fc-TNYL-RAW-GS **p = 0.0044, (D) *p = 0.0389. The error bars represent the standard error of the mean ( ± SEM).

Update of

References

    1. Sun Z, Sun X, Chen Z, Du J, Wu Y. Head and Neck Squamous Cell Carcinoma: Risk Factors, Molecular Alterations, Immunology and Peptide Vaccines. Int J Pept Res Ther. 2022;28:19. 10.1007/s10989-021-10334-5 - PMC - PubMed
    1. Duprez F, Berwouts D, De Neve W, Bonte K, Boterberg T, Deron P, et al. Distant metastases in head and neck cancer. Head Neck. 2017;39:1733–43. 10.1002/hed.24687 - PubMed
    1. Fuereder T. Essential news of current guidelines: head and neck squamous cell carcinoma. memo - Mag Eur Med Oncol. 2022;15:278–81. 10.1007/s12254-022-00842-5
    1. Pisani P, Airoldi M, Allais A, Aluffi Valletti P, Battista M, Benazzo M, et al. Metastatic disease in head & neck oncology. Acta Otorhinolaryngol Ital. 2020;40:S1–s86. 10.14639/0392-100X-Supplementary1-40-2020 - PMC - PubMed
    1. Fares J, Fares MY, Khachfe HH, Salhab HA, Fares Y. Molecular principles of metastasis: a hallmark of cancer revisited. Signal Transduct Target Ther. 2020;5:28. 10.1038/s41392-020-0134-x - PMC - PubMed

MeSH terms