

Multimodal AI/ML for discovering novel biomarkers and predicting disease using multi-omics profiles of patients with cardiovascular diseases
- PMID: 39489837
- PMCID: PMC11532369
- DOI: 10.1038/s41598-024-78553-6
Multimodal AI/ML for discovering novel biomarkers and predicting disease using multi-omics profiles of patients with cardiovascular diseases
Erratum in
-
Publisher Correction: Multimodal AI/ML for discovering novel biomarkers and predicting disease using multi-omics profiles of patients with cardiovascular diseases.Sci Rep. 2025 Jun 3;15(1):19417. doi: 10.1038/s41598-025-03203-4. Sci Rep. 2025. PMID: 40461550 Free PMC article. No abstract available.
Abstract
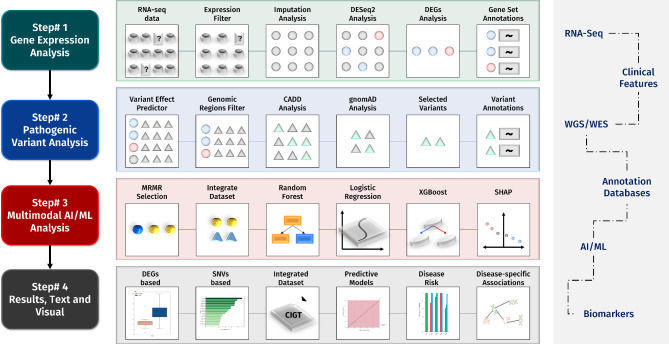
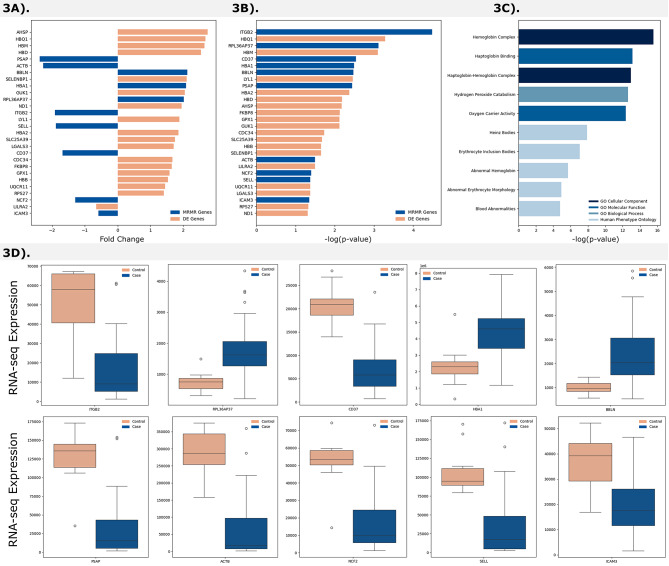
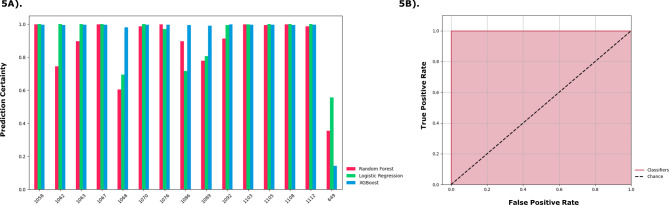
Cardiovascular diseases (CVDs) are complex, multifactorial conditions that require personalized assessment and treatment. Advancements in multi-omics technologies, namely RNA sequencing and whole-genome sequencing, have provided translational researchers with a comprehensive view of the human genome. The efficient synthesis and analysis of this data through integrated approach that characterizes genetic variants alongside expression patterns linked to emerging phenotypes, can reveal novel biomarkers and enable the segmentation of patient populations based on personalized risk factors. In this study, we present a cutting-edge methodology rooted in the integration of traditional bioinformatics, classical statistics, and multimodal machine learning techniques. Our approach has the potential to uncover the intricate mechanisms underlying CVD, enabling patient-specific risk and response profiling. We sourced transcriptomic expression data and single nucleotide polymorphisms (SNPs) from both CVD patients and healthy controls. By integrating these multi-omics datasets with clinical demographic information, we generated patient-specific profiles. Utilizing a robust feature selection approach, we identified a signature of 27 transcriptomic features and SNPs that are effective predictors of CVD. Differential expression analysis, combined with minimum redundancy maximum relevance feature selection, highlighted biomarkers that explain the disease phenotype. This approach prioritizes both biological relevance and efficiency in machine learning. We employed Combination Annotation Dependent Depletion scores and allele frequencies to identify variants with pathogenic characteristics in CVD patients. Classification models trained on this signature demonstrated high-accuracy predictions for CVD. The best performing of these models was an XGBoost classifier optimized via Bayesian hyperparameter tuning, which was able to correctly classify all patients in our test dataset. Using SHapley Additive exPlanations, we created risk assessments for patients, offering further contextualization of these predictions in a clinical setting. Across the cohort, RPL36AP37 and HBA1 were scored as the most important biomarkers for predicting CVDs. A comprehensive literature review revealed that a substantial portion of the diagnostic biomarkers identified have previously been associated with CVD. The framework we propose in this study is unbiased and generalizable to other diseases and disorders.
Keywords: Artificial Intelligence; Cardiovascular diseases; Genomics; Machine learning; Multi-omics.
© 2024. The Author(s).
Conflict of interest statement
The authors declare no competing interests.
Figures


References
MeSH terms
Substances
LinkOut - more resources
Full Text Sources
Miscellaneous
