. 2024 Nov 3;14(1):26522.
doi: 10.1038/s41598-024-78336-z.

Intestinal epithelial Gasdermin C is induced by IL-4R/STAT6 signaling but is dispensable for gut immune homeostasis

Affiliations

Intestinal epithelial Gasdermin C is induced by IL-4R/STAT6 signaling but is dispensable for gut immune homeostasis

Reyes Gámez-Belmonte et al. Sci Rep. .

Abstract

Gasdermin C is one of the least studied members of the gasdermin family of proteins, known for their critical involvement in pyroptosis and host defense. Furthermore, evidence for the role of Gasdermin C in the intestine is scarce and partly controversial. Here, we tested the functional role of Gasdermin C in intestinal homeostasis, inflammation and tumorigenesis. : We studied Gasdermin C in response to cytokines in intestinal organoids. We evaluated epithelial differentiation, cell death and immune infiltration under steady state conditions in a new mouse line deficient in Gasdermin C. The role of Gasdermin C was analyzed in acute colitis, infection and colitis-associated cancer. Gasdemin C is highly expressed in the intestinal epithelium and strongly induced by the type 2 cytokines IL-4 and IL-13 in a STAT6-dependent manner. Gasdermin C-deficient mice show no changes in tissue architecture and epithelial homeostasis. Epithelial organoids deficient in Gasdermin C develop normally and show no alterations in proliferation or cell death. No changes were found in models of acute colitis, type 2 intestinal infection and colitis-associated cancer. Gasdermin C genes are upregulated by type 2 immunity, yet appear dispensable for the development of intestinal inflammation, infection and colitis-associated cancer.

Keywords: Gasdermin; Gut pathology; Intestinal homeostasis.


Conflict of interest statement

The authors declare no competing interests.

Figures

Fig. 1
Fig. 1
Gsmdc1-4 is highly expressed in gut tissue. (A) Relative mRNA levels of Gsdmc1, Gsdmc2, Gsdmc3 and Gsdmc4 along the gastrointestinal tract, liver, lung and kidney. (SI, small intestine; C, colon; 1–4 indicates proximal to distal). (B) Comparative expression of Gsdmc1, Gsdmc2, Gsdmc3 and Gsdmc4 along the gastrointestinal tract (SI, small intestine; C, colon). (C-D) Photomicrograph and insets of ileum and colon tissues stained for GSDMC4 (red). Counterstaining with Hoechst (blue). Scale bar 258.1 μm and 37.4 μm (HPV) (E) Representative images of GSDMC4-stained (red) gut tissues and (F) quantification. Counterstaining with Hoechst (blue). Scale bar 427.2 μm. (G) Spider plot representing changes in Gsdmc2, Gsdmc3 and Gsdmc4 expression in TNBS and Oxazolone (Oxa) inflammation models and in infection with Helicobacter hepaticus (H. hepa), Eimeria vermiformis (E.vermi) and Citrobacter rodentium (C.rode). *, and ** indicate the p < 0.05, < 0.01 respectively from One-Way ANOVA.
Fig. 2
Fig. 2
Gsdmc1-4  is upregulated in vivo and in vitro in response to Th2 cytokines. (A) Expression levels of Gsdmc1-4 in freshly isolated IECs and in intestinal organoids. (B) Gsdmc1, Gsdmc2, Gsdmc3 and Gsdmc4 counts in intestinal organoids stimulated with 50 ng/ml of the indicated cytokines for 24 h. Level of GSDMC2 + 3 proteins in intestinal organoids stimulated with IL-4 (50 ng/ml, 24 h) (C) and IL-13 (D) (50 ng/ml, 24 h) (Western blot image represents cropped gel where irrelevant samples and lanes were removed for clarity. Original blots/gels are presented in Supplementary Fig. 4A-B). β-actin was used as a loading control. (E) Relative transcript levels of Gsdmc1, Gsdmc2, Gsdmc3, Gsdmc4 and Il13 in colon tissue from mock and mc-IL13 injected mice. (F) Photomicrographs and insets of mock and mc-IL13 injected mice stained for GSDMC4 (white) in colon tissue. Counterstaining with Hoechst (blue). Scale bar 100 μm and 50 μm (inset). (G) Heat map depicting Gsdmc1, Gsdmc2, Gsdmc3 and Gsdmc4 expression in Stat6 proficient and deficient small intestinal organoids in response to IL-13 and IL-4 (50 ng/ml, 24 h). (H) Scheme of the modulation of Gsdmc1-4 genes in response to type 2 cytokines. *, ** and *** indicate the p < 0.05, < 0.01 and < 0.001, respectively from Student’s t-test or Two-Way ANOVA.
Fig. 3
Fig. 3
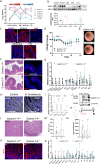
Gsmdc1-4/−mice show no detectable alteration in steady state conditions. (A) GSDMC2 + 3 protein levels in the colon (top) and relative mRNA levels (bottom) of Gsdmc1, Gsdmc2, Gsdmc3, Gsdmc4 in the small intestine and colon of Gsdmc1-4+/+ and Gsdmc1-4−/− mice. β-actin was used as a loading control. Original blots/gels are presented in Supplementary Fig. 4C. (B) Representative images of GSDMC4-stained (red) ileum and colon from Gsdmc1-4+/+ and Gsdmc1-4−/− mice. Counterstaining with Hoechst (blue). Scale bar 213.6 μm. (C) Intestinal organoids from Gsdmc1-4+/+ and Gsdmc1-4−/− mice were treated with IL-13 (50 ng/ml) for 24 h and then stained with PI. Scale bar 100 μm. (D) Buds per organoid counted in small intestinal organoids isolated from Gsdmc1-4+/+ and Gsdmc1-4−/− mice and stimulated with IL-13 (50 ng/ml, 24 h). (E) Examples of hematoxylin and eosin (H&E)-stained ileum and colon sections from Gsdmc1-4+/+ and Gsdmc1-4−/− mice. Scale bar 100 μm. (F-I) Photomicrographs of ileum and colon sections from Gsdmc1-4+/+ and Gsdmc1-4−/− mice stained for Lgr5 RNA (F, scale bar 106 μm), OLFM4 and E-cadherin (G, scale bar 106 μm), KI67 and E-cadherin (H, 213.6 μm), or cleaved Caspase 3 and TUNEL assay (I, scale bar 100 μm) along the corresponding quantification. Counterstaining with Hoechst (blue). n = 5–6. ** and *** indicate the p < 0.001 and < 0.0001, respectively from Student’s t-test.
Fig. 4
Fig. 4
Gsdmc1-4 deletion does not affect resolution of inflammation in DSS colitis or worm expulsion after infection with Nippostrongylus brasiliensis. (A) Expression of Gsdmc1, Gsdmc2, Gsdmc3, Gsdmc4 and S100a8 during the different stages of colitis (publicly available, E-MTAB-9850. (B) Protein and mRNA levels of GSDMC1-4 during the course of DSS-induced colitis. β-actin was used as a loading control. Original blots/gels are presented in Supplementary Fig. 4D. (C) Representative immunofluorescence images of GSDMC4 (red) in different stages of colitis. Counterstaining with Hoechst (blue). Scale bar 100 μm. (D) Relative percent change in body weight and (E) representative colonoscopy images of Gsdmc1-4+/+ and Gsdmc1-4−/− mice subjected to DSS. (F) Representative images of H&E and KI67-stained colon sections at the end of the experiment. Counterstaining with Hoechst (blue). Scale bar 250 and 427 μm. (G) Relative mRNA levels of the indicated genes in colon samples from Gsdmc1-4+/+ and Gsdmc1-4−/− mice at the end of the experiment (n = 4 per group). The DSS experiment shown is representative of three independent replicates. (H) Representative images of GSDMC4-stained (white) duodenum sections from N. brasiliensis infected and control mice (n = 3 per group). Counterstaining with Hoechst (blue). Scale bar 213.6 μm. (I) Relative expression levels of Gsdmc1, Gsdmc2, Gsdmc3 and Gsdmc4 in duodenum samples from control and N. brasiliensis-infected mice (n = 4 per group). (J) GSDMC2 + 3 protein levels in duodenum from control and N. brasiliensis-infected animals. β-actin was used as a loading control (Western blot image represents cropped gel where irrelevant samples and lanes were removed for clarity. Original blots/gels are presented in Supplementary Fig. 4E). (K) Scheme showing the experimental protocol for the infection with N. brasiliensis. (L) Representative H&E staining of duodenal sections (scale bar 250 μm) from Gsdmc1-4+/+ and Gsdmc1-4−/− mice infected with N. brasiliensis. Worm (M) and egg (N) counts measured in tissue and feces, respectively, from N. brasiliensis-infected Gsdmc1-4+/+ and Gsdmc1-4−/− mice (Gsdmc1-4+/+n = 7 and Gsdmc1-4−/−n = 5). (O) Photomicrograph of duodenal sections stained for MUC2 (red) from Gsdmc1-4 proficient and deficient mice infected with N. brasiliensis. Counterstaining with Hoechst (blue). Scale bar 100 μm. (P) Relative mRNA levels of indicated genes in duodenum samples from N. brasiliensis-infected Gsdmc1-4+/+ and Gsdmc1-4−/− mice (Gsdmc1-4+/+n = 3 and Gsdmc1-4−/−n = 4). The N. brasiliensis infection experiment displayed is representative of three independent experiments *, indicates the p < 0.05, ns = not significant from Student’s t-test.

References

    1. Yu, P. et al. Pyroptosis: mechanisms and diseases. Signal. Transduct. Target. Ther.6, 128. 10.1038/s41392-021-00507-5 (2021). - PMC - PubMed
    1. Zahid, A., Ismail, H. & Jin, T. Molecular and structural aspects of gasdermin family pores and insights into gasdermin-elicited programmed cell death. Biochem. Soc. Trans.49, 2697–2710. 10.1042/BST20210672 (2021). - PMC - PubMed
    1. Gao, H. et al. Dysregulated microbiota-driven gasdermin D activation promotes Colitis Development by mediating IL-18 release. Front. Immunol.12, 750841. 10.3389/fimmu.2021.750841 (2021). - PMC - PubMed
    1. Ma, C. et al. Gasdermin D in macrophages restrains colitis by controlling cGAS-mediated inflammation. Sci. Adv.6, eaaz6717. 10.1126/sciadv.aaz6717 (2020). - PMC - PubMed
    1. Tan, G., Huang, C., Chen, J., Chen, B. & Zhi, F. Gasdermin-E-mediated pyroptosis participates in the pathogenesis of Crohn’s disease by promoting intestinal inflammation. Cell. Rep.35, 109265. 10.1016/j.celrep.2021.109265 (2021). - PubMed

MeSH terms

LinkOut - more resources