

Serotype-specific epidemiological patterns of inapparent versus symptomatic primary dengue virus infections: a 17-year cohort study in Nicaragua
- PMID: 39489898
- PMCID: PMC11864988
- DOI: 10.1016/S1473-3099(24)00566-8
Serotype-specific epidemiological patterns of inapparent versus symptomatic primary dengue virus infections: a 17-year cohort study in Nicaragua
Abstract
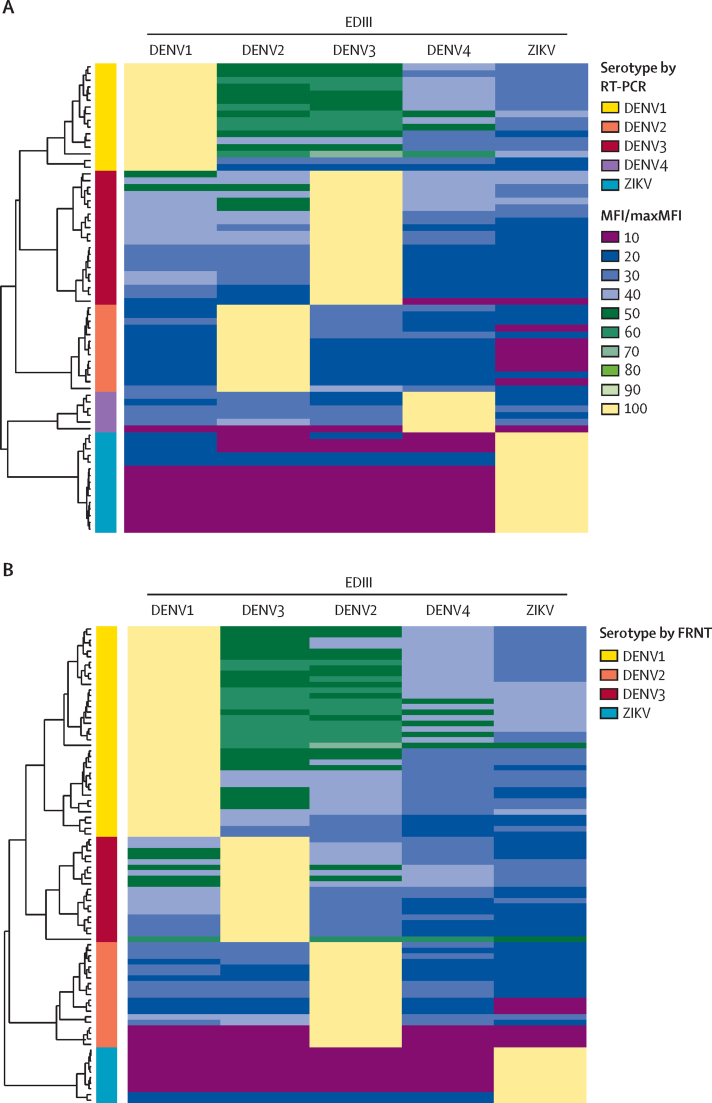
Background: Dengue is the most prevalent mosquito-borne viral disease and a major public health problem worldwide. Most primary infections with the four dengue virus serotypes (DENV1-4) are inapparent; nonetheless, whether the distribution of symptomatic versus inapparent infections by serotype varies remains unknown. Here, we present (1) the evaluation of a DENV1-4 envelope domain III multiplex microsphere-based assay (EDIII-MMBA) to serotype inapparent primary infections and (2) its application leveraging 17 years of prospective sample collection from the Nicaraguan Pediatric Dengue Cohort Study (PDCS).
Methods: We analysed primary DENV infections in the PDCS from 2004 to 2022 detected by inhibition ELISA (iELISA) or RT-PCR. First, we evaluated the performance of the EDIII-MMBA for serotyping with samples characterised by RT-PCR or focus reduction neutralisation test. Next, we analysed a subset of inapparent primary DENV infections in the PDCS with the EDIII-MMBA to evaluate the epidemiology of inapparent infections. Remaining infections were inferred using stochastic imputation, taking year and neighbourhood into account. Infection incidence and percentage of inapparent, symptomatic, and severe infections were analysed by serotype.
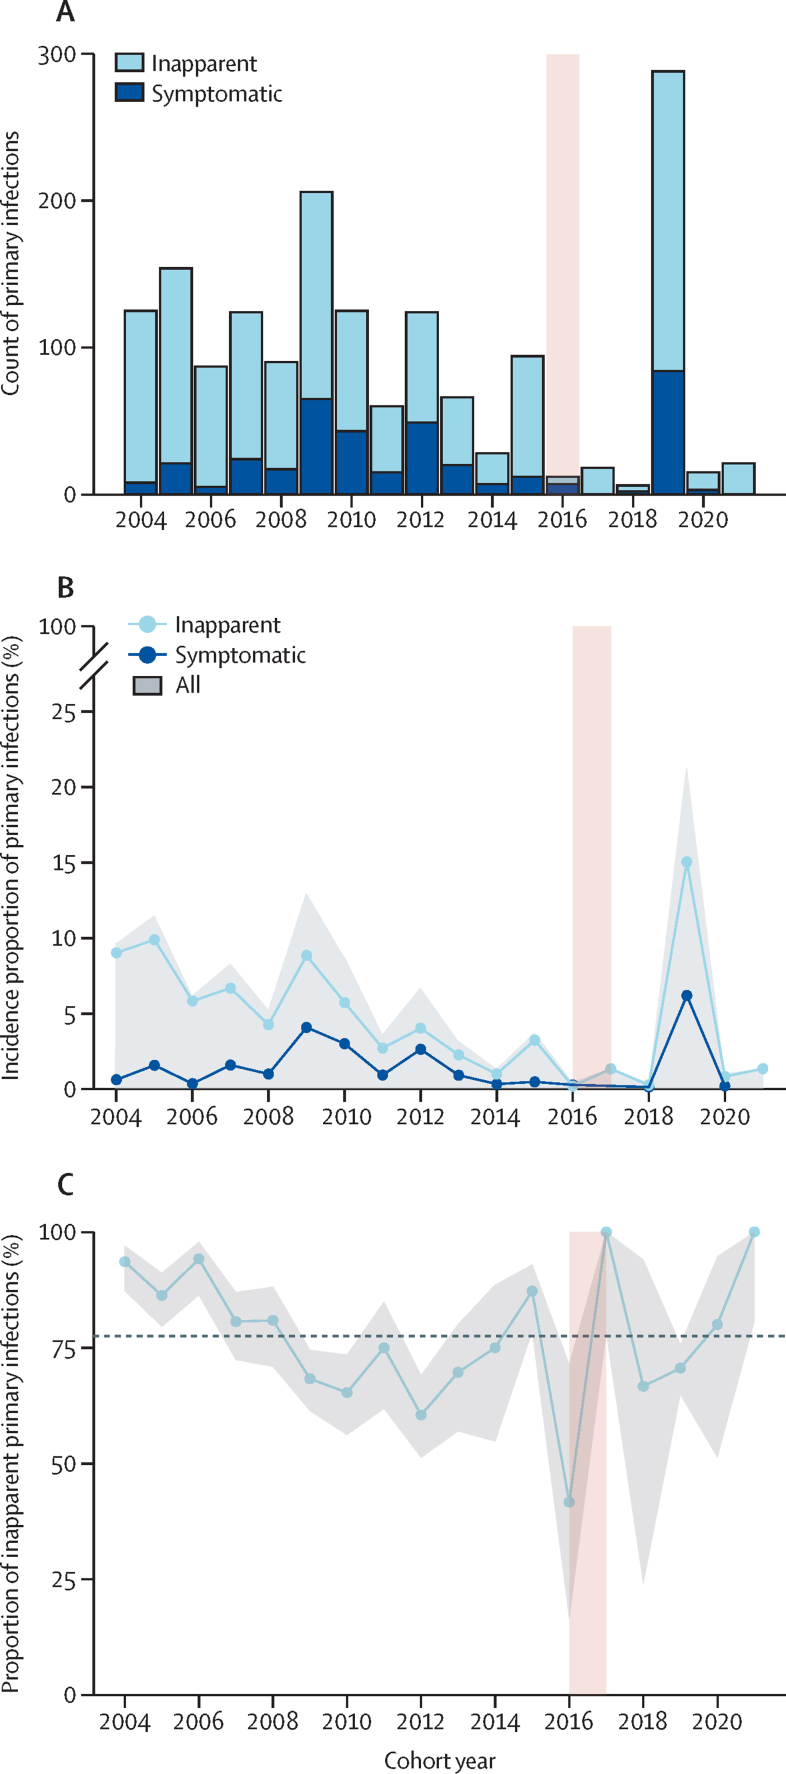
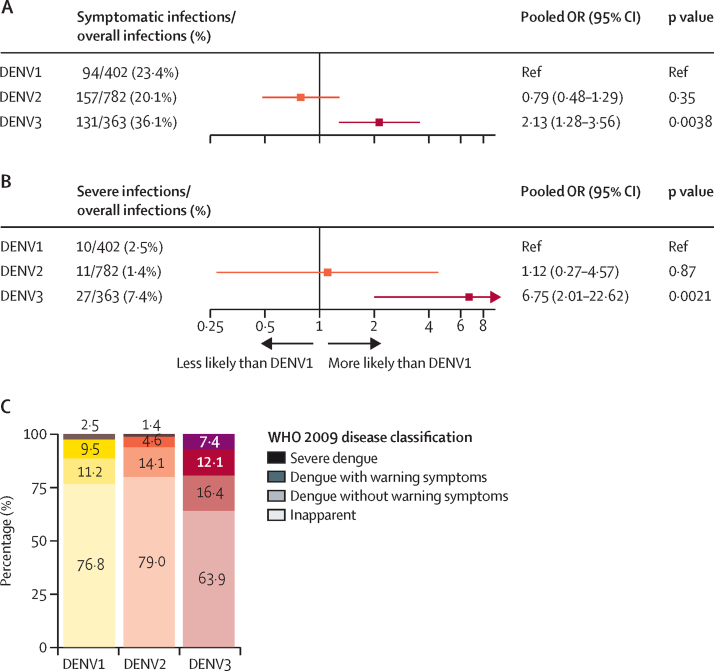
Findings: Between Aug 30, 2004, and March 10, 2022, a total of 5931 DENV-naive participants were followed in the PDCS. There were 1626 primary infections (382 symptomatic, 1244 inapparent) detected by iELISA or RT-PCR over the study period. The EDIII-MMBA demonstrated excellent overall accuracy (100%, 95% CI 95·8-100) for serotyping inapparent primary DENV infections when evaluated against gold-standard serotyping methods. Of the 1244 inapparent infections, we analysed 574 (46%) using the EDIII-MMBA. We found that the majority of primary infections were inapparent, with DENV3 exhibiting the highest likelihood of symptomatic (pooled odds ratio compared with DENV1: 2·13, 95% CI 1·28-3·56) and severe (6·75, 2·01-22·62) primary infections, whereas DENV2 was similar to DENV1 in both analyses. Considerable within-year and between-year variation in serotype distribution between symptomatic and inapparent infections and circulation of serotypes undetected in symptomatic cases were observed in multiple years.
Interpretation: Our study indicates that case surveillance skews the perceived epidemiological footprint of DENV. We reveal a more complex and intricate pattern of serotype distribution in inapparent infections. The substantial differences in infection outcomes by serotype emphasises the need for vaccines with balanced immunogenicity and efficacy across serotypes.
Funding: National Institute of Allergy and Infectious Diseases (National Institutes of Health) and Bill & Melinda Gates Foundation.
Translation: For the Spanish translation of the abstract see Supplementary Materials section.
Copyright © 2025 The Author(s). Published by Elsevier Ltd. This is an Open Access article under the CC BY 4.0 license. Published by Elsevier Ltd.. All rights reserved.
Conflict of interest statement
Declaration of interests AG has received institutional payments from Flu Lab and Open Philanthropy, personal honoraria from Hope College and La Jolla Institute of Immunology, payments for expert testimony from Berman and Simmons, and travel support from the Gates Foundation and National Institutes of Health (NIH), and has an advisory role with Janssen Pharmaceuticals. All other authors declare no competing interests.
Figures


Update of
-
Serotype-Specific Epidemiological Patterns of Inapparent versus Symptomatic Primary Dengue Virus Infections: A 17-year cohort study in Nicaragua.medRxiv [Preprint]. 2024 Jun 29:2024.04.05.24305281. doi: 10.1101/2024.04.05.24305281. medRxiv. 2024. Update in: Lancet Infect Dis. 2025 Mar;25(3):346-356. doi: 10.1016/S1473-3099(24)00566-8. PMID: 38633800 Free PMC article. Updated. Preprint.
References
-
- Yang X, Quam MBM, Zhang T, Sang S. Global burden for dengue and the evolving pattern in the past 30 years. J Travel Med. 2021;28 - PubMed
-
- Sabchareon A, Wallace D, Sirivichayakul C, et al. Protective efficacy of the recombinant, live-attenuated, CYD tetravalent dengue vaccine in Thai schoolchildren: a randomised, controlled phase 2b trial. Lancet. 2012;380:1559–1567. - PubMed
