. 2024 Dec 4;32(12):4285-4302.
doi: 10.1016/j.ymthe.2024.10.023. Epub 2024 Oct 28.

Reversion of metabolic dysfunction-associated steatohepatitis by skeletal muscle-directed FGF21 gene therapy

Affiliations

Reversion of metabolic dysfunction-associated steatohepatitis by skeletal muscle-directed FGF21 gene therapy

Veronica Jimenez et al. Mol Ther. .

Abstract

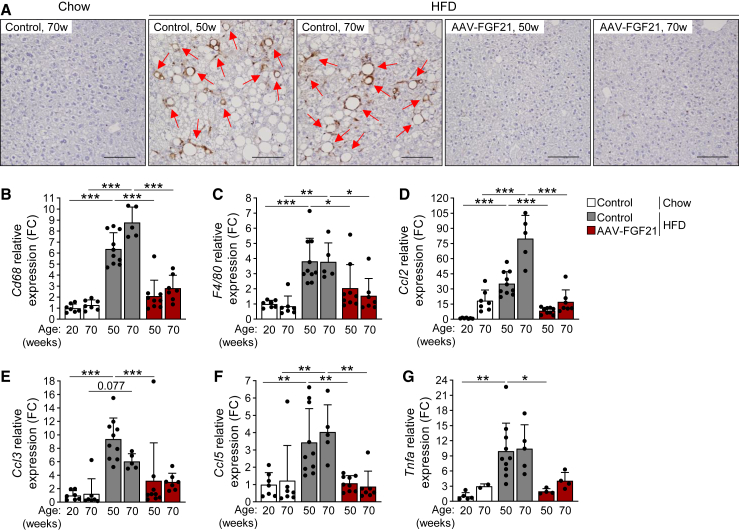
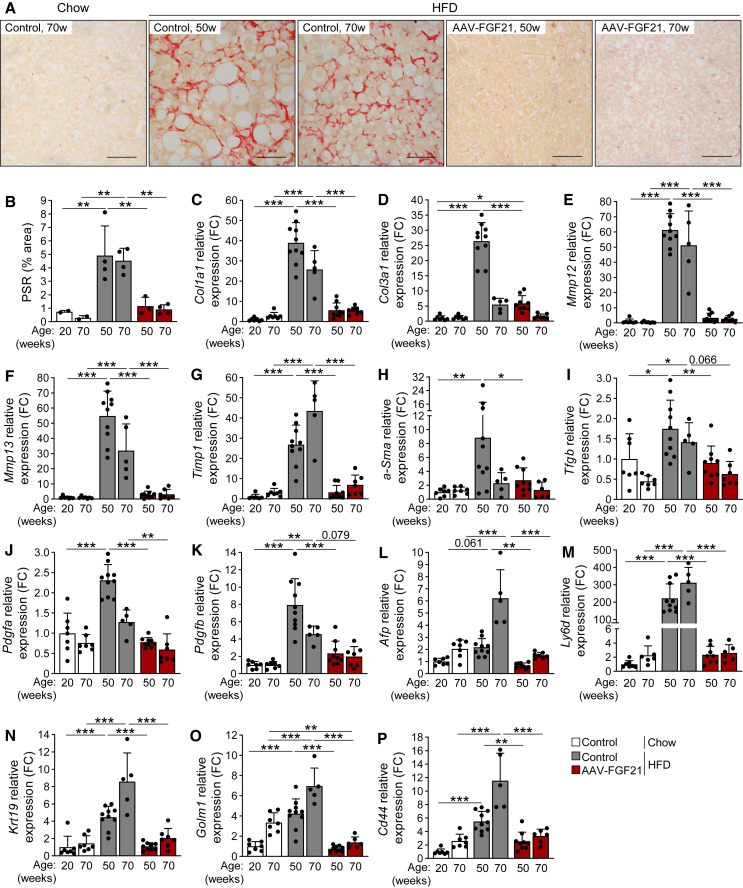
The highly prevalent metabolic dysfunction-associated steatohepatitis (MASH) is associated with liver steatosis, inflammation, and hepatocyte injury, which can lead to fibrosis and may progress to hepatocellular carcinoma and death. New treatment modalities such as gene therapy may be transformative for MASH patients. Here, we describe that one-time intramuscular administration of adeno-associated viral vectors of serotype 1 (AAV1) encoding native fibroblast growth factor 21 (FGF21), a key metabolic regulator, resulted in sustained increased circulating levels of the factor, which mediated long-term (>1 year) MASH and hepatic fibrosis reversion and halted development of liver tumors in obese male and female mouse models. AAV1-FGF21 treatment also counteracted obesity, adiposity, and insulin resistance, which are significant drivers of MASH. Scale-up to large animals successfully resulted in safe skeletal muscle biodistribution and biological activity in key metabolic tissues. Moreover, as a step toward the clinic, circulating FGF21 levels were characterized in obese, insulin-resistant and MASH patients. Overall, these results underscore the potential of the muscle-directed AAV1-FGF21 gene therapy to treat MASH and support its clinical translation.

Keywords: adeno-associated viral vectors; fibroblast growth factor 21; gene therapy; insulin resistance; metabolic dysfunction-associated steatohepatitis; metabolic dysfunction-associated steatotic liver disease; obesity; type 2 diabetes.


Conflict of interest statement

Declaration of interests V.J., V. Sacristan, C.J., I.E., I.G., A.R., and F.B. are co-inventors on patent applications for the use of AAV vectors for the treatment of metabolic diseases. F.B. is member of the scientific advisory board of Kriya Therapeutics.

Figures

None
Graphical abstract
Figure 1
Figure 1
AAV-mediated skeletal muscle gene transfer of FGF21 reverses hepatic steatosis Eight-week-old male mice were fed an HFD. Twenty weeks later, mice were treated intramuscularly with AAV-FGF21 vectors and remained in HFD feeding for all experimental periods. Non-injected chow and HFD-fed mice were used as controls. (A) Body weight follow-up (n = 9–10/group). (B) Body weight gain in HFD-fed groups from weeks 28–70 of age (n = 5–10/group). (C) Serum FGF21 levels at different time points (n = 5–11/group). (D) Quantitative PCR analysis of murine optimized Fgf21 (moFgf21) expression in the three injected skeletal muscles and in the liver in 70-week-old male mice (n = 5–7/group). (E) Hepatic expression of Klb (n = 5–10/group). (F) Representative macroscopic images of the liver from control HFD-fed (left) and AAV-FGF21-treated (right) male mice at age 50 weeks. (G) Representative images of hematoxylin and eosin staining of liver sections at age 50 and 70 weeks. Scale bars, 100 μm. (H) Liver weight at different time points (n = 5–11/group). (I and J) Liver triglyceride (I) and cholesterol (J) content (n = 5–11/group). (K and L) Serum ALT (K) and aspartate aminotransferase (AST) levels (L) (n = 5–9/group). Data are presented as mean ± SD; ∗∗p < 0.01, ∗∗∗p < 0.001 by one-way analysis of variance (ANOVA) with Bonferroni multiple comparison test. AU, arbitrary units; ND, non-detected; FC, fold change; w, weeks; ꝉ, death due to natural causes.
Figure 2
Figure 2
Treatment with AAV-FGF21 vectors reverts hepatic inflammation (A) Representative images of liver sections immunostained against the macrophage marker MAC2. Red arrows indicate MAC2+ cells. Scale bars, 100 μm. (B–G) Expression levels of the hepatic inflammatory markers Cd68 (B), F4/80 (C), Ccl2 (D), Ccl3 (E), Ccl5 (F), and Tnfa (G) (n = 5–10/group). Data are presented as mean ± SD. ∗p < 0.05, ∗∗p < 0.01, ∗∗∗p < 0.001 by one-way analysis of variance (ANOVA) with Bonferroni multiple comparison test. FC, fold change; w, weeks.
Figure 3
Figure 3
Muscle-derived FGF21 counteracts hepatic fibrosis and halts development of liver tumors (A) Representative images of Picrosirius red (PSR) staining of liver sections showing liver fibrosis in red. Scale bars, 50 μm. (B) Histomorphometric quantitative assessment of liver fibrosis (PSR) (n = 2–4/group). (C and D) Expression levels of the liver fibrosis markers Col1a1 (C) and Col3a1 (D) (n = 5–10/group). (E–G) Expression levels of the genes involved in extracellular matrix deposition Mmp12 (E), Mmp13 (F), and Timp1 (G) (n = 5–10/group). (H–K) Expression levels of the marker of activated hepatic stellate cells (HSCs) a-Sma (H) and key cytokines involved in HSCs activation Tfgb (I), Pdgfa (J), and Pdgfb (K) (n = 5–10/group). (L–P) Expression levels of the hepato-cellular carcinoma markers Afp (L), Ly6d (M), Krt19 (N), Golm1 (O), and Cd44 (P), in non-tumoral liver parenchyma (n = 5–10/group). Data are presented as mean ± SD. ∗p < 0.05, ∗∗p < 0.01, ∗∗∗p < 0.001 by one-way analysis of variance (ANOVA) with Bonferroni multiple comparison test. FC, fold change; w, weeks.
Figure 4
Figure 4
Reversal of WAT hypertrophy and inflammation by AAV1-FGF21 treatment (A) Immunohistochemical analysis of MAC2 in eWAT sections. Red arrows indicate crown-like structures. Scale bars, 100 μm. (B) Morphometric analysis of the mean adipocyte area in eWAT (n = 4/group). (C and D) Weight of eWAT (C) and iWAT (D) depots (n = 5–10/group). (E and F) Serum leptin (E) and adiponectin (F) levels (n = 5–10/group). (G–I) Expression levels of the inflammatory markers Cd68 (G), F4/80 (H), and Tnfa (I) in eWAT (n = 5–10/group). Data are presented as mean ± SD; ∗p < 0.05, ∗∗p < 0.01, ∗∗∗p < 0.001 by one-way analysis of variance (ANOVA) with Bonferroni multiple comparison test. FC, fold change; w, weeks.
Figure 5
Figure 5
AAV1-FGF21 treatment increases energy expenditure (A) Food intake of male mice fed an HFD and treated with AAV1-FGF21 (n = 2–3 cages/group). (B) Energy expenditure was measured with an indirect open circuit calorimeter at different time points, during light and dark cycles (n = 6–10/group). (C) Interscapsular BAT (iBAT) weight of AAV-FGF21-treated male mice at different ages (n = 5–10/group). (D) Representative images of hematoxylin and eosin staining of iBAT sections. Scale bars, 100 μm. (E–G) Quantification of the expression of the non-shivering thermogenesis markers Ucp1 (E), Cidea (F), and Elovl3 (G) in iBAT at age 70 weeks (n = 5–10/group). (H) Representative tracks during the open field test of male mice at age 8 and 70 weeks. (I–P) Assessment of locomotor activity (I–N) and anxiety parameters (O and P) through the open-field test (n = 5–15/group). Data are presented as mean ± SD. ∗p < 0.05, ∗∗p < 0.01, ∗∗∗p < 0.001 by one-way analysis of variance (ANOVA) with Tukey’s (A, E–G, I–P) or Bonferroni (B and C) multiple comparison test. FC, fold change; w, weeks.
Figure 6
Figure 6
AAV1-FGF21 improves insulin sensitivity (A) Fed and fasted serum insulin in male mice at age 70 and 38 weeks, respectively (n = 5–9/group). (B) Fed and fasted blood glucose in male mice at age 48 and 38 weeks, respectively (n = 8–10/group). (C) Insulin sensitivity was determined after an intraperitoneal insulin injection (0.75 units/kg) at age 59 weeks in male mice. Results were calculated as percentage of initial blood glucose levels (n = 9–10/group). (D) Representative images of insulin immunostaining in pancreas sections from AAV-FGF21-treated male mice. Scale bars, 500 μm. (E) Quantification of β cell mass in male mice at age 70 weeks (n = 5/group). (F) Fasted glucagon levels in male mice, 12 weeks post-AAV administration (n = 8–10/group). (G) Forelimb grip strength in female mice (n = 6–9/group). (H) Time before falling during the rotarod test performed in female mice (n = 6–9/group). (I and J) Discrimination index (I) and exploration time (J) during novel object recognition (NOR) test performed in female mice (n = 6/group). Data are presented as mean ± SD. ∗p < 0.05, ∗∗p < 0.01, ∗∗∗p < 0.001 by one-way analysis of variance (ANOVA) with Tukey’s multiple comparison test (A, B and E–I) or Student’s two-tailed t test (J). In (C), #p < 0.05, ##p < 0.01, ###p < 0.001 versus chow-fed control group and $$p < 0.01, $$$p < 0.001 versus HFD-fed control group by one-way analysis of variance (ANOVA) with Tukey’s multiple comparison test. BW, body weight; N, Newtons.
Figure 7
Figure 7
AAV1-FGF21 biodistribution and biological activity in dogs Healthy Beagle dogs (dog-1 and dog-2) were treated with 7 × 1012 vg/kg of AAV1-canine optimized FGF21 and followed up for 4 months. (A) Vector genome copy number (left panel, blue) and canine optimize FGF21 (coFGF21) expression (right panel, orange) were analyzed in tissue punches from multiple regions of the skeletal muscle and the liver obtained during necropsy of dogs. (B) Schematic representation indicating the mean coFGF21 expression in hindlimb skeletal muscles. Image courtesy of IMAIOS️ (Micheau A, Hoa D, e-Anatomy, www.imaios.com, https://doi.org/10.37019/e-anatomy). (C) Levels of biologically active FGF21 in fasted conditions measured using a cell-based reporter gene assay (iLite). (D) Hepatic expression levels of KLB (n = 2–3/group). (E) Serum triglyceride levels pre-AAV and 4 months post-AAV (n = 1–3). (F and G) Hepatic expression levels of ACADM (F) and ACADL (G) (n = 2–3/group). (H) Serum adiponectin levels pre-AAV and 4 months post-AAV (n = 1–3). (I–L) Quantification of ADIPOQ (I), UCP1 (J), ELOVL3 (K), and PPARGC1A (L) expression in perirenal (prWAT) and gluteal WAT (gWAT) (n = 2–3/group). (M) Representative images of the hematoxylin and eosin staining of prWAT sections. Insets show multilocular adipocytes in prWAT of AAV-FGF21-treated dogs. Scale bars, 100 μm. Inset scale bars, 25 μm. Data are presented as mean ± SD. Data were analyzed using a Mann-Whitney two-tailed test. coFGF21, canine optimized FGF21; ND, non-detected; vg/dg, vector genomes/diploid genome; AU, arbitrary units; FC, fold change; G, gluteus; T, tensor; Q, quadriceps; V, vastus; LLL, left lateral lobe; LML, left medial lobe; RML, right medial lobe.
Figure 8
Figure 8
FGF21 circulating levels in human patients (A and B) Serum FGF21 levels were measured in a cohort of 46 lean and 12 overweight individuals and in a cohort of approximately 500 highly obese and insulin-resistant patients, grouped by body mass index (BMI) (A) and in a cohort of 20 biopsy-proven MASH patients and grouped by fibrosis stage (B). Gray bar indicates FGF21 circulating levels corresponding to 90% of healthy individuals (0–0.26 ng/mL). The 2-fold limit of the normal range displayed by lean individuals (0.53 ng/mL) is indicated with the dashed line. n, number of individuals.

References

    1. Dufour J.-F., Scherer R., Balp M.-M., McKenna S.J., Janssens N., Lopez P., Pedrosa M. The global epidemiology of nonalcoholic steatohepatitis (NASH) and associated risk factors–A targeted literature review. Endocr. Metab. Sci. 2021;3
    1. Rinella M.E., Lazarus J.V., Ratziu V., Francque S.M., Sanyal A.J., Kanwal F., Romero D., Abdelmalek M.F., Anstee Q.M., Arab J.P., et al. A multisociety Delphi consensus statement on new fatty liver disease nomenclature. J. Hepatol. 2023;79:1542–1556. - PubMed
    1. Filipovic B., Lukic S., Mijac D., Marjanovic-Haljilji M., Vojnovic M., Bogdanovic J., Glisic T., Filipovic N., Al Kiswani J., Djokovic A., et al. The New Therapeutic Approaches in the Treatment of Non-Alcoholic Fatty Liver Disease. Int. J. Mol. Sci. 2021;22:13219. - PMC - PubMed
    1. Hagström H., Nasr P., Ekstedt M., Hammar U., Stål P., Hultcrantz R., Kechagias S. Fibrosis stage but not NASH predicts mortality and time to development of severe liver disease in biopsy-proven NAFLD. J. Hepatol. 2017;67:1265–1273. - PubMed
    1. Jarvis H., Craig D., Barker R., Spiers G., Stow D., Anstee Q.M., Hanratty B. Metabolic risk factors and incident advanced liver disease in non-alcoholic fatty liver disease (NAFLD): A systematic review and meta-analysis of population-based observational studies. PLoS Med. 2020;17 - PMC - PubMed

MeSH terms

Substances

LinkOut - more resources