. 2024 Nov 4;43(1):295.
doi: 10.1186/s13046-024-03214-5.

Notch1 blockade by a novel, selective anti-Notch1 neutralizing antibody improves immunotherapy efficacy in melanoma by promoting an inflamed TME

Affiliations

Notch1 blockade by a novel, selective anti-Notch1 neutralizing antibody improves immunotherapy efficacy in melanoma by promoting an inflamed TME

Juliano Tiburcio de Freitas et al. J Exp Clin Cancer Res. .

Abstract

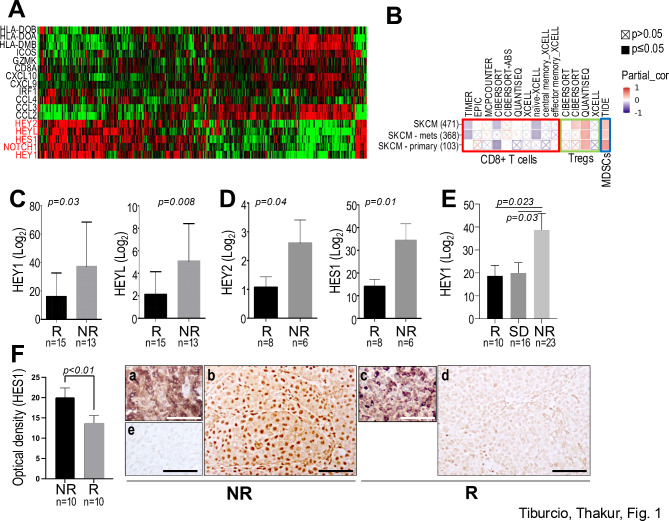
Background: Immune checkpoint inhibitors (ICI) have dramatically improved the life expectancy of patients with metastatic melanoma. However, about half of the patient population still present resistance to these treatments. We have previously shown Notch1 contributes to a non-inflamed TME in melanoma that reduces the response to ICI. Here, we addressed the therapeutic effects of a novel anti-Notch1 neutralizing antibody we produced, alone and in combination with immune checkpoint inhibition in melanoma models.

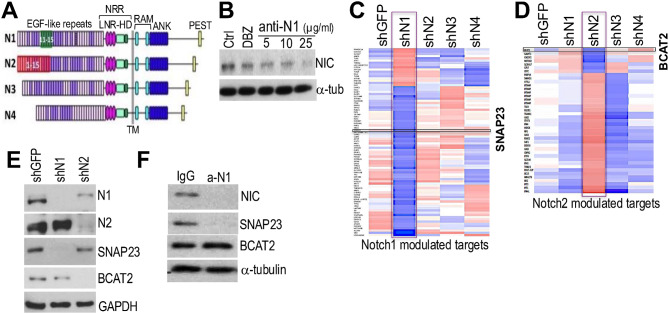
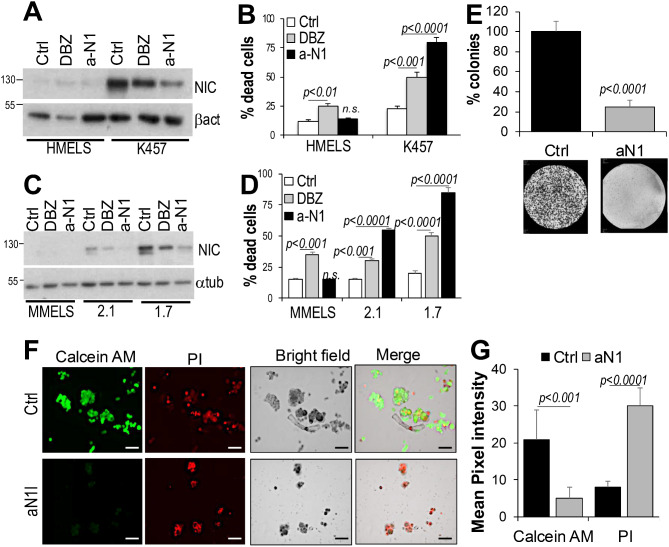
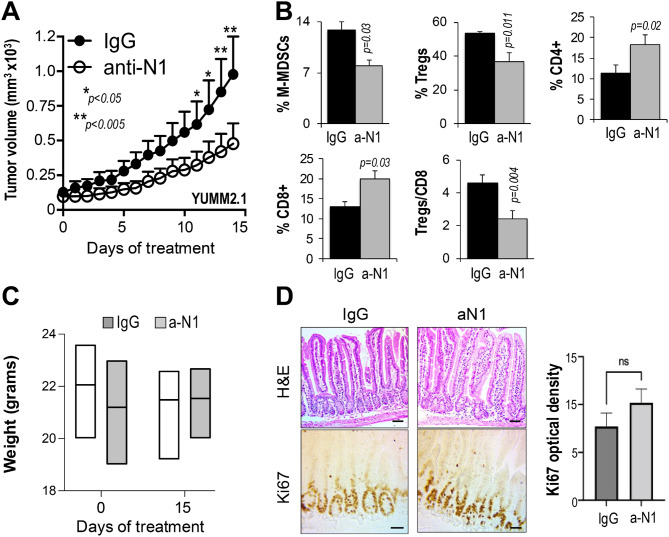
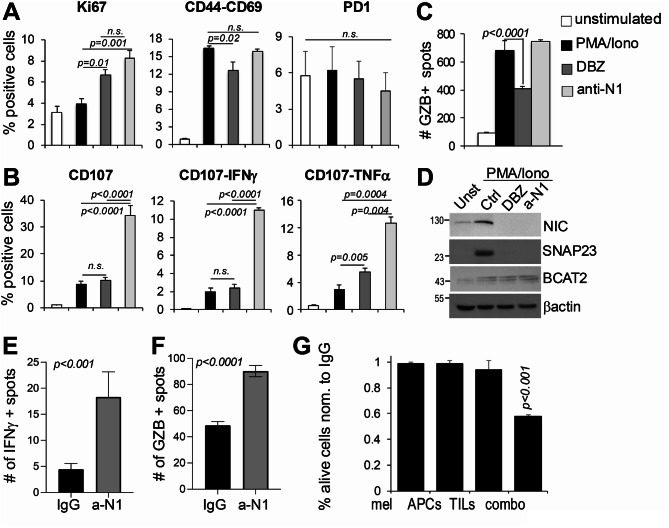
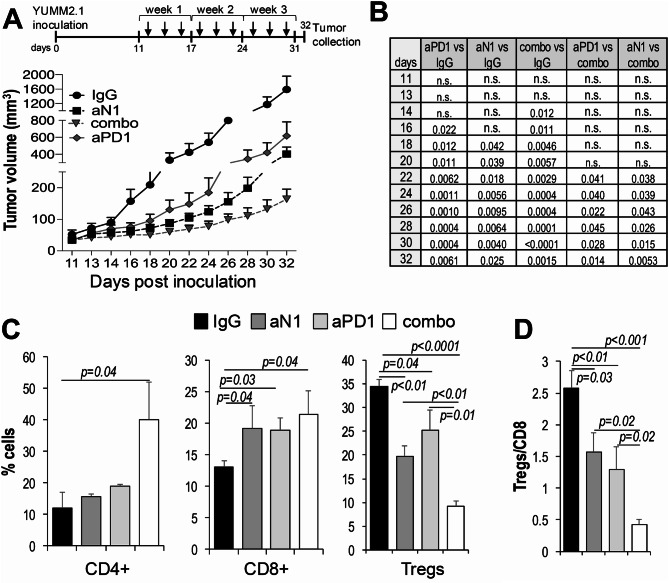
Methods: Anti-Notch1 was designed to interfere with ligand binding. Mice were immunized with a peptide encompassing EGF-like repeats 11-15 of human Notch1, the minimal required region that allows ligand binding and Notch1 activation. Positive clones were expanded and tested for neutralizing capabilities. Anti-Notch1-NIC was used to determine whether anti-Notch1 was able to reduce Notch1 cleavage; while anti-SNAP23 and BCAT2 were used as downstream Notch1 and Notch2 targets, respectively. K457 human melanoma cells and the YUMM2.1 and 1.7 syngeneic mouse melanoma cells were used. Cell death after anti-Notch1 treatment was determined by trypan blue staining and compared to the effects of the gamma-secretase inhibitor DBZ. 10 mg/kg anti-Notch1 was used for in vivo tumor growth of YUMM2.1 and 1.7 cells. Tumors were measured and processed for flow cytometry using antibodies against major immune cell populations.

Results: Anti-Notch1 selectively inhibited Notch1 but not Notch2; caused significant melanoma cell death in vitro but did not affect normal melanocytes. In vivo, it delayed tumor growth without evident signs of gastro-intestinal toxicities; and importantly promoted an inflamed TME by increasing the cytotoxic CD8+ T cells while reducing the tolerogenic Tregs and MDSCs, resulting in enhanced efficacy of anti-PD-1.

Conclusions: Anti-Notch1 safely exerts anti-melanoma effects and improves immune checkpoint inhibitor efficacy. Thus, anti-Notch1 could represent a novel addition to the immunotherapy repertoire for melanoma.


Conflict of interest statement

The authors declare that they have no competing interests.

Figures

Fig. 1
Fig. 1
Notch1 signaling inversely associates with the inflamed status of melanomas and response to anti-PD1 therapy. (A) T-cell inflamed gene signature derived from Spranger et al. (3), compared to Notch1 and Notch target genes HEY1, HEY2, HEYL. The expression of Notch1 and the Notch1 downstream genes inversely correlates with inflamed and non-inflamed tumors (TCGA melanoma data set https://tcga.xenahubs.net/download/TCGA.SKCM.sampleMap/HiSeqV2.gz). Notch pathway genes are highlighted in red. n = 474. (B) Timer2.0 immune infiltration in TCGA melanoma tumors in correlation with Notch1 gene expression. Spearman’s correlation, p < 0.05. Significant correlation is in bold color, non-significant is crossed. (C) HEY1 and HEYL expression is higher in patients that progressed on anti-PD-1 therapy in the GEO data set GSE78220. (D) HEY2 and HES1 expression is higher in patients that did not respond to anti-PD-1 therapy in the GEO data set GSE78220. (E) HEY1 expression is higher in patients that progressed on anti-PD-1 therapy (GEO data set GSE91061). (F) FFPE sections from the Sylvester biobank corresponding to anti-PD-1 and or anti-CTLA-4 or combination treated patients, that either responded or progressed. Immuno-staining: (a, c): anti-melanA; (b, d): anti-HES1; (c) negative control. Scale bar: 100 μm. Responders (R): partial and complete response; SD: stable disease; Non-responders (NR): progressive disease
Fig. 2
Fig. 2
Anti-N1 selectively inhibits Notch1. (A) EGF-like repeats 11–15 and 1–15 of Notch1 and 2. (B) K457 melanoma cells treated for 72 h with DBZ (5 μm) and 3 doses of anti-N1. C, D) Microarray analysis of WM266-4 cells expressing shGFP or shRNAs against each Notch receptor. Notch1 (C) and Notch2 (D) only modulated genes. SNAP23 and BCAT2 are shown. E) Total Notch1, Notch2, SNAP23 and BCAT2 expression in K457 cells expressing shNotch1 or shNotch2. F) Cleaved Notch1, SNAP23 and BCAT2 in K457 cells treated with IgG control or anti-N1 (25ug/ml) for 72 h
Fig. 3
Fig. 3
Anti-N1 causes melanoma cell death. (A) Notch1 expression in human (HMELS) melanocytes versus K457 melanoma cells, treated with IgG/DMSO, DBZ (10 μm) or anti-N1 (25ug/ml) for three days. (B) % cell death of the cells in A, measured by trypan blue. (C) Notch1 expression in mouse (MMELS) melanocytes versus YUMM2.1 and YUMM1.7 mouse melanoma cells, treated with IgG/DMSO, DBZ (10 μm) or anti-N1 (25ug/ml) for three days. (D) % cell death of the cells in C, measured by trypan blue. (E) Clonogenic assay of K457 cells treated with IgG or anti-Notch1 (25ug/ml). Colonies were counted after 10 days from seeding. F, G) 3D Spheroids were grown in collagen type I, then treated with IgG or anti-N1 (25ug/ml) for three days. Calcein AM and propidium iodide were added and green (alive) and red (dead) cells were assessed by quantifying the pixel intensity of each well. A minimum of 100 spheroids were counted. Data are the mean of three independent experiments each performed in triplicate. Scale bars: 100 μm
Fig. 4
Fig. 4
Anti-N1 delays tumor growth and promotes an inflamed TME: (A) Growth rates of YUMM2.1 tumors treated with IgG or anti-N1 (10 mg/Kg) every other day. Data are the mean ± SEM, of two experiments performed independently, each containing 10 tumors per group. (B) % M-MDSCs (CD11b+; Ly6Chi; ly6G = monocytic), Tregs (CD4+/FoxP3+), CD4+ T cells, CD8+ T cells, in the TME of YUMM2.1 tumors from the mice treated in A. The Tregs/CD8 ratio was calculated by dividing the absolute number of CD4+/FoxP3+ and CD8+ T cells in tumors. Absolute numbers were obtained by normalizing the number of cells detected by flow cytometry to the tumor mass. (C) Mouse weight at time 0 and at the end time point of 15 days. No significant differences were observed among groups (IgG vs. aN1) and between groups at time 0 and end time point (p > 0.05). (D) H&E and Ki67 staining of sections of intestines from the mice in A, collected at the end time point. Left: representative pictures; right: quantification of pixel intensity of Ki67 staining. n = 10. Scale bar: 100 μm
Fig. 5
Fig. 5
Anti-N1 promotes CD8+ T cytotoxicity. A, B) Flow cytometry for markers of cell growth (Ki67), activity (CD44/CD69), exhaustion (PD-1), degranulation (CD107a), IFNγ and TNFα in CD8+ T cells unstimulated or stimulated with PMA (50ng/ml) + ionomycin (500ng/ml) for 4 h in vitro. C) Granzyme B+ CD8 T cells treated as in A-B. Dots were counted by ELISpot. D) Expression of active Notch1 (NIC), the Notch1 selective target SNAP23 and the Notch2 selective target BCAT2 in CD8+ T cells. Data are the mean of 3 independent experiments. E, F) IFNγ and GZB ELISpot data from treated tumors. Data are the mean of two independent experiments each containing 5 tumors. P values were calculated by the Student’s t test. G) Naïve YUMM2.1 melanoma cells were co-cultured with TILs extracted from YUMM2.1 tumors treated with IgG or anti-N1, and APCs at a 5:1 ratio, then treated with 10ug/ml anti-N1 for an additional 12 h. Cells were then harvested for flow cytometry. Data are the % of alive cells in the anti-N1 group normalized to control (IgG), which was set at 1 for all treatments. Data are the mean of three independent experiments. Combo = melanoma + TILs + APCs
Fig. 6
Fig. 6
Anti-N1 boosts anti-PD-1 treatment. (A) Tumor growth of YUMM2.1 cells inoculated s.c. into C57BL/6 mice. Treatment with IgG control (10 mg/Kg), anti-N1 (10 mg/Kg) or anti PD-1 (100ug/mouse) started at day 11 post inoculation, when tumors reached an average volume of 100-150mm3. The Y axis, representing tumor growth, has been sectioned into three lines to better show the separation in growth among treatments and between treatments and control. (B) Student’s t test for each time point. n.s.= not significant. (C) % of CD4+ T cells, CD8 + T cells, and Tregs in the TME of each treatment group. (D) Tregs/CD8 ratio. N = 20 per group. This experiment was performed twice, and data combined, with n = 10 per group, per experiment. Significance was calculated by the Student’s t test

References

    1. Wolchok JD, Chiarion-Sileni V, Gonzalez R, Grob JJ, Rutkowski P, Lao CD, Cowey CL, Schadendorf D, Wagstaff J, Dummer R, et al. Long-term outcomes with Nivolumab Plus Ipilimumab or Nivolumab alone Versus Ipilimumab in patients with Advanced Melanoma. J Clin Oncol. 2022;40(2):127–37. - PMC - PubMed
    1. Ribas A, Hamid O, Daud A, Hodi FS, Wolchok JD, Kefford R, Joshua AM, Patnaik A, Hwu WJ, Weber JS, et al. Association of Pembrolizumab with Tumor Response and Survival among patients with Advanced Melanoma. JAMA. 2016;315(15):1600–9. - PubMed
    1. Spranger S, Bao R, Gajewski TF. Melanoma-intrinsic beta-catenin signalling prevents anti-tumour immunity. Nature. 2015;523(7559):231–5. - PubMed
    1. Spranger S, Dai D, Horton B, Gajewski TF. Tumor-residing Batf3 dendritic cells are required for effector T cell trafficking and adoptive T cell therapy. Cancer Cell. 2017;31(5):711–e723714. - PMC - PubMed
    1. Peng W, Chen JQ, Liu C, Malu S, Creasy C, Tetzlaff MT, Xu C, McKenzie JA, Zhang C, Liang X, et al. Loss of PTEN promotes resistance to T cell-mediated immunotherapy. Cancer Discov. 2016;6(2):202–16. - PMC - PubMed