. 2024 Nov 4;22(1):135.
doi: 10.1186/s12958-024-01307-6.

17α-Ethynylestradiol alters testicular epigenetic profiles and histone-to-protamine exchange in mice

Affiliations

17α-Ethynylestradiol alters testicular epigenetic profiles and histone-to-protamine exchange in mice

L Ded et al. Reprod Biol Endocrinol. .

Abstract

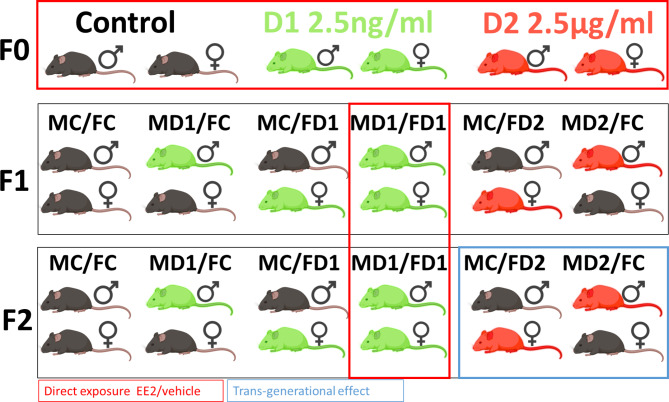
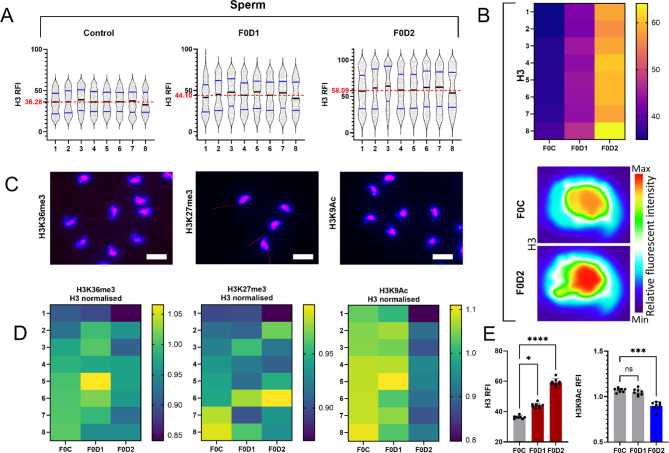
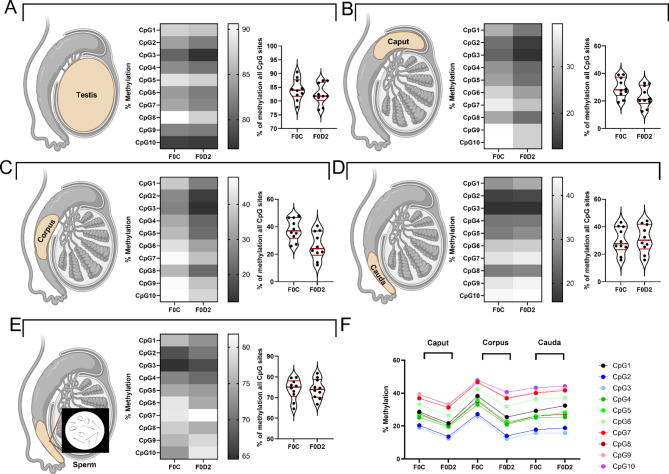
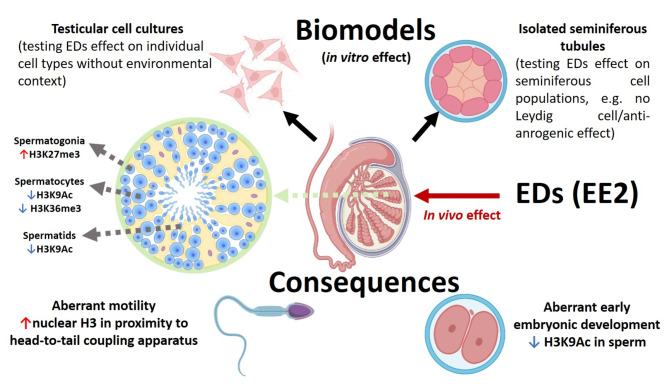
Spermatogenesis starts with the onset of puberty within the seminiferous epithelium of the testes. It is a complex process under intricate control of the endocrine system. Physiological regulations by steroid hormones in general and by estrogens in particular are due to their chemical nature prone to be disrupted by exogenous factors acting as endocrine disruptors (EDs). 17α-Ethynylestradiol (EE2) is an environmental pollutant with a confirmed ED activity and a well-known effect on spermatogenesis and chromatin remodeling in haploid germ cells. The aim of our study was to assess possible effects of two doses (2.5ng/ml; 2.5 μg/ml) of EE2 on both histone-to-protamine exchange and epigenetic profiles during spermatogenesis performing a multi/transgenerational study in mice. Our results demonstrated an impaired histone-to-protamine exchange with a significantly higher histone retention in sperm nuclei of exposed animals, when this process was accompanied by the changes of histone post-translational modifications (PTMs) abundancies with a prominent effect on H3K9Ac and partial changes in protamine 1 promoter methylation status. Furthermore, individual changes in molecular phenotypes were partially transmitted to subsequent generations, when no direct trans-generational effect was observed. Finally, the uncovered specific localization of the histone retention in sperm nuclei and their specific PTMs profile after EE2 exposure may indicate an estrogenic effect on sperm motility and early embryonic development via epigenetic mechanisms.

Keywords: 17α-Ethynylestradiol; DNA methylation; EE2; Endocrine disruptors; Histone-to-protamine exchange; Post-translational modifications; Sperm; Testis; Transgenerational study.


Conflict of interest statement

The authors declare no competing interests.

Figures

Fig. 1
Fig. 1
Scheme showing in vivo exposure and breeding of control and experimental mouse groups in F0 generation to produce F1 and F2 progeny. Animals directly exposed to EE2 doses D1 and D2 are indicated by red rectangles, animals probing the potential trans-generational effect by blue rectangle. MC – male control; FC – female control; MD1 – male from lineage exposed to dose D1; FD1 – female from lineage exposed to dose D1; MD2 – male from lineage exposed to dose D2; FD2 – female from lineage exposed to dose D2
Fig. 2
Fig. 2
Testicular tissue slides and epididymal sperm imaging and image analysis. (A) Tile scan of the entire testicular tissue section H3 staining; scale bar indicates 300 μm. (B) DAPI counter-staining of the corresponding section; scale bar indicates 300 μm. C-D) Magnification of the region of interest (ROI) of the section; scale bars indicates 200 μm (C) and 100 μm (D). E) Individual seminiferous tubule ROI; scale bar indicates 50 μm. F) Application of the mask for individual cell nuclei fluorescent signal isolation; scale bar indicates 50 μm. G) Isolation of signals from individual cell populations (black – all cells; blue – spermatogonia; green – spermatocytes; red/orange – spermatids and sperm. H-I) Visualization of individual cell populations blue – spermatogonia; green – spermatocytes; red/orange – spermatids and sperm in 3D Principal component analysis (PCA) plot (I) (see Fig. 3 for details) (H). Fluorescent signal of H3 staining (magenta) of decondensed sperm nuclei counter stained with DAPI (blue); scale bar indicates 10 μm (I). J) Relative fluorescent intensities (RFI) histograms over the sperm head stained with anti-H3 antibody. K-L) Alignment of fluorescent signals from nuclei (K), their super-position (L) for consensus heat map generation (M)
Fig. 3
Fig. 3
Principal component and statistical analysis of the seminiferous tubule individual germ cells populations. Principal components (PC; upper row) and violin plots (bottom row) representing individual testicular/seminiferous tubule germ cell populations size, roundness/complexity and distance from lumen (PC plots x, y,z axes) and distributions of their RFI signals from H3 staining normalized per DAPI signal (violin plots). Nc – number of cells from individual populations with no observed statistically significant differences after random picking from 5 WT testicular sections (C1 – C5; tile scans; whole section life screenings). (A) Spermatogonial cell populations. (B) Spermatocyte cell populations. (C) Spermatid/sperm cell populations
Fig. 4
Fig. 4
Microscopic and statistical profiling of histone PTMs in testicular tissue sections (A) Immunohistochemical and immunofluorescent staining of testicular tissue sections. Top panel: NC – negative controls without primary antobodies/isotype for immunohistochemical staining (left) and immunofluorescent staining (right). Top and bottom panel: representative images of the testicular tissue stained with individual anti-histone PTMs antibodies – immunohistochemistry (top row) and immunofluorescent microscopy (bottom row). (B) Heat maps showing the differences in relative fluorescent intensities of 3 selected histone PTMs in individual testicular germ cell populations among control and experimental groups. (C) Inferential statistical analysis of the control and experimenal groups with detected significant differences among individual histone PTMs abundancies in individual germ cell populations in F0, F1 and F2 generation. *p ≤ 0.05; **p ≤ 0.01; ***p ≤ 0.001
Fig. 5
Fig. 5
Microscopic and statistical analysis of core histones and histone PTMs abundancies in sperm. (A) Violin plots showing the epididymal sperm sample variabilities in core H3 histone fluorescent staining among P generations - control and experimental (F0D1; F0D2) groups (Nsamples = 8; Ncells = 200). (B) Heat map represents differences in core histone H3 staining among parental control (F0C) and experimental groups (Nsamples = 8; top panel) and consensus in situ heat map of sperm nuclei H3 staining from control F0C group (bottom upper panel) and experimental F0D2 group (bottom lower panel). (C) Representative images showing immunofluorescent staining of individual histone PTMs in decondensed sperm nuclei. Scale bare 10 μm. (D) Heat maps represents H3 normalized histone PTMs sperm nuclei abundancies among control and experimental groups of P generation. (E) Inferential statistical analysis of the control and experimenal groups with the detected significant differences among individual core H3 histone and histone PTMs abundancies in sperm nuclei in P generation. *p ≤ 0.05; **p ≤ 0.01; ***p ≤ 0.001. Red columns indicate a significant RFI increase; blue columns indicate a significant RFI decrease
Fig. 6
Fig. 6
Analysis of protamine 1 promotor methylation status in testis, epididymis and sperm. Methylation analysis of individual CpG sites from Prm1 gene CpG island area in the parental (F0) generation between control and experimental F0D2 groups. (A) Heat map showing % methylation of individual (1–10) CpG sites from testicular tissue (cartoon on the left) and the violin plots showing the total methylation status among all CpG sites (showed as data points) in F0C and experimental F0D2 groups (right). (B) Corresponding results for caput epididymis. (C) Corpus epididymis. (D) Cauda epididymis. (E) Epididymal sperm isolated from cauda epididymis. (F) Tendency plot showing % methylation of 1–10 Prm1 CpG sites in individual parts of epididymis (caput, corpus, cauda) in control (F0C) and experimental (F0D2) samples
Fig. 7
Fig. 7
Summary of major observed effects of EE2 exposure on testicular and sperm epigenetic profiles. Presented biomodels for in depth analysis of individual EE2 epigenetic mechanisms, and potential physiological consequences of observed epigenetic changes

References

    1. Knobil and Neill’s Physiology of Reproduction, Vols 1 and 2, 3rd Editon. Knobil and Neill’s Physiology of Reproduction, Vols 1 and 2, 3rd Editon, 2006: pp. 1-3238.
    1. Bao J, Bedford MT. Epigenetic regulation of the histone-to-protamine transition during spermiogenesis. Reproduction. 2016;151(5):R55–70. - PMC - PubMed
    1. Ded L, et al. Effect of estrogens on boar sperm capacitation in vitro. Reprod Biol Endocrinol. 2010;8:87. - PMC - PubMed
    1. Ded L, et al. In vivo exposure to 17beta-estradiol triggers premature sperm capacitation in cauda epididymis. Reproduction. 2013;145(3):255–63. - PubMed
    1. Sebkova N, et al. The slower the better: how sperm capacitation and acrosome reaction is modified in the presence of estrogens. Reproduction. 2012;143(3):297–307. - PubMed

LinkOut - more resources