. 2025 Jan;14(2):e2402757.
doi: 10.1002/adhm.202402757. Epub 2024 Nov 3.

Intervening to Preserve Function in Ischemic Cardiomyopathy with a Porous Hydrogel and Extracellular Matrix Composite in a Rat Myocardial Infarction Model

Affiliations

Intervening to Preserve Function in Ischemic Cardiomyopathy with a Porous Hydrogel and Extracellular Matrix Composite in a Rat Myocardial Infarction Model

Yasunari Hayashi et al. Adv Healthc Mater. 2025 Jan.

Abstract

Multiple hydrogels are developed for injection therapy after myocardial infarction, with some incorporating substances promoting tissue regeneration and others emphasizing mechanical effects. In this study, porosity and extracellular matrix-derived digest (ECM) are incorporated, into a mechanically optimized, thermoresponsive, degradable hydrogel (poly(N-isopropylacrylamide-co-N-vinylpyrrolidone-co-MAPLA)) and evaluate whether this biomaterial injectate can abrogate adverse remodeling in rat ischemic cardiomyopathy. After myocardial infarction, rats are divided into four groups: NP (non-porous hydrogel) without either ECM or porosity, PM (porous hydrogel) from the same synthetic copolymer with mannitol beads as porogens, and PME with porosity and ECM digest added to the synthetic copolymer. PBS injection alone is a control group. Intramyocardial injections occurred 3 days after myocardial infarction followed by serial echocardiography and histological assessments 8 weeks after infarction. Echocardiographic function and neovascularization improved in the PME group compared to the other hydrogels and PBS injection. The PME group also demonstrated improved LV geometry and macrophage polarization (toward M2) compared to PBS, whereas differences are not observed in the NP or PM groups versus control. These results demonstrate further functional improvement may be achieved in hydrogel injection therapy for ischemic cardiomyopathy by incorporating porosity and ECM digest, representing combined mechanical and biological effects.

Keywords: extracellular matrix; hydrogel; myocardial infarction; porous structure.


Conflict of interest statement

The authors declare no conflict of interest.

Figures

Figure 1
Figure 1
Timeline of study. All echocardiographic images in this figure were taken during the diastolic phase at 8 weeks before explant. The Masson's trichrome staining images show the injection sites. Image created with BioRender.com.
Figure 2
Figure 2
Left ventricular wall thickness and scar size. The representative images from each group of the left ventricular wall with Masson's trichrome staining. Scale bars = 1 mm. B) The zoom images of box regions in (A), focusing on and around injection sites. Scale bars = 100 µm. The LV wall thickness C) in the myocardial infarction area and D) in injection sites. E) The scar size in the myocardial infarction area. The PBS (n = 8), NP(n = 6), PM (n = 5), and PME (n = 5). *p < 0.05, **p < 0.01, ***p < 0.001, ****p <0.0001.
Figure 3
Figure 3
Echocardiography. A) Left ventricular end‐diastolic diameter (LVDd), B) Left ventricular end‐systolic diameter (LVDs), C) End‐diastolic area (EDA), D) End‐systolic area (ESA), E) End‐diastolic volume (EDV), F) End‐systolic volume (ESV), G) Fractional shortening (%FS), H) Fractional area change (%FAC), I) Ejection fraction (EF). All data are means ± SEM and were assessed by one‐way ANOVA followed by Tukey's multiple comparisons test. *p < 0.05, **p < 0.01, and ****p < 0.0001 between the PME and PBS groups. ##p < 0.01 between the PM, NP, and PBS groups. §p < 0.05 between the PME and the other hydrogel groups (the PM or NP).
Figure 4
Figure 4
Macrophage infiltration and polarization. The representative images of immunofluorescence staining for A,B) CD68 (red) and CD86 (green), and C,D) CD68 (red) and CD206 (green) in the ischemic areas, and injection sites & injection border zones. Red‐stained areas that appear to be myocardium structures were excluded as autofluorescence. All scale bars = 100 µm. Arrows show CD86/CD68 double‐positive cells or CD206/CD68 double‐positive cells. E) The percent ratio of M1 macrophages to all macrophages in the ischemic areas. F) The percent ratio of M2 macrophages to all macrophages in the injection areas. G) The ratio of M2 macrophages to M1 macrophages in the injection area. Data are means ± SEM. *p < 0.05 and ***p < 0.001 assessed by one‐way ANOVA followed by Tukey's multiple comparisons test. Is: Ischemic area, Bz: injection border zone, Ij: injection site.
Figure 4
Figure 4
Macrophage infiltration and polarization. The representative images of immunofluorescence staining for A,B) CD68 (red) and CD86 (green), and C,D) CD68 (red) and CD206 (green) in the ischemic areas, and injection sites & injection border zones. Red‐stained areas that appear to be myocardium structures were excluded as autofluorescence. All scale bars = 100 µm. Arrows show CD86/CD68 double‐positive cells or CD206/CD68 double‐positive cells. E) The percent ratio of M1 macrophages to all macrophages in the ischemic areas. F) The percent ratio of M2 macrophages to all macrophages in the injection areas. G) The ratio of M2 macrophages to M1 macrophages in the injection area. Data are means ± SEM. *p < 0.05 and ***p < 0.001 assessed by one‐way ANOVA followed by Tukey's multiple comparisons test. Is: Ischemic area, Bz: injection border zone, Ij: injection site.
Figure 5
Figure 5
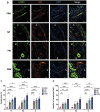
Vessel analysis of the representative images of immunofluorescence staining for α‐SMA (green) and vWF (red) in (A) ischemic areas and B) border zones and injection sites. The areas encircled with dashed white lines correspond to the injection sites. All scale bars = 50 µm. G: hydrogel. Measurements of C) vessel density per ROI region and D) number of vessels per field. Data are means ± SEM. *p < 0.05, **p < 0.01, ***p < 0.001, and ****p < 0.0001 assessed by one‐way ANOVA followed by Tukey's multiple comparisons test. Is: Ischemic area, Bz: injection border zone, Ij: injection site.
Figure 5
Figure 5
Vessel analysis of the representative images of immunofluorescence staining for α‐SMA (green) and vWF (red) in (A) ischemic areas and B) border zones and injection sites. The areas encircled with dashed white lines correspond to the injection sites. All scale bars = 50 µm. G: hydrogel. Measurements of C) vessel density per ROI region and D) number of vessels per field. Data are means ± SEM. *p < 0.05, **p < 0.01, ***p < 0.001, and ****p < 0.0001 assessed by one‐way ANOVA followed by Tukey's multiple comparisons test. Is: Ischemic area, Bz: injection border zone, Ij: injection site.

Similar articles

References

    1. Martin S. S., Aday A. W., Almarzooq Z. I., Anderson C. A. M., Arora P., Avery C. L., Baker‐Smith C. M., Barone Gibbs B., Beaton A. Z., Boehme A. K., Commodore‐Mensah Y., Currie M. E., Elkind M. S. V., Evenson K. R., Generoso G., Heard D. G., Hiremath S., Johansen M. C., Kalani R., Kazi D. S., Ko D., Liu J., Magnani J. W., Michos E. D., Mussolino M. E., Navaneethan S. D., Parikh N. I., Perman S. M., Poudel R., Rezk‐Hanna M., et al., Circulation. 2024, 149, e347. - PubMed
    1. Gerber Y., Weston S. A., Redfield M. M., Chamberlain A. M., Manemann S. M., Jiang R., Killian J. M., Roger Minnesota V. L., JAMA Intern. Med. 2015, 175, 996. - PMC - PubMed
    1. Pfeffer M. A., Braunwald E., Circulation 1990, 81, 1161. - PubMed
    1. Mann D. L., Bristow M. R., Circulation 2005, 111, 2837. - PubMed
    1. Yoshizumi T., Zhu Y., Jiang H., D'Amore A., Sakaguchi H., Tchao J., Tobita K., Wagner W. R., Biomaterials 2016, 83, 182. - PMC - PubMed