. 2024 Nov;30(11):e70083.
doi: 10.1111/cns.70083.

Construction of a Prognostic Model for Mitochondria and Macrophage Polarization Correlation in Glioma Based on Single-Cell and Transcriptome Sequencing

Affiliations

Construction of a Prognostic Model for Mitochondria and Macrophage Polarization Correlation in Glioma Based on Single-Cell and Transcriptome Sequencing

Pengyu Chen et al. CNS Neurosci Ther. 2024 Nov.

Abstract

Background: Numerous diseases are associated with the interplay of mitochondrial and macrophage polarization. However, the correlation of mitochondria-related genes (MRGs) and macrophage polarization-related genes (MPRGs) with the prognosis of glioma remains unclear. This study aimed to examine this relationship based on bioinformatic analysis.

Methods: Glioma-related datasets (TCGA-GBMLGG, mRNA-seq-325, mRNA-seq-693, GSE16011, GSE4290, and GSE138794) were included in this study. The intersection genes were obtained by overlapping differentially expressed genes (DEGs) from differential expression analysis in GSE16011, key module genes from WGCNA, and MRGs. Subsequently, the intersection genes were further screened to obtain prognostic genes. Following this, a risk model was developed and verified. After that, independent prognostic factors were identified, followed by the construction of a nomogram and subsequent evaluation of its predictive ability. Furthermore, immune microenvironment analysis and expression validation were implemented. The GSE138794 dataset was utilized to evaluate the expression of prognostic genes at a cellular level, followed by conducting an analysis on cell-to-cell communication. Finally, the results were validated in different datasets and tissue samples from patients.

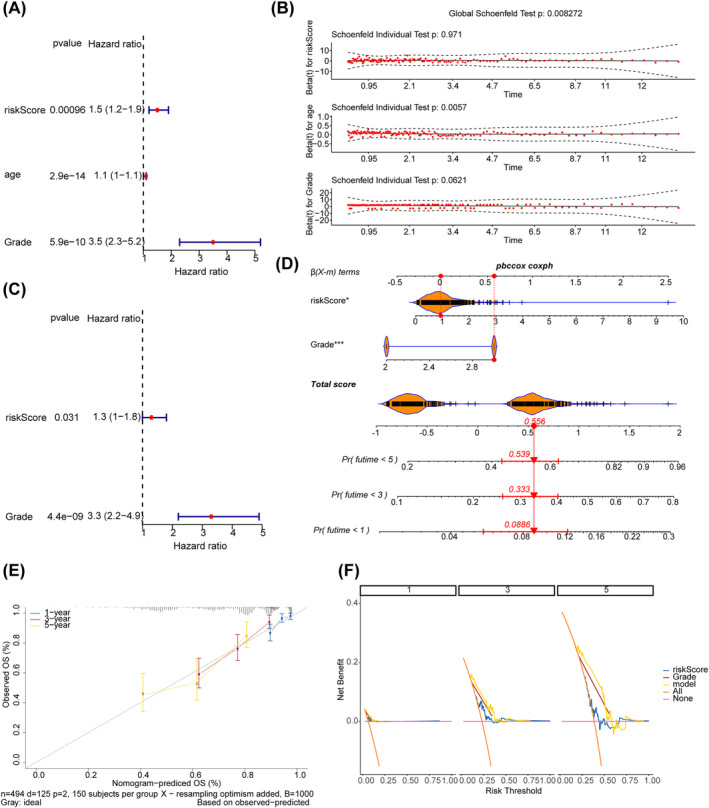
Results: ECI2, MCCC2, OXCT1, SUCLG2, and CPT2 were identified as prognostic genes for glioma. The risk model constructed based on these genes in TCGA-GBMLGG demonstrated certain accuracy in predicting the occurrence of glioma. Additionally, the nomogram constructed based on risk score and grade exhibited strong performance in predicting patient survival. Significant differences were observed in the proportion of 27 immune cell types (e.g., activated B cells and macrophages) and the expression of 32 immune checkpoints (e.g., CD70, CD200, and CD48) between the two risk groups. Single-cell RNA sequencing showed that CPT2, ECI2, and SUCLG2 were highly expressed in oligodendrocytes, neural progenitor cells, and BMDMs, respectively. The results of cell-cell communication analysis revealed that both oligodendrocytes and BMDMs exhibited a substantial number of interactions with high strength.

Conclusion: This study revealed five genes associated with the prognosis of glioma (ECI2, MCCC2, OXCT1, SUCLG2, and CPT2), providing novel insights into individualized treatment and prognosis.

Keywords: glioma; immune microenvironment; macrophage polarization; mitochondria; risk model; single‐cell RNA‐seq analysis.


Conflict of interest statement

The authors declare no conflicts of interest.

Figures

FIGURE 1
FIGURE 1
Screening of DEGs and key module genes. (A) Volcano map of DEGs between glioma and control groups in GSE16011 dataset. (B) Heat map of DEGs between glioma and control groups in GSE16011 dataset. (C) Clustering of samples in WGCNA. (D) Scale‐free soft threshold distribution. (E) Tree diagram of co‐expression network modules. (F) K‐M survival analysis between high and low expression groups of MPRGs score. (G) Correlation heat map between modules and MPRGs score.
FIGURE 2
FIGURE 2
Identification of candidate genes. (A) Venn diagrams for intersection genes. (B) GO enrichment plot of intersection genes. (C) KEGG enrichment plot of intersection genes. (D) PPI networks for intersection genes. (E) Identification of candidate genes.
FIGURE 3
FIGURE 3
Construction and evaluation of risk model. (A) Univariate Cox regression analysis forest plot. (B) PH hypothesis test. (C) LASSO regression analysis. (D) Survival scatterplot in TCGA‐GBMLGG dataset. (E) K‐M survival curves. The left panel shows the K‐M survival curves for the TCGA dataset. The right panel shows the K‐M survival curves for the CGGA dataset. (F) ROC curves in TCGA‐GBMLGG dataset. (G) Expression of prognostic genes in TCGA‐GBMLGG dataset. (H) Survival scatterplot in validation set 1. (I) KM survival curves in the validation set 1. (J) ROC curves in the validation set 1. (K) Expression of prognostic genes in the validation set 1.
FIGURE 4
FIGURE 4
Creation and evaluation of nomogram. (A) Univariate Cox regression analysis forest plot. (B) pH hypothesis test. (C) Multivariate Cox regression forest plot. (D) Nomogram to predict patient survival at 1, 3, 5 years. (E) Calibration curve of the nomogram. (F) DCA of the nomogram.
FIGURE 5
FIGURE 5
Functional pathways and immune analysis. (A) GSEA enrichment result. (B) Heat map of the immune cell infiltration level between the two risk subgroups. (C) Identification of differential immune cells. (D) Heat map of correlation between prognostic genes and differential immune cells. (E) Differences in expression of immune checkpoints between the two risk subgroups. (F) Heatmap of correlation between prognostic genes and differential immune checkpoints.
FIGURE 6
FIGURE 6
Analysis of protein expression, regulatory mechanisms and validation of prognostic genes. (A) Subcellular localization of prognostic genes. (B) The protein expression of prognostic genes between glioma and control samples from the HPA database. (C) TF‐mRNA network. (D) LncRNA‐miRNA‐mRNA network. (E) Expression levels of prognostic genes in glioma and normal controls in GSE16011 and GSE4290 datasets. (F) and (G) The qPCR and WB results of prognostic genes in glioma tissues and paracancerous tissues.
FIGURE 7
FIGURE 7
Identification of three key cells through single‐cell RNA‐seq analysis. (A) Plot of PCA inflection points. (B) UMAP cell clustering map. (C) Clustering map after cell annotation. (D) Prognostic gene expression in different cells. (E) Scatterplot of clustered marker genes expression before cell annotation. (F) Scatterplot of clustered marker genes expression after cell annotation.
FIGURE 8
FIGURE 8
Analysis of differentiation trajectories and interactions of key cells. (A) The differentiation trajectories of BMDM. (B) The differentiation trajectories of neural progenitor cells. (C) The differentiation trajectories of oligodendrocytes. (D) Trends of prognostic gene expression at various stages with BMDM cell differentiation. (E) Cellular communication between the five cell types is obtained by annotation. (F) Interaction pathways for each cell type.

References

    1. Chen R., Smith‐Cohn M., Cohen A. L., and Colman H., “Glioma Subclassifications and Their Clinical Significance,” Neurotherapeutics 14, no. 2 (2017): 284–297. - PMC - PubMed
    1. Xu S., Tang L., Li X., Fan F., and Liu Z., “Immunotherapy for Glioma: Current Management and Future Application,” Cancer Letters 476 (2020): 1–12. - PubMed
    1. Nunnari J. and Suomalainen A., “Mitochondria: In Sickness and in Health,” Cell 148, no. 6 (2012): 1145–1159. - PMC - PubMed
    1. Mehla K. and Singh P. K., “Metabolic Regulation of Macrophage Polarization in Cancer,” Trends Cancer 5, no. 12 (2019): 822–834. - PMC - PubMed
    1. Anderson N. R., Minutolo N. G., Gill S., and Klichinsky M., “Macrophage‐Based Approaches for Cancer Immunotherapy,” Cancer Research 81, no. 5 (2021): 1201–1208. - PubMed

Publication types

Associated data