. 2024 Nov 20:225:833-845.
doi: 10.1016/j.freeradbiomed.2024.10.307. Epub 2024 Nov 2.

The Complement Factor H (Y402H) risk polymorphism for age-related macular degeneration affects metabolism and response to oxidative stress in the retinal pigment epithelium

Affiliations

The Complement Factor H (Y402H) risk polymorphism for age-related macular degeneration affects metabolism and response to oxidative stress in the retinal pigment epithelium

Peng Shang et al. Free Radic Biol Med. .

Abstract

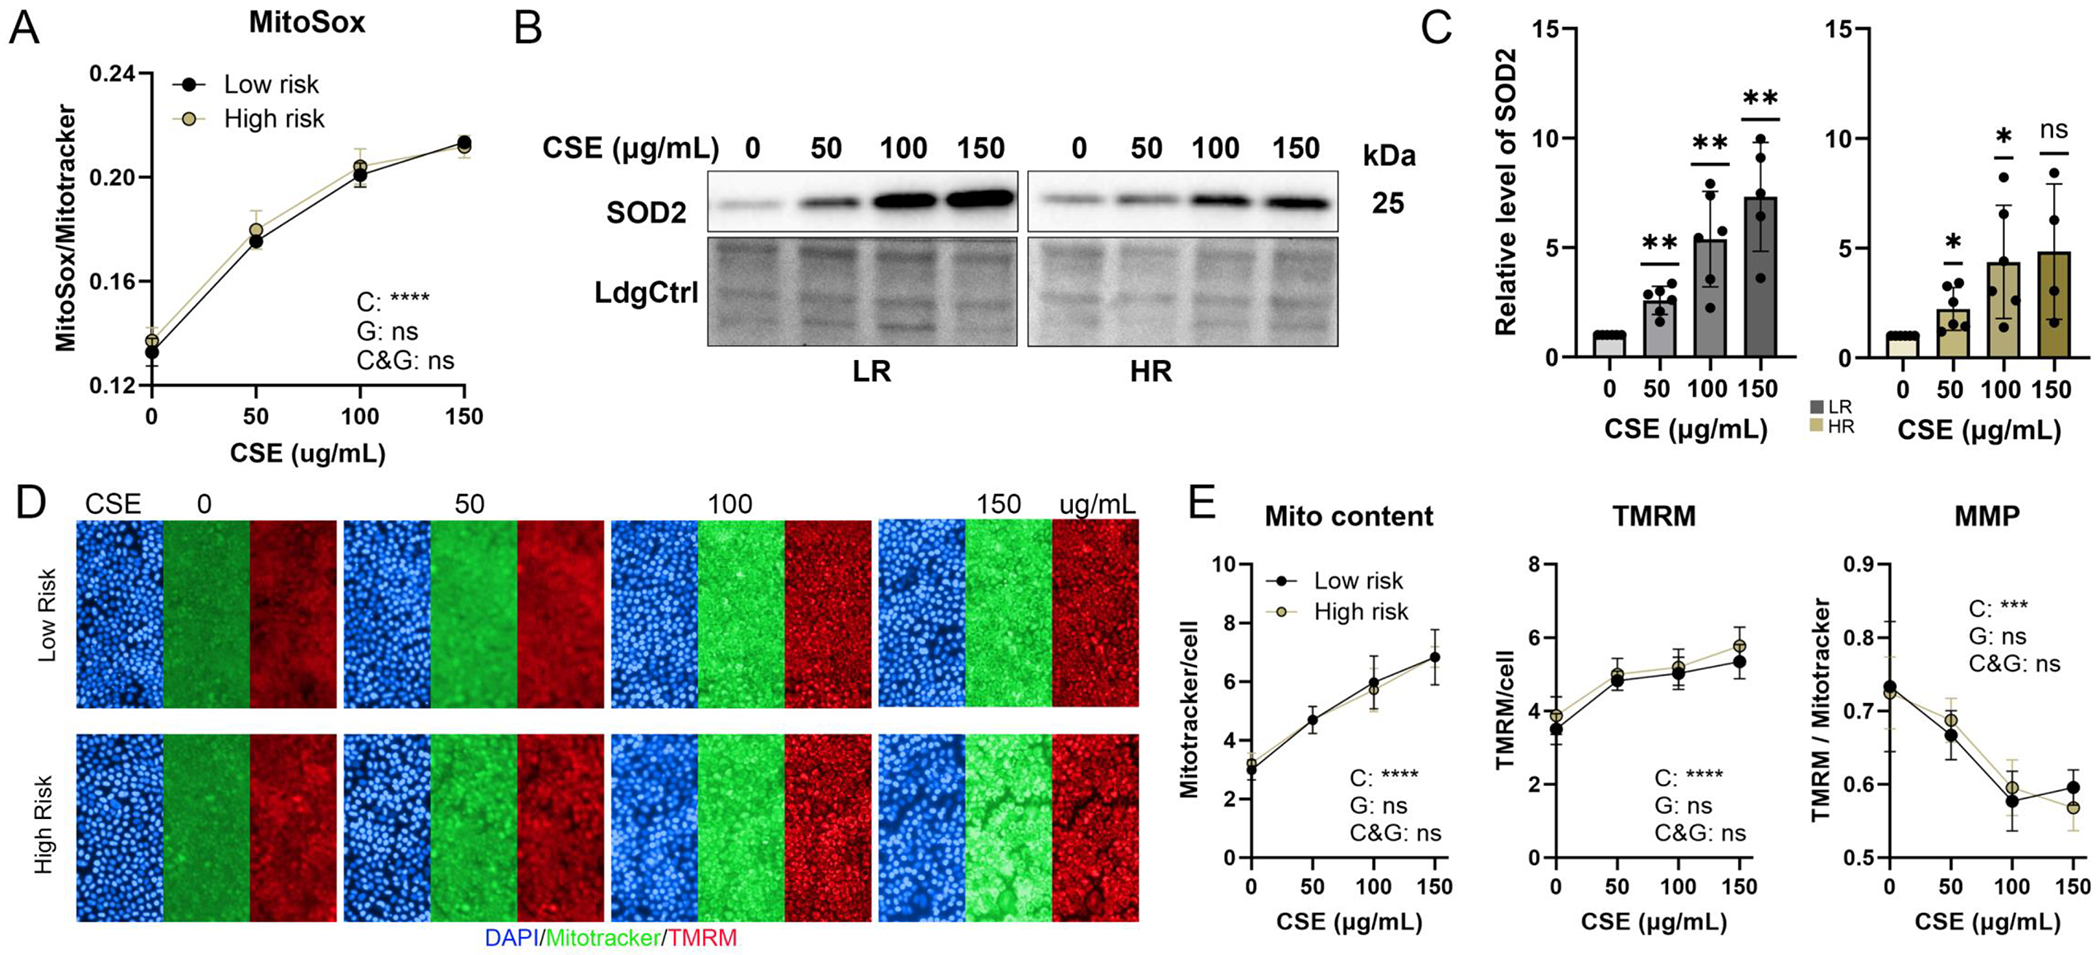
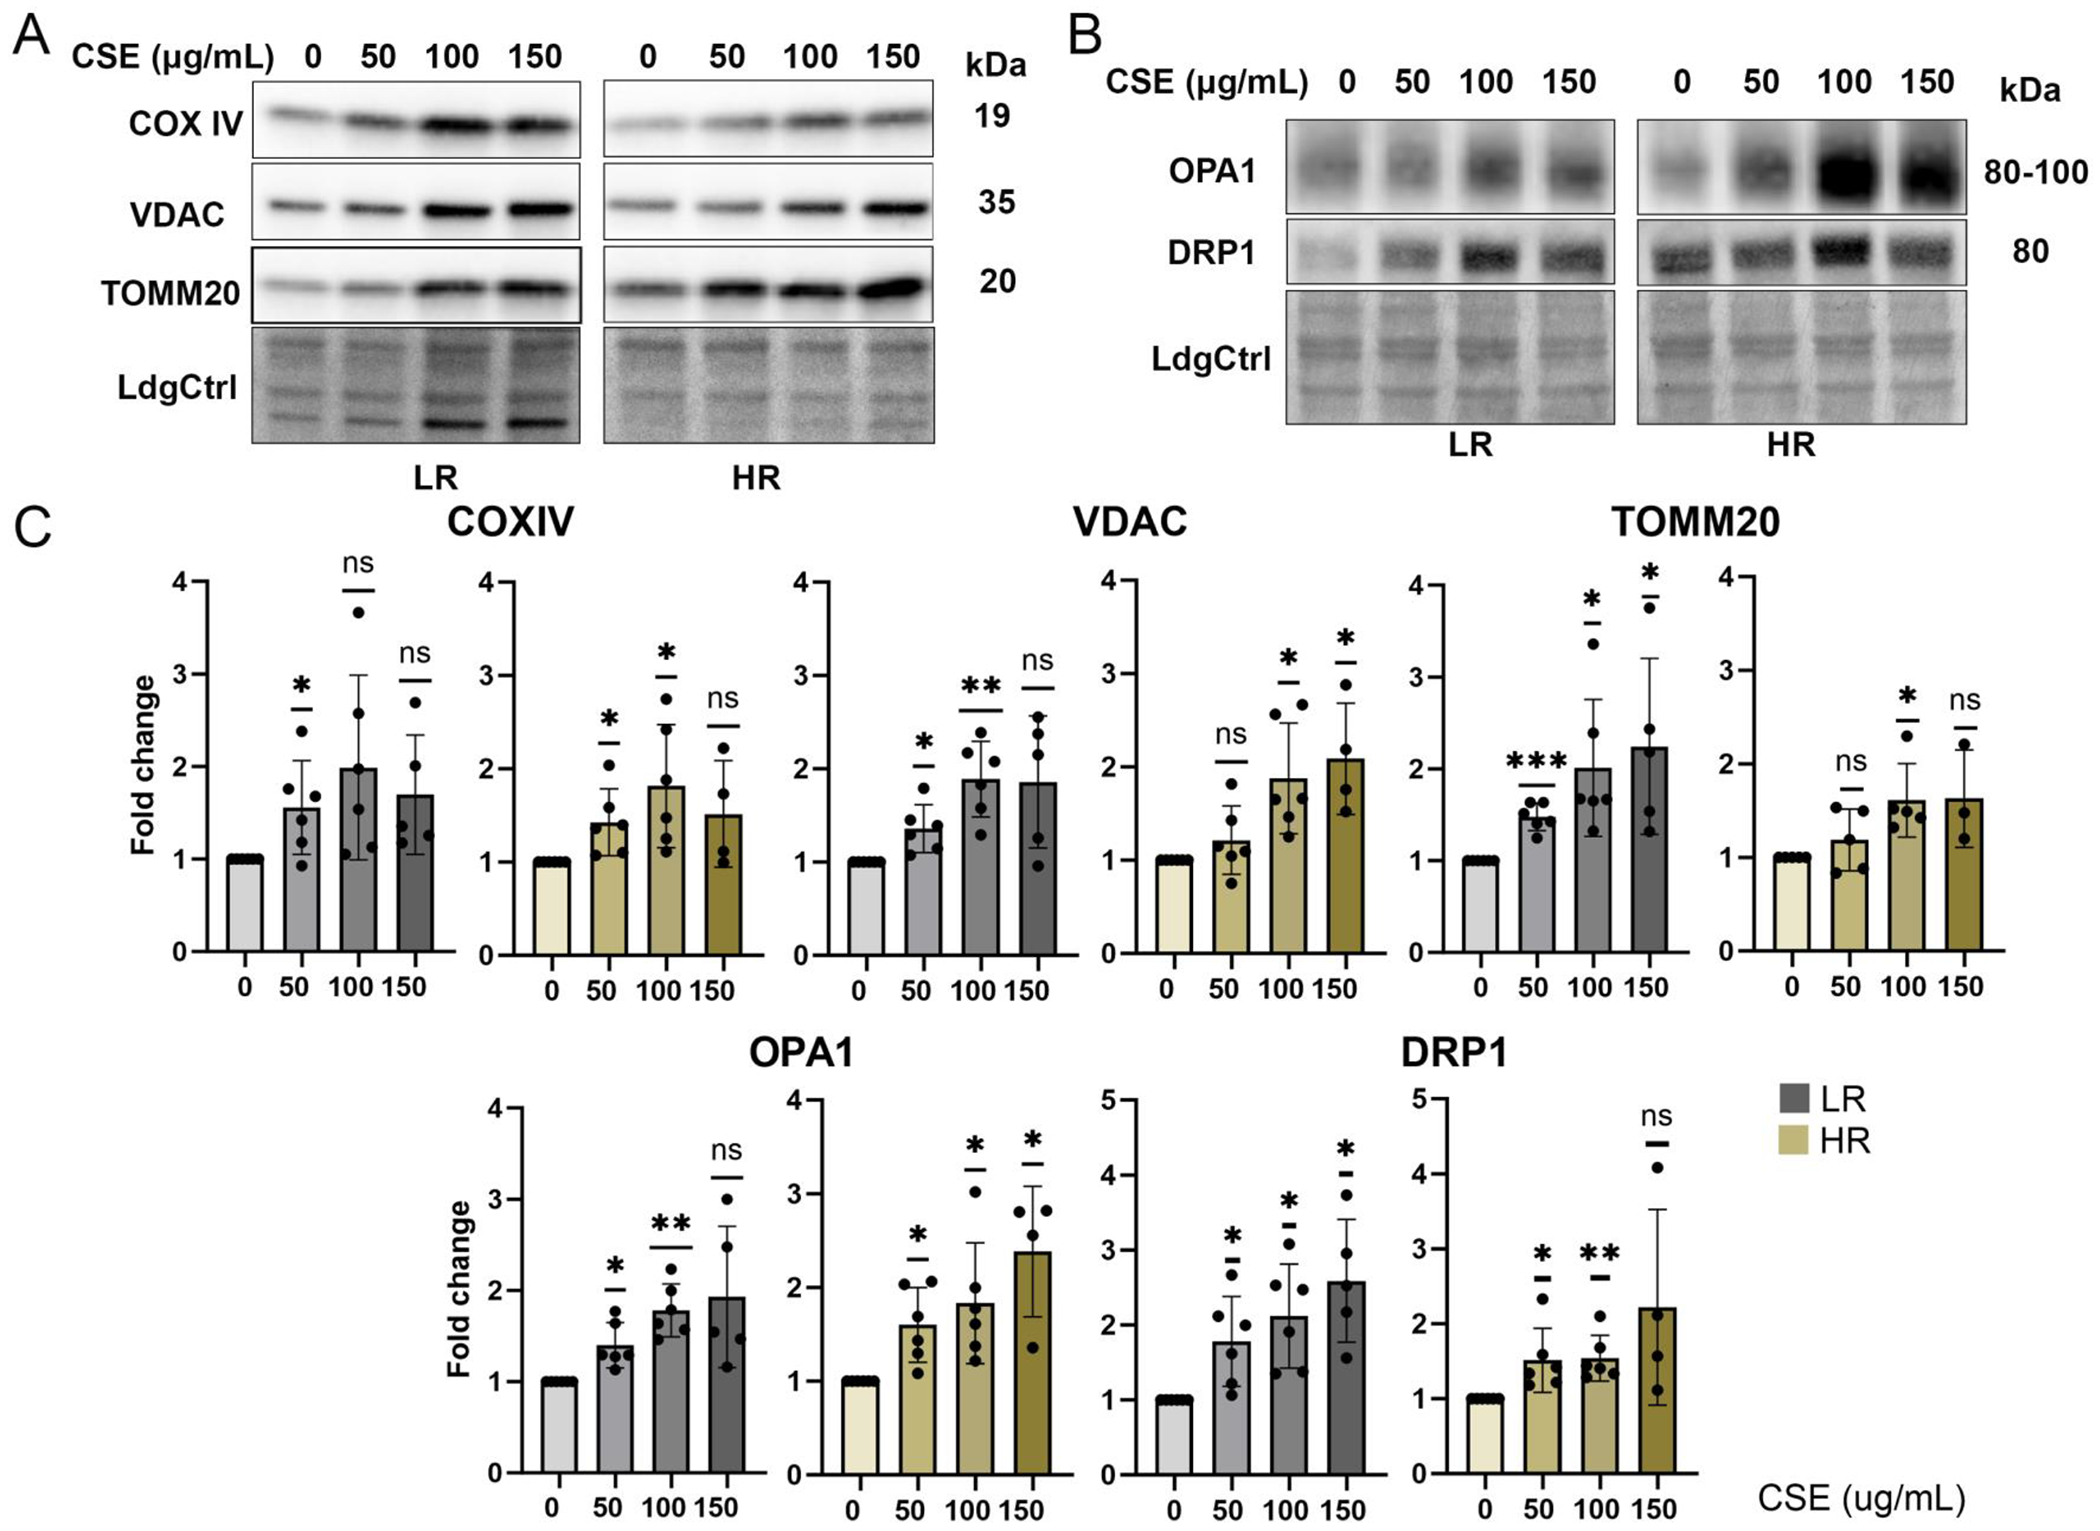
Age-related macular degeneration (AMD), the leading cause of central vision loss in the elderly, involves death of the retinal pigment epithelium (RPE) and light-sensing photoreceptors. This multifactorial disease includes contributions from both genetic and environmental risk factors. The current study examined the effect of the Y402H polymorphism of Complement Factor H (CFH, rs1061170) and cigarette smoke, predominant genetic and environmental risk factors associated with AMD. We used targeted and discovery-based approaches to identify genotype-dependent responses to chronic oxidative stress induced by cigarette smoke extract (CSE) in RPE differentiated from induced pluripotent stem cells (iPSC) derived from human donors harboring either the low risk (LR) or high risk (HR) CFH genotype. Chronic CSE altered the metabolic profile in both LR and HR iPSC-RPE and caused a dose-dependent reduction in mitochondrial function despite an increase in mitochondrial content. Notably, cells with the HR CFH SNP showed a greater reduction in maximal respiration and ATP production. Significant genotype-dependent changes in the proteome were observed for HR RPE at baseline (cytoskeleton, MAPK signaling) and after CSE exposure, where a less robust upregulation of the antioxidants and significant downregulation in proteins involved in nucleic acid metabolism and membrane trafficking were noted compared to LR cells. In LR cells, uniquely upregulated proteins were involved in lipid metabolism and chemical detoxification. These genotype-dependent differences at baseline and in response to chronic CSE exposure suggest a broader role for CFH in modulating the response to oxidative stress in RPE and provides insight into the interaction between environmental and genetic factors in AMD pathogenesis.

Keywords: Bioinformatics; Cigarette smoke extract; Metabolomics; Proteomics; iPSC-RPE.


Conflict of interest statement

Declaration of competing interest None.

Figures

Figure 1.
Figure 1.. Characterizing cellular changes following chronic CSE treatments.
(A) Cell death was determined from fluorescent images of iPSC-RPE cells stained with Hoechst 33342 (blue) and NucGreen Dead (green) post-CSE treatment. Scale bar=200 μm. (B) Linear regression analysis illustrates the relationship between cell death and CSE treatment in both LR and HR cells. Data are mean ± SD, n=4/genotype. (C) Bright field images of LR and HR cells shows the degree of pigmentation without and with CSE treatment. Scale bar=100 μm. (D) Quantification of cell pigments was performed on cell pellets treated with 100 ug/mL CSE and non-treated controls using ImageJ. The inverted greyscale values, which reflect the pigmentation, were determined from the images of cell pellets. Paired t-test was performed on seven lines including both LR and HR. * p < 0.05. (E) The abundance of melanosome-related proteins (MITF, PMEL, TYRP2, TYRP1, TYRO, GPR143) and RPE markers (RPE65, RGR, RDH5, BEST1) in cells without or with CSE treatment is provided from log2 transformed intensities. Significance was determined by repeated measures two-way ANOVA analysis. C (CSE), G (genotype), C&G (the interaction of genotype and CSE)., ns= not significant, * p<0.05, ** p< 0.01, *** p< 0.001, **** p < 0.0001. Data from individual cell lines are shown.
Figure 2.
Figure 2.. Impact of CSE on Mitochondrial Oxidative Stress and Membrane Potential.
(A) Images of cells co-stained with MitoSox and MitoTracker were used to evaluate levels of mitochondrial reactive oxygen species (ROS). Graph shows mitochondrial ROS calculated from MitoSox intensity normalizing to MitoTracker intensity. n=3~4/phenotype, Significance was determined by repeated measures two-way ANOVA analysis. C (CSE), G (genotype), C&G (the interaction of genotype and CSE)., ns= not significant, **** P <0.0001. (B,C) Superoxide dismutase 2 (SOD2) content was determined from densitometry analyses of SOD2 antibody reaction on Western blots in iPSC-RPE cells treated with CSE. n=4~6, ns= not significant, * P <0.05, ** p < 0.01. (D) Fluorescent images show cells stained with MitoTracker (green), TMRM (red), and Hoechst 33342 (blue) following treatment with CSE. (E) Mitochondrial content and membrane potential were quantified by normalizing MitoTracker and TMRM intensity against the total cell count. Overall Mitochondrial Membrane Potential (MMP) was calculated from the TMRM intensity normalized to the MitoTracker signal. Data = mean ± SD, n=3~4/phenotype, ns= not significant, *** p <0.001, **** p < 0.0001.
Figure 3.
Figure 3.. Assessment of Mitochondrial Content.
(A, B) Immune reactions on Western blots were used to estimate the content of mitochondrial proteins (COX IV, VDAC, TOMM20, OPA1, DRP1) with CSE treatment. Ponceau S-stained blots serving as the loading control (LdgCtrl). (C) Quantitative analysis of Western blots and statistical significance are presented as change in content relative to no treatment for each cell line. Data = mean ± SD, n=4~6/genotype. ns = not significant, * p < 0.05, ** p < 0.01, *** p < 0.001.
Figure 4.
Figure 4.. Response of Mitochondrial Function to Treatment.
(A) During CMST, oligomycin, FCCP, rotenone and antimycin A were added sequentially to cell plates and the traces of oxygen consumption rate are shown for LR and HR cells post-chronic CSE exposure. (B) Graphs show fold change in basal respiration (BR), maximal respiration (MR), ATP production (AP), proton leak (PL), and coupling efficiency (CE) post-CSE treatment relative to no treatment for both genotypes. (C) The Bioenergetic Health Index (BHI) was calculated from the CMST results. Data = mean ± SD, n=6~8/genotype, ns=not significant, * p <0.05, ** p < 0.01, *** p< 0.001, **** p< 0.0001.
Figure 5.
Figure 5.. Altered secretion or consumption of metabolites
(A) Graphic depicts the definition of secreted or consumed metabolites in conditioned media. (B) Repeated measures two-way ANOVA was performed on the targeted metabolomics data to identify metabolites altered by CSE, CFH genotype, or the interaction of the two factors. Venn diagram shows the number of altered media metabolites for each factor. (C) Bar graphs show the relative level of representative metabolites significantly altered with CSE treatment in the conditioned media from LR (left) and HR (right) cells. Metabolites altered by the interaction of genotype and CSE are labeled with red boxes. Metabolites highlighted in yellow are secreted, while those not highlighted are consumed. Data = mean ± SEM, n=4/genotype. *p < 0.05, ** p< 0.01, *** p < 0.001.
Figure 6.
Figure 6.. Proteome profile alterations.
(A) Repeated measures two-way ANOVA was performed on the proteomic data of LR and HR cells treated with CSE to identify proteins altered by CSE, CFH genotype, or the interaction of the two factors. Venn diagram shows the number of altered proteins affected by different factors. (B) Heatmap illustrates normalized abundance of proteins altered by CSE. (C) GSEA analysis, conducted on proteomic datasets, identified the top 10 positively and negatively correlated pathways with CSE concentrations in LR (upper) and HR (bottom) cells, respectively. Pathways unique to each genotype are highlighted in red boxes.
Figure 7.
Figure 7.. Genotype-dependent Differences in Altered Proteins.
(A) Heatmap shows proteins differentially expressed in HR cells compared to LR cells under both CSE-treated and non-treated conditions. (B) Heatmap displays proteins altered by the interaction of CSE and CFH genotype. Pathway analysis of proteins altered by genotype (C) and proteins that were significantly altered by CSE treatment in either HR (D) or LR (E) cells.
Figure 8.
Figure 8.. Genotype-dependent Response to Stress.
(A) Bar plots show the fold change of antioxidants and detoxification proteins in both LR and HR cells post-CSE treatment. n=4 / genotype. (B, C) Western blots and densitometry of antibody reaction provides estimate of GPX1 and catalase content in HR and LR cells. n=4~6 / genotype. (D) Bar plots illustrate the fold change of F120A, F120B and F120C in both LR and HR cells post-CSE treatment. Data in A and D are derived from the global proteomics quantification. Data = mean ± SD, ns=not significant, * p <0.05, ** p < 0.01, *** p< 0.001.

References

    1. Friedman DS, et al. Prevalence of age-related macular degeneration in the United States. Arch Ophthalmol, 2004. 122(4): p. 564–72. - PubMed
    1. Wong WL, et al. Global prevalence of age-related macular degeneration and disease burden projection for 2020 and 2040: a systematic review and meta-analysis. Lancet Glob Health, 2014. 2(2): p. e106–16. - PubMed
    1. Velilla S, et al. Smoking and age-related macular degeneration: review and update. J Ophthalmol, 2013. 2013: p. 895147. - PMC - PubMed
    1. Fritsche LG, et al. A large genome-wide association study of age-related macular degeneration highlights contributions of rare and common variants. Nat Genet, 2016. 48(2): p. 134–43. - PMC - PubMed
    1. Sofat R, et al. Complement factor H genetic variant and age-related macular degeneration: effect size, modifiers and relationship to disease subtype. Int J Epidemiol, 2012. 41(1): p. 250–62. - PMC - PubMed

MeSH terms