. 2025 Mar 14;117(3):qiae242.
doi: 10.1093/jleuko/qiae242.

Piezo1 restrains proinflammatory response but is essential in T-cell-mediated immunopathology

Affiliations

Piezo1 restrains proinflammatory response but is essential in T-cell-mediated immunopathology

Sung Hee Choi et al. J Leukoc Biol. .

Abstract

Piezo1 is a mechanosensitive, nonselective Ca2+ channel that is broadly expressed in CD4+ T cells. Using lineage-specific Piezo1 knockout mice (Piezo1cKO), we show that loss of Piezo1 in CD4+ T cells significantly increased IFNγ and IL-17 production in vitro under TH1 and TH17 polarizing conditions, respectively. Despite their intrinsic proinflammatory phenotype, Piezo1cKO T cells are incapable of establishing disease in vivo in 3 separate adoptive transfer T-cell-mediated inflammatory mouse models, including experimental autoimmune encephalomyelitis, inflammatory bowel disease, and graft-vs-host disease. These phenomena coincided with a decreased effector memory (CD44hiCD62Llo) CD4+ T-cell pool derived from donor Piezo1cKO T cells, an observation related to intrinsic T-cell fitness, as a cotransfer inflammatory bowel disease mouse model revealed a deficiency in the CD4+ effector memory population derived only from the naive Piezo1cKO but a not coinfused Piezo1WT CD4+ T-cell source. Taken together, our results support Piezo1 as restraining proinflammatory T-cell differentiation while contributing to the generation and persistence of the effector memory pool during CD4+ T-cell-mediated immunopathology.

Keywords: CD4+ T cell; EAE; T-cell persistence; colitis; functional polarization; gvHD; mechanosensation; piezo1.


Conflict of interest statement

Conflict of interest statement. None declared.

Figures
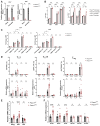
Fig. 1.
Fig. 1.
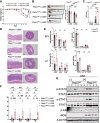
Piezo1 controls the T-cell polarization in vitro. (A) Piezo1 mRNA transcript expression in wild-type mice (Piezo1WT) and CD4-Cre–mediated Piezo1 conditional knockout mice (Piezo1cKO). CD4+ T and CD8+ T cells were isolated from spleen of Piezo1WT and Piezo1cKO mice, and Piezo1 mRNA in naive and anti-CD3/anti-CD28 antibody activated CD4+ and CD8+ T cells was measured by qPCR. (Naive CD4+ T cell, n = 4; activated CD4+ T cell, n = 12; naive CD8+ T cell, n = 3; activated CD8+ T cell, n = 4). (B) Frequency of activation and exhaustion markers of activated CD4+ T cells as in C. (C) Quantification of the calcium flux of CD4+ T cells from Piezo1WT and Piezo1cKO mice. T cells were isolated from spleens of Piezo1WT and Piezo1cKO mice, stimulated with anti-CD3/anti-CD28 antibodies, and stained with Fluo4-AM. Cells were then treated with ionomycin or Yoda1 in the presence or absence of CaCl2 or EGTA, and the resulting calcium flux was measured by flow cytometry (n = 3). (D) Quantification of T cells isolated from Piezo1WT or Piezo1cKO mice was activated under TH1, TH17, and Treg polarizing conditions for 3 d. Cells were then restimulated with PMA/ionomycin for 5 h; stained for intracellular contents of IFNγ, IL-17, and FOXP3; and analyzed by flow cytometry (n = 5 from 2 separate experiments). Transcripts were normalized to the expression of GAPDH, and mRNA from undifferentiated naive T cells (TH0) served as the baseline for gene expression (Ifnγ, n = 4 to 5; Il-17, n = 8 to 10; Foxp3, n = 7 to 11). (E) mRNA expression of IL-17 isoforms under TH17 polarizing condition. Rorγ, Il-23, and Il-10 expression in T cells following 3 d under TH17 polarizing conditions were measured by qPCR. Transcripts were normalized to the expression of GAPDH, and mRNA from T cells of wild-type (Piezo1WT) served as the baseline for gene expression (n = 8 to 12). (F) Transcript expression of TH17 family subsets under TH17 polarizing conditions. CD4+ T cells were isolated from the spleen of Piezo1WT or Piezo1cKO mice and activated with anti-CD3/anti-CD28 antibodies for 3 d under TH17 polarizing conditions. Transcripts were normalized to GAPDH, and mRNA from Piezo1WT T cells served as the baseline for gene expression (n = 3 to 10). Data were analyzed by 2-way analysis of variance with Šídák post hoc test (A, C, E–G), Fisher least significant difference post hoc test (B), or Tukey post hoc test (D). All bar graphs are shown as the mean ± SEM with *P < 0.05, **P < 0.01, ***P < 0.001, and ****P < 0.0001.
Fig. 2.
Fig. 2.
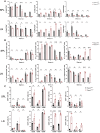
Deletion of Piezo1 enhances a proinflammatory signature in T cells. Purified naive CD4+ T cells of Piezo1cKO and Piezo1WT were activated with anti-CD3/anti-CD28 antibodies for 3 d and (A) RNA sequencing analysis was performed. Hallmark pathways from GSEA revealed a significantly upregulated pathogenic TH17 cell signature, genes upregulated in response to IFNγ, and inflammatory response gene sets in Piezo1cKO CD4+ T cells compared with Piezo1WT (n = 3). (B) Piezo1cKO CD4+ T cells have an increased transcript expression of proinflammatory cytokines compared to Piezo1WT as determined by qPCR. Transcripts were normalized to GAPDH and mRNA from Piezo1WT T cells (n = 4 to 6). (C) IL-17 production in activated CD4+ T cells. CD4+ T cells were isolated from the spleen of Piezo1WT or Piezo1cKO mice and activated with anti-CD3/anti-CD28 antibodies for 3 d in vitro. IL-17 in the media was measured by an enzyme-linked immunosorbent assay (n = 13). (D) Increased TH17 response in Piezo1cKO CD4+ T cells compared to Piezo1WT CD4+ T cells was determined by the TH17 Response RT2 Profiler PCR array. Data were analyzed by 2-way analysis of variance with Šídák post hoc test (B, C). All bar graphs are shown as the mean ± SEM with *P < 0.05, **P < 0.01, ***P < 0.001, and ****P < 0.0001.
Fig. 3.
Fig. 3.
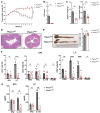
Deletion of Piezo1in T cells accelerates DSS-induced colitis. Chemically induced colitis occurred by introducing 2% DSS in drinking water of mice for 7 d, followed by normal tap water for 3 d. The control group received only normal tap water throughout the experiment. (A) Percent weight loss of Piezo1cKO mice after DSS treatment. Percent weight defined as follows: (final weight – initial weight)/initial weight × 100, n = 8 (Piezo1WT – DSS), 5 (Piezo1cKO − DSS), 14 (Piezo1WT + DSS), and 16 (Piezo1cKO + DSS). (B) The DAI was measured; DAI = weight loss score + stool character score + hematochezia score; score 0 represents no disease symptoms, and score 12 represents the most severe symptoms. n = 8 (Piezo1WT − DSS), 13 (Piezo1cKO − DSS), 4 (Piezo1WT + DSS), and 13 (Piezo1cKO + DSS). (C) Representative photos of colons from mice and quantification of colon length (cm) at day 10. n = 6 (Piezo1WT − DSS), 16 (Piezo1cKO − DSS), 11 (Piezo1WT + DSS), and 20 (Piezo1cKO + DSS). (D) H&E staining of the colon 10 d after DSS treatment. Scale bar = 200 µm. (E) Flow cytometry analysis of T-cell subpopulations in LP and SPL 10 d after DSS treatment (n = 6 to 8). (F) Relative Ifnγ, Tnfα, Il-17, Il-6, and cytokine mRNA expression in LP of Piezo1WT or Piezo1cKO mice with or without DSS treatment (n = 4 to 9). (G) Expression of phospho-STAT3, STAT3, phospho-STAT1, STAT1, phospho-IκB, and inducible nitric oxide synthase in LP was determined by Western blot of colon mucosa from Piezo1WT and Piezo1cKO mice with or without DSS treatment. β-ACTIN was used as the loading control. Data were analyzed by 2-way analysis of variance with Tukey post hoc test (A, B, C, F) and with Šídák post hoc test (E). All bar graphs are shown as mean ± SEM with *P < 0.05, **P < 0.01, ***P < 0.001, and ****P < 0.0001.
Fig. 4.
Fig. 4.
Deletion of Piezo1 in T cells diminishes EAE severity. CD45.1 mice were injected intraperitoneally with 20 million encephalitogenic in vitro restimulated splenocytes from MOG-immunized Piezo1WT or Piezo1cKO mice, as described in the AT-EAE protocol. (A) Flow cytometry analysis of the relative frequency of IFNγ-, IL-17A-, and FOXP3-expressing CD4+ T-cell and naive (TN: CD44CD62L+), effector memory (TEM: CD44+CD62L), and central memory (TCM: CD44+CD62L+) populations of the in vitro stimulated splenocytes with 20 μg MOG35–55 peptide and rmIL-23 (20 ng/mL) for 3 d before adoptive transfer (n = 5). (B) Mean clinical scores showing progression of adoptive transfer EAE in CD45.1 recipients injected with indicated donor cells (n = 10). (C) Severity of EAE calculated as area under the curve (AUC) of the clinical score (n = 10). (D) Representative H&E and Fast Blue staining of the spinal cords at 12 DPI. Scale bar = 1 mm (n = 3). (E) Representative immunohistochemistry staining and quantification of CD3+ cells found in the spinal cord at 20 DPI. Scale bar = 100 µm (n = 5).
Fig. 5.
Fig. 5.
Deletion of Piezo1 in T cells diminishes TEM cells in EAE. CD45.1 mice were injected intraperitoneally with 20 million encephalitogenic in vitro restimulated splenocytes from MOG-immunized Piezo1WT or Piezo1cKO mice, as described in the AT-EAE protocol. (A) Flow cytometry analysis of the relative frequency and ratio of CD4- and CD8-expressing donor (CD45.2+) cells from the SPL and draining LN at 3, 5, 7, 12, and 16 DPI (n = 3). (B) Flow cytometry analysis of the relative frequency of CD4+ T-cell naive (TN: CD44CD62L+), effector memory (TEM: CD44+CD62L), and central memory (TCM: CD44+CD62L+) populations from the SPL and draining LN at 3, 5, 7, 12, and 16 DPI (n = 3). (C) Flow cytometry analysis of the relative frequency of CD4+ T cells expressing key cytokines (IFNγ, IL-17A, and FOXP3), activation markers (CD25, CD69, and CD95), chemokines (CCR5 and CCR7), and exhaustion markers (TIGIT, LAG-3, and PD-1) from the SPL and draining LN at 3, 5, 7, 12, and 16 DPI (n = 3). Data were analyzed by 2-way analysis of variance with Tukey post hoc test (a–g). All bar graphs are shown as mean ± SEM with *P < 0.05, **P < 0.01, ***P < 0.001, and ****P < 0.0001.
Fig. 6.
Fig. 6.
Deletion of Piezo1 in T cells diminishes GvHD severity. BALB/c host mice after transfer of allogenic T cells from Piezo1WT or Piezo1cKO donor mice. BALB/c mice were irradiated twice with 4 Gy and transplanted with 5 × 10⁶ allogenic C57BL/6 Piezo1WT bone marrow (BM) or Piezo1cKO BM cells together with 1 × 10⁶ allogenic CD4+ T cells from Piezo1WT or Piezo1cKO mice. (A) Survival, (B) weight loss, and (C) clinical scores of GvHD pathology (0 to 10) after transfer of allogenic T cells from Piezo1WT or Piezo1cKO donor mice. BALB/c T-cell and BM transfer were used as control (n = 7). (D) Total number of CD4+H2-Kb+ or CD8+H2-Kb+ cells in spleen 27 d after allogenic transfer of Piezo1WT or Piezo1cKO T cells. (E) Flow cytometry analysis of the relative frequency of CD4+ and CD8+ T-cell naive (TN: CD44CD62L+), effector memory (TEM: CD44+CD62L), and central memory (TCM: CD44+CD62L+) populations at 27 DPI. (F) Representative H&E-stained microsections of the liver, lung, and skin of BALB/c host mice 27 d after allogenic transfer of Piezo1WT or Piezo1cKO T cells. Scale bar = 200 µm. Data were analyzed by 2-way analysis of variance with Tukey post hoc test (A–F). All bar graphs are shown as mean ± SEM with *P < 0.05, **P < 0.01, ***P < 0.001, and ****P < 0.0001.
Fig. 7.
Fig. 7.
Deletion of Piezo1 in T cells fails to induce colitis after adoptive transfer. Rag1−/− mice were transferred with naive CD4+CD45Rbhi T cells from Piezo1WT or Piezo1cKO mice. (A) Weight loss curves as a percentage of original body weight. n = 6 (Piezo1WT), n = 10 (Piezo1cKO). (B) The DAI was measured; DAI =weight loss score + stool character score + hematochezia score; score 0 represents no disease symptoms, and score 12 represents the most severe symptoms (n = 10). (C) Spleen (n = 4 Piezo1WT, n = 5 Piezo1cKO) and colon (n = 8 Piezo1WT, n = 10 Piezo1cKO) weight (g) was measured at 13 WPI from mice described in A. (D) Representative H&E staining of the colon sections as shown in A. Scale bar = 200 µm. (E) Representative photos and quantification of the length of colon samples from mice described in A. (F) Flow cytometry analysis of CD4+ T cells isolated from spleen and LP of Rag1−/− mice 13 WPI of Piezo1WT or Piezo1cKO naive T cells and stimulated ex vivo with PMA and ionomycin for 6 h (n = 6 to 8). (G) CD4+ T cells isolated from spleen and LP of Rag1−/− mice 13 WPI of Piezo1WT or Piezo1cKO naive T cells and stimulated ex vivo with PMA and ionomycin for 48 h. IFNγ and IL-17A expression was determined by an enzyme-linked immunosorbent assay (n = 3 to 5). Data were analyzed by 2-way analysis of variance with Šídák post hoc test (A) and Tukey post hoc test (B–G). All bar graphs are shown as mean ± SEM with *P < 0.05, **P < 0.01, ***P < 0.001, and ****P < 0.0001.
Fig. 8.
Fig. 8.
Deletion of Piezo1 in T cells diminishes TEM cells in adoptive transfer-induced colitis. Rag1−/− mice were adoptively cotransferred with naive CD4+ T cells isolated from Piezo1WT mice (CD45.1) and Piezo1cKO mice (CD45.2) at a ratio of 1:1 (5×10⁵:5×10⁵). Recipients were sacrificed 2, 4, or 13 wk after transfer (n = 3 to 4). (A) The number of C57BL/6 CD4+ T cells (CD45.1+) and Piezo1cKO CD4+ T cells (CD45.2+) in the SPL, mLN, and colon (LP) at 2, 4, and 13 wk postinjection as analyzed by flow cytometry. (B) Flow cytometry analysis of the number of CD4+ T-cell naive (TN: CD44CD62L+), effector memory (TEM: CD44+CD62L), and central memory (TCM: CD44+CD62L+) populations from the SPL, mLN, and LP at 2, 4, and 13 wk postinjection. (C) Top: the frequency of CD4+ and CD8+ populations in the spleen of 2-yr-old Piezo1WT or Piezo1cKO mice. Bottom: the frequency of effector memory (TEM: CD4+CD44+CD62L), central memory (TCM: CD4+CD44+CD62L+), and naive cells (TN: CD4+CD44CD62L+) in spleens of 2-yr-old Piezo1WT or Piezo1cKO mice (n = 4). Data were analyzed by 2-way analysis of variance with Tukey post hoc test (A–C). All bar graphs are shown as mean ± SEM with *P < 0.05, **P < 0.01, ***P < 0.001, and ****P < 0.0001.

References

    1. Chen Y, Ju L, Rushdi M, Ge C, Zhu C. Receptor-mediated cell mechanosensing. Mol Biol Cell. 2017:28(23):3134–3155. 10.1091/mbc.E17-04-0228 - DOI - PMC - PubMed
    1. Ingber DE. Cellular mechanotransduction: putting all the pieces together again. FASEB J. 2006:20(7):811–827. 10.1096/fj.05-5424rev - DOI - PubMed
    1. Zhu C, Chen W, Lou J, Rittase W, Li K. Mechanosensing through immunoreceptors. Nat Immunol. 2019:20(10):1269–1278. 10.1038/s41590-019-0491-1 - DOI - PMC - PubMed
    1. Du H, Bartleson JM, Butenko S, Alonso V, Liu WF, Winer DA, Butte MJ. Tuning immunity through tissue mechanotransduction. Nat Rev Immunol. 2023:23(3):174–188. 10.1038/s41577-022-00761-w - DOI - PMC - PubMed
    1. Rushdi M, Li K, Yuan Z, Travaglino S, Grakoui A, Zhu C. Mechanotransduction in T cell development, differentiation and function. Cells. 2020:9(2):364. 10.3390/cells9020364 - DOI - PMC - PubMed

MeSH terms