. 2024 Nov 27;44(11):BSR20240595.
doi: 10.1042/BSR20240595.

Causal effects of gut microbiota on gout and hyperuricemia: insights from genome-wide Mendelian randomization, RNA-sequencing, 16S rRNA sequencing, and metabolomes

Affiliations

Causal effects of gut microbiota on gout and hyperuricemia: insights from genome-wide Mendelian randomization, RNA-sequencing, 16S rRNA sequencing, and metabolomes

Xia Liu et al. Biosci Rep. .

Abstract

Background: This study investigated the causal relationship between gut microbiota (GM), serum metabolome, and host transcriptome in the development of gout and hyperuricemia (HUA) using genome-wide association studies (GWAS) data and HUA mouse model experiments.

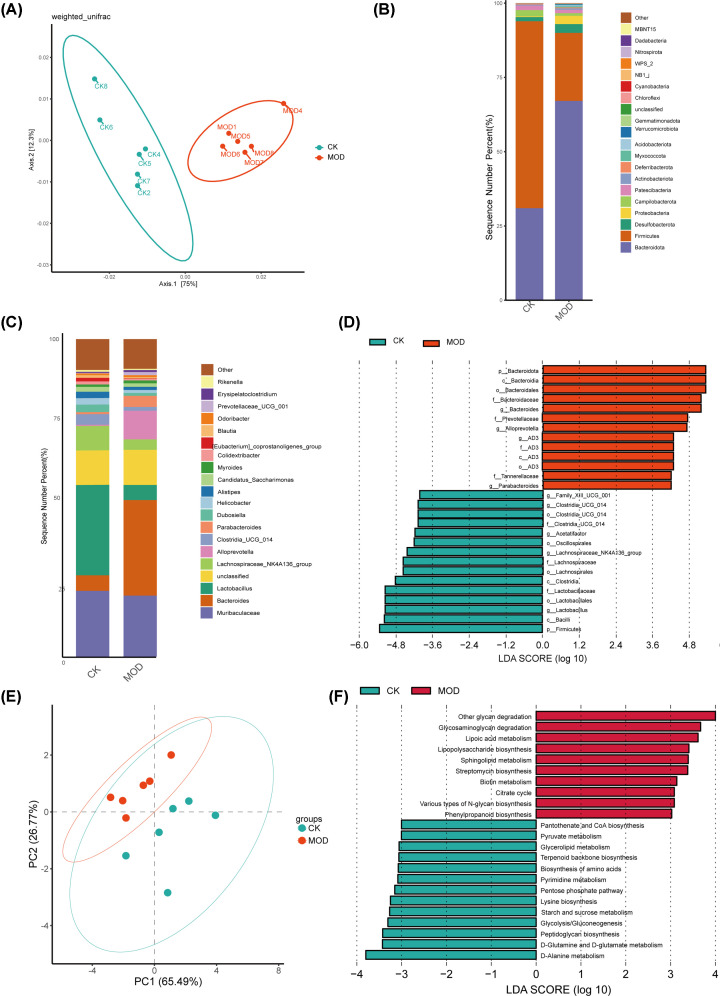
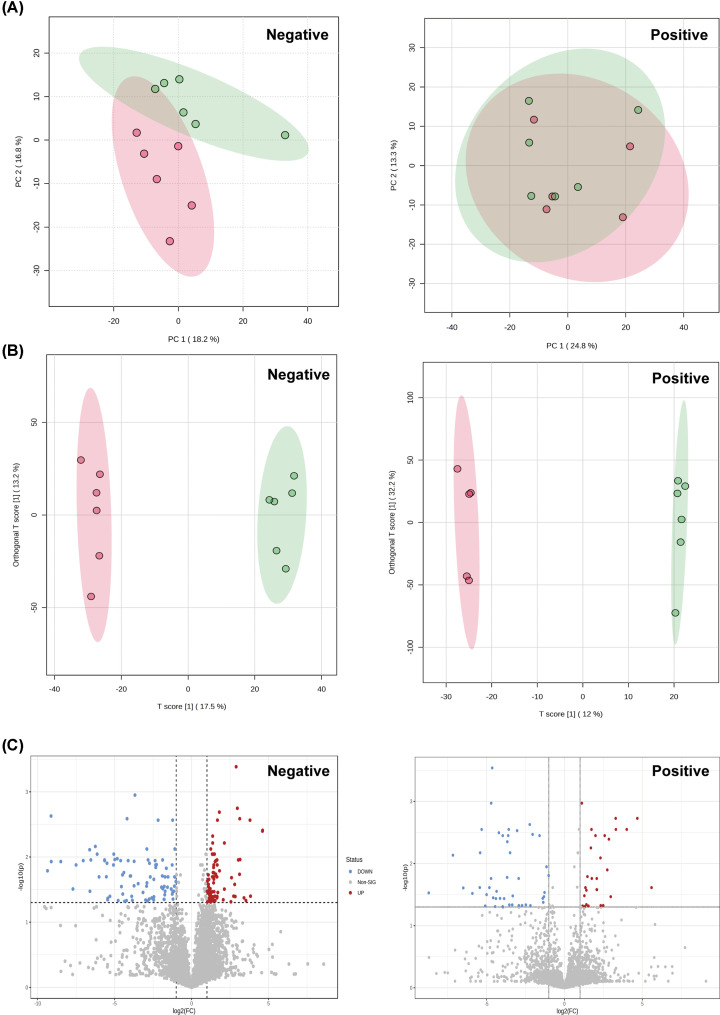
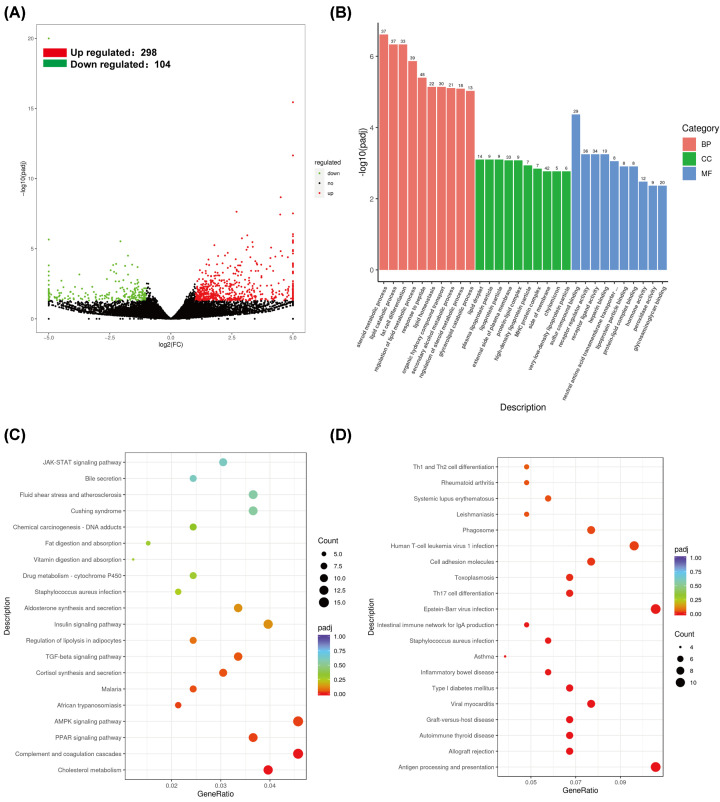
Methods: Mendelian randomization (MR) analysis of GWAS summary statistics was performed using an inverse variance weighted (IVW) approach to determine or predict the causal role of the GM on gout. The HUA mouse model was used to characterize changes in the gut microbiome, host metabolome, and host kidney transcriptome by integrating cecal 16S rRNA sequencing, untargeted serum metabolomics, and host mRNA sequencing.

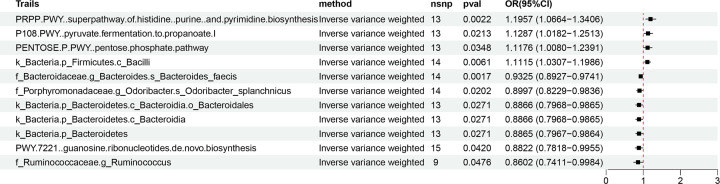
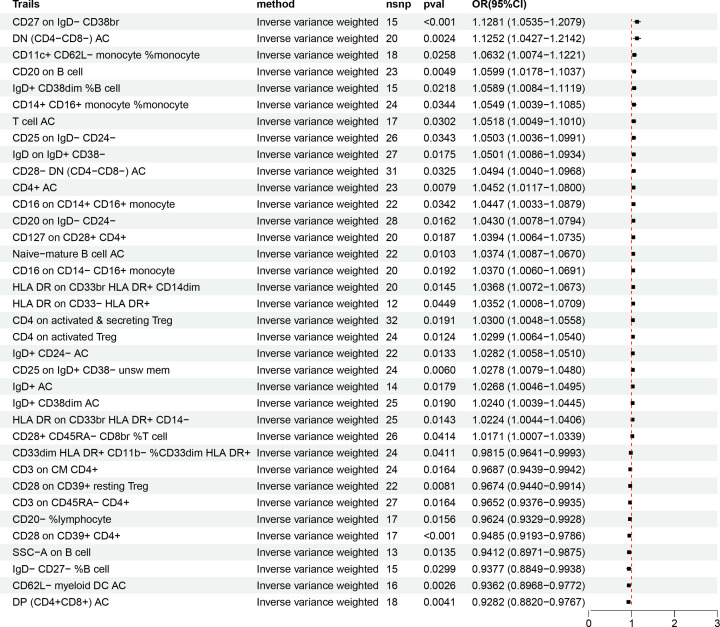
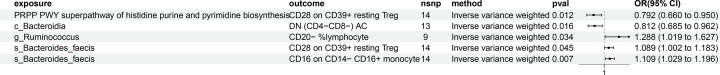
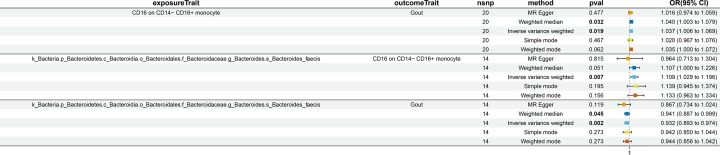
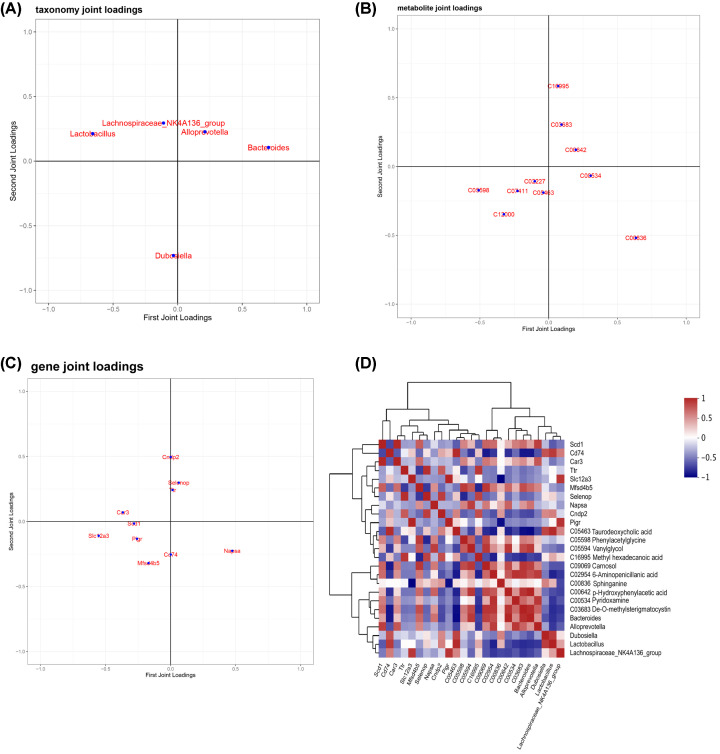
Results: Our analysis demonstrated causal effects of seven GM taxa on gout, including genera of Ruminococcus, Odoribacter, and Bacteroides. Thirty eight immune cell traits were associated with gout. Dysbiosis of Dubosiella, Lactobacillus, Bacteroides, Alloprevotella, and Lachnospiraceae_NK4A136_group genera were associated with changes in the serum metabolites and kidney transcriptome of the HUA model mice. The changes in the gut microbiome of the HUA model mice correlated significantly with alterations in the levels of serum metabolites such as taurodeoxycholic acid, phenylacetylglycine, vanylglycol, methyl hexadecanoic acid, carnosol, 6-aminopenicillanic acid, sphinganine, p-hydroxyphenylacetic acid, pyridoxamine, and de-o-methylsterigmatocystin, and expression of kidney genes such as CNDP2, SELENOP, TTR, CAR3, SLC12A3, SCD1, PIGR, CD74, MFSD4B5, and NAPSA.

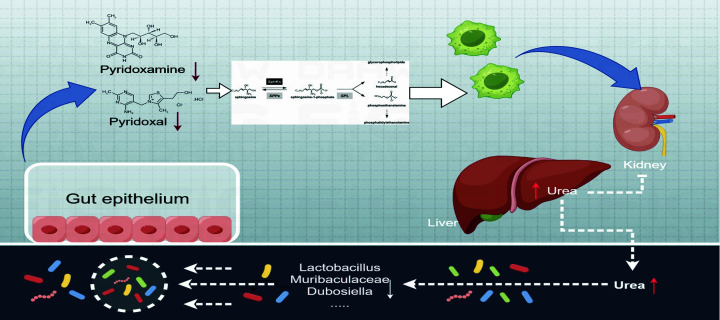
Conclusion: Our study demonstrated a causal relationship between GM, immune cells, and gout. HUA development involved alterations in the vitamin B6 metabolism because of GM dysbiosis that resulted in altered pyridoxamine and pyridoxal levels, dysregulated sphingolipid metabolism, and excessive inflammation.

Keywords: Gout; Hyperuricemia; Mendelian randomization; gut microbiota; multi-omics.


Conflict of interest statement

The authors declare that there are no competing interests associated with the manuscript.

Figures

Figure 1
Figure 1. Mendelian randomization analysis shows significant association of 11 gut bacterial genera and metabolic pathways with gout
CI: confidence interval; MR: Mendelian randomization; nsnp: single nucleotide polymorphism; OR: odds ratio.
Figure 2
Figure 2. MR analysis shows causal relationships between immune cell traits and gout. As shown, 10 immune cell traits show protective effects against gout (OR<1) and 26 immune cell traits are associated with increased risk of gout (OR>1).
CI: confidence interval; MR: Mendelian randomization; nsnp: single nucleotide polymorphism; OR: odds ratio.
Figure 3
Figure 3. MR analysis shows significantly high association between four bacterial genera and five immune cell traits
CI: confidence interval; MR: Mendelian randomization; nsnp: single nucleotide polymorphism; OR: odds ratio.
Figure 4
Figure 4. Reverse MR analysis results show the causal role of gout on Species-Bacteroides_faecis and CD16 on CD14− CD16+ monocytes, as well as, CD16 on CD14− CD16+ monocytes on Species-Bacteroides_faecis
CI: confidence interval; MR: Mendelian randomization; nsnp: single nucleotide polymorphism; OR: odds ratio.
Figure 5
Figure 5. Hyperuricemia induction causes taxonomic and functional dysbiosis in the colon microbiome
(A) PCoA analysis plot shows gut microbial beta diversity in the control (blue dots; CK) and HUA model (red dots; MOD) groups. Each dot represents an individual mouse. (B) The distribution plot shows relative abundance of gut bacteria at the phylum level in the control (CK) and HUA model (MOD) groups. (C) The distribution plot shows relative abundance of bacteria at the genus level in the control (CK) and HUA model (MOD) groups. (D) LefSe analysis results show differentially abundant gut bacterial taxa between the control (CK) and HUA model (MOD) groups. (E) PCoA analysis shows relative differences in the functional signatures between the gut microbiomes in the control and HUA model mice. Each dot represents an individual mouse. (F) Overview of KEGG metabolic pathway profiles in the gut microbiomes of the control and HUA model groups of mice. The relative abundances in (B–D) and (F) were calculated based on the mean values from six mice per group. CK: control group; MOD: HUA model group.
Figure 6
Figure 6. Serum metabolite changes in the hyperuricemia model group
(A) PCA score plots of the control (red dots; CK) and HUA model (green dots; MOD) groups in the positive and negative ion modes. (B) OPLS-DA score plots of the control (red dots; CK) and HUA model (green dots; MOD) groups in the positive and negative ion modes. (C) Volcano plot shows the most significant and differentially expressed metabolites (red and blue dots, MOD vs. CK), as identified by the univariate analysis. CK: control group; MOD: HUA model group.
Figure 7
Figure 7. Global overview of the kidney transcriptome changes in the hyperuricemia model mice
(A) Volcano plot shows differential expressed genes (DEGs) between the HUA model group and the control group with Log2 (Fold change) >2 and P<0.05 as threshold parameters. (B) GO annotation enrichment analysis of the DEGs, performed using clusterProfiler 3.8.1. (C,D) KEGG pathway enrichment analysis of 298 up-regulated and 104 down-regulated DEGs, conducted using clusterProfiler 3.8.1.
Figure 8
Figure 8. Microbiota–metabolite–transcriptome relationships
(A) O2PLS-DA load diagram of the GM (B) O2PLS-DA load diagram of the serum metabolites. (C) O2PLS-DA load diagram of the differentially expressed genes. (D) Spearman correlation analysis of key GM, serum metabolites, and differentially expressed genes.
Figure 9
Figure 9. Regulatory role of gut microbiota in hyperuricemia by modulating vitamin B6 metabolism and sphingolipid-driven inflammation
As shown, reduced abundance of GM genera such as Lactobacillus, Muribaculaceae, and Dubosiella altered the pH and led to the production of HUA-inducing metabolites and decreased the levels of pyridoxamine and pyridoxal. The reduction of pyridoxamine and pyridoxal down-regulated sphingosine 1-phosphate lyase activity and decreased the accumulation of sphingosine 1-phosphate. Dysregulation of vitamin B6 metabolism and sphingolipid metabolism promotes inflammation. Excessive levels of inflammatory cytokines in the body cause elevated levels of uric acid.

Similar articles

References

    1. Peng A., Lin L., Zhao M. and Sun B. (2019) Identifying mechanisms underlying the amelioration effect of Chrysanthemum morifolium Ramat. ‘Boju’ extract on hyperuricemia using biochemical characterization and UPLC-ESI-QTOF/MS-based metabolomics. Food Funct. 10, 8042–8055 10.1039/C9FO01821B - DOI - PubMed
    1. Perez-Ruiz F. and Dalbeth N. (2019) Gout. Rheum. Dis. Clin. North Am. 45, 583–591 10.1016/j.rdc.2019.08.001 - DOI - PubMed
    1. Dehlin M., Jacobsson L. and Roddy E. (2020) Global epidemiology of gout: Prevalence, incidence, treatment patterns and risk factors. Nat. Rev. Rheumatol. 16, 380–390 10.1038/s41584-020-0441-1 - DOI - PubMed
    1. Wang X. and Wang Y.G. (2020) Progress in treatment of gout using Chinese and Western medicine. Chin. J. Integr. Med. 26, 8–13 10.1007/s11655-019-3058-y - DOI - PubMed
    1. Lang S., Hilsabeck T.A., Wilson K.A., Sharma A., Bose N., Brackman D.J.et al. . (2019) A conserved role of the insulin-like signaling pathway in diet-dependent uric acid pathologies in Drosophila melanogaster. PLos Genet. 15, e1008318 10.1371/journal.pgen.1008318 - DOI - PMC - PubMed

Publication types

MeSH terms

Substances