. 2024 Nov 3;5(11):e783.
doi: 10.1002/mco2.783. eCollection 2024 Nov.

An inflammatory cytokine signature predicts IgA nephropathy severity and progression

Affiliations

An inflammatory cytokine signature predicts IgA nephropathy severity and progression

Lei Chen et al. MedComm (2020). .

Abstract

IgA nephropathy (IgAN) is the most prevalent primary glomerulonephritis, resulting in end-stage renal disease and increased mortality rates. Prognostic biomarkers reflecting molecular mechanisms for effective IgAN management are urgently needed. Analysis of kidney single-cell transcriptomic sequencing data demonstrated that IgAN expressed high-expression levels of inflammatory cytokines TNFSF10, TNFSF12, CCL2, CXCL1, and CXCL12 than healthy controls (HCs). We also measured the urine proteins in 120 IgAN (57 stable and 63 progressive) and 32 HCs using the proximity extension assay (PEA), and the multivariable and least absolute shrinkage and selection operator (LASSO) logistic regression analysis both revealed that CXCL12, MCP1 were the prognostic significant variables to predict IgAN progression severity. These two proteins exhibited negative correlation with the estimated glomerular filtration rate (eGFR) and patients with higher expression levels of these two proteins had a higher probability to have poorer renal outcome. We further developed a risk index model utilizing CXCL12, MCP1, and baseline clinical indicators, which achieved an impressive area under the curve (AUC) of 0.896 for prediction of IgAN progression severity. Our study highlights the significance of the inflammatory protein biomarkers for noninvasive prediction of IgAN severity and progression, offering valuable insights for clinical management.

Keywords: IgA nephropathy; Olink Proteomics; prognosis biomarkers; single‐cell sequencing.


Conflict of interest statement

The authors declare no conflicts of interest.

Figures
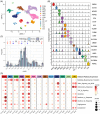
FIGURE 1
FIGURE 1
Comprehensive scRNA‐seq survey of the kidney ecosystem of IgA nephropathy (IgAN) and healthy control. (A) The cell identification from the scRNA‐seq survey of four IgAN samples and six control samples. (B) Violin plots showing the expression of representative marker genes of 13 distinct cell types. (C) The cell proportion of each cell type in distinct pathology samples. p values were assessed by Student's t‐test. (D) The expression level of hallmark inflammatory and fibrosis pathways in each cell type in distinct sample pathology.
FIGURE 2
FIGURE 2
Comprehensive scRNA‐seq survey reveals the cell‐type‐specific signature expression difference in IgA nephropathy (IgAN) and healthy control (HC). (A) Gene ranking plot showing the upregulated expression of genes of endothelial cell of IgAN and health control. (B) Gene ranking plot showing the upregulated expression of genes of Mes cell of IgAN and health control. (C) Gene ranking plot showing the upregulated expression of genes of iTEC cell of IgAN and health control. (D) Dotplot showing the upregulated expression of genes of each cell type of IgAN and health control.
FIGURE 3
FIGURE 3
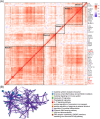
Identification of IgA nephropathy (IgAN)‐associated urine hub proteins. (A) The pairwise correlations among urine proteins in IgAN patients. Each row and column represent one of the 180 IgAN‐associated urine proteins. Red and blue squares indicate positive and negative correlations between protein pairs, respectively. Black squares denote the five protein modules based on hierarchical clustering, and numbers in brackets on the right indicate the cluster number. (B) Enrichment of the Gene Ontology (GO) terms in the proteins pair associated with module 5.
FIGURE 4
FIGURE 4
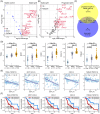
Identification of IgA nephropathy (IgAN) progression‐associated urine proteins. (A) Volcano plot showing the differentially expressed urine proteins between stable IgAN and healthy control (HC). The red dots indicate urine proteins in stable IgAN patients were upregulated compared to HC. (B) Volcano plot showing the differentially expressed urine proteins between stable IgAN and progressive IgAN. The red dots indicate urine proteins in progression IgAN patients were upregulated compared to stable IgAN. (C) Venn diagram showing the intersection proteins upregulated both in two compare groups (stable IgAN vs. HC, and progressive IgAN vs. stable IgAN). (D) Beeswarm showing the expression of CXCL1, CXCL12, TWEAK, TRAIL, and MCP1 in HC, stable, and progressive IgAN. (E) The scatterplot showing the correlations of the urine proteins CXCL1, CXCL12, TWEAK, TRAIL, and MCP1 with the follow‐up eGFR value. (F) The Kaplan–Meier renal survival curves of patients with IgAN according to the urine proteins CXCL1, CXCL12, TWEAK, TRAIL, and MCP1.
FIGURE 5
FIGURE 5
The diagnostic power for prediction of IgA nephropathy (IgAN) progression using the cytokines biomarkers classifier and clinical indicators. (A) The diagnostic power of base model (24 h urine protein expression [24‐h UPE] value, age, sex, estimated glomerular filtration rate [eGFR], Oxford classification MEST lesion, and extracapillary proliferation [Ep] lesion), base model + CXCL12, base model + MCP1, and base model + CXCL12 + MCP1 for the prediction of IgAN progression. (B) The Kaplan–Meier renal survival curves of patients with IgAN according to the risk index model (combination of clinical indicators, MCP1 and CXCL12) score.

References

    1. Cai GY, Chen XM. Immunoglobulin A nephropathy in China: progress and challenges. Am J Nephrol. 2009;30(3):268‐273. - PubMed
    1. Roberts ISD. Pathology of IgA nephropathy. Nat Rev Nephrol. 2014;10(8):445‐454. - PubMed
    1. Barratt J, Tang SCW. Treatment of IgA nephropathy: evolution over half a century. Semin Nephrol. 2018;38(5):531‐540. - PubMed
    1. Zheng Y, Lu P, Deng Y, et al. Single‐cell transcriptomics reveal immune mechanisms of the onset and progression of IgA nephropathy. Cell Rep. 2020;33(12):108525. - PubMed
    1. Tamouza H, Chemouny JM, Raskova Kafkova L, et al. The IgA1 immune complex‐mediated activation of the MAPK/ERK kinase pathway in mesangial cells is associated with glomerular damage in IgA nephropathy. Kidney Int. 2012;82(12):1284‐1296. - PMC - PubMed

LinkOut - more resources