. 2024 Nov 3;5(11):e754.
doi: 10.1002/mco2.754. eCollection 2024 Nov.

Single-cell transcriptomics reveals IRF7 regulation of the tumor microenvironment in isocitrate dehydrogenase wild-type glioma

Affiliations

Single-cell transcriptomics reveals IRF7 regulation of the tumor microenvironment in isocitrate dehydrogenase wild-type glioma

Jinwei Li et al. MedComm (2020). .

Abstract

Mutations in isocitrate dehydrogenase (IDH) are important markers of glioma prognosis. However, few studies have examined the gene expression regulatory network (GRN) in IDH-mutant and wild-type gliomas. In this study, single-cell RNA sequencing and spatial transcriptome sequencing were used to analyze the GRN of cell subsets in patients with IDH-mutant and wild-type gliomas. Through gene transcriptional regulation analysis, we identified the M4 module, whose transcription factor activity is highly expressed in IDH wild-type gliomas compared to IDH-mutants. Enrichment analysis revealed that these genes were predominantly expressed in microglia and macrophages, with significant enrichment in interferon-related signaling pathways. Interferon regulatory factor 7 (IRF7), a transcription factor within this pathway, showed the highest percentage of enrichment and was primarily localized in the core region of wild-type IDH tumors. A machine-learning prognostic model identified novel subgroups within the wild-type IDH population. Additionally, IRF7 was shown to promote the proliferation and migration of T98G and U251 cells in vitro, and its knockdown affected glioma cell proliferation in vivo. This study systematically established the regulatory mechanism of IDH transcriptional activity in gliomas at the single-cell level and drew a corresponding cell map. The study presents a transcriptional regulatory activity map for IDH wild-type gliomas, involving single-cell RNA sequencing and spatial transcriptomics to identify gene regulatory networks, machine learning models for IDH subtyping, and experimental validation, highlighting the role of IRF7 in glioma progression.

Keywords: gene transcription regulation; glioma; interferon regulatory factor 7; isocitrate dehydrogenase 1; multi‐omics.


Conflict of interest statement

The authors declare that they have no conflicts of interest.

Figures

FIGURE 1
FIGURE 1
Research design roadmap.
FIGURE 2
FIGURE 2
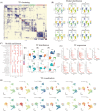
The tumor microenvironment of isocitrate dehydrogenase (IDH) wild‐type and mutant glioma tumor tissues. (A) Quality control process. (B) Heatmap showed cell subsets annotated marker. (C) Uniform Manifold Approximation and Projection (UMAP) showed the distribution of IDH‐mutant and wild‐type cell subpopulations. (D) Cell ratio histogram showed the proportion of cell subpopulations. (E) UMAP showed the differentiation of cell subpopulations in terms of stemness. (F) Bar graph showed the stemness score of cell subpopulations. (G) Scatter plot showed the signaling pathways enriched by IDH‐mutant and wild‐type gene set enrichment analysis (GSEA). (H) The circular network diagram showed the weight and number of interactions between cell subsets. (I) The circular network map showed the number of microglia and macrophages communicating with other cells. (J) The heatmap showed the input and output signal pathways of cell subsets.
FIGURE 3
FIGURE 3
Isocitrate dehydrogenase (IDH) wild‐type and IDH‐mutant glioma transcription factor regulatory network. (A) Heatmap showed transcription factor clustering to identify highly transcriptionally active modules. (B) Uniform Manifold Approximation and Projection (UMAP) showed the distribution of transcription factor modules in IDH‐mutant and wild‐type. (C) The scatter plot showed the signal pathway of Modul enrichment. (D) UMAP showed the distribution of glioma gene subsets and groups. (E) UMAP showed the distribution of cell subsets and groups of transcription factor activity in glioma cells. (F) After disturbing four Modul group transcription factors, the subsets and groups of glioma cells with transcription factor activity were distributed. (G) The expression of transcription factors in different modules. (H) UMAP showed highly expressed transcription factors in the module.
FIGURE 4
FIGURE 4
Single‐cell sequencing explored interferon regulatory factor 7 (IRF7) and IRF7 regulon expression in glioma tumors and blood. (A) Uniform Manifold Approximation and Projection (UMAP) demonstrates the distribution of IRF7 expression in isocitrate dehydrogenase (IDH) wild‐type and IDH‐mutant tumor tissues. (B) Box plots show the cellular subpopulation expression of IRF7 in IDH wild‐type and IDH‐mutant tumor tissues. (C) Enrichment analysis showed differential gene signal pathways between IRF7+ microglia and IRF7‒ microglia, and differential gene signal pathways between IRF7+ macrophages and IRF7‒ macrophages. (D) The monocle2 showed the pseudo‐sequential distribution of microglia subsets. (E) Pseudo‐sequential analysis showed the differentiation of IRF7 in microglia. (F) Procedure of single‐cell sequencing analysis of glioma IDH‐mutant and wild‐type blood. (G) The circle diagram showed the distribution of cell subsets. (H and I) UMAP showed the distribution of cell subsets in the blood microenvironment of IDH‐mutant and IDH wild‐type. (J) Scatter plot showed IDH mutation and wild‐type blood enrichment signal pathway. (K and L) The box diagram showed the expression of IRF7 regulon and IRF7 in cell subsets. * p < 0.05, ** p < 0.01, *** p < 0.001.
FIGURE 5
FIGURE 5
Single‐cell spatial transcriptome sequencing analysis of the spatial localization of interferon regulatory factor 7 (IRF7) regulon and IRF7. (A‒C) Spatial localization maps showing the spatial localization of key genes and malignant cell tumor content in isocitrate dehydrogenase (IDH) wild‐type gliomas, secondary glioblastomas, and paraneoplastic tissues. (D) Uniform Manifold Approximation and Projection (UMAP) and spatial localization maps showed the distribution of the IDH wild‐type subpopulation. (E) Scatterplot demonstrating metabolic signaling in IDH wild‐type subset pathways.
FIGURE 6
FIGURE 6
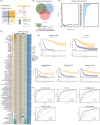
Machine learning to construct the prognosis model of glioma. (A) Prognostic model screening process roadmap. (B) The Wayne diagram showed the prognostic model input gene set screening. (C) The heatmap showed a variety of machine learning to screen the optimal prognosis model. (D) The gene screening process by random survival forests. (E) Kaplan‐Meier (KM) prognostic analysis showed the prognosis of high‐ and low‐risk groups in multiple cohorts. (F) The receiver operating characteristic (ROC) curve showed the area under the curve (AUC) values of the prediction model in different cohorts of 1, 2, 3, 4, and 5 years.
FIGURE 7
FIGURE 7
The biological significance of model patients in high‐ and low‐risk groups. (A) The heatmap showed the relationship between high‐ and low‐risk groups, clinical features, and immune cell infiltration. (B) The histogram showed glioma variant classification, variant type, Single‐nucleotide variant (SNV) class, variants per sample, variant classification summary, and top 10 mutated genes. (C) The heatmap showed gene mutations in high‐ and low‐risk groups. (D) The heatmap showed the copy number alterations score of patients in high‐ and low‐risk groups. (E) The histogram showed the signal pathway enrichment analysis of differential genes in high‐ and low‐risk groups. (F and G) The box chart showed 13 cell death scores and immune function scores of patients in high‐ and low‐risk groups. (H) The violin picture showed the ESTIMATE score, immune score, and stromal score of the high‐ and low‐risk groups. (I) Prognostic KM was used to analyze the prognosis of the high‐ and low‐risk groups in the imvigor210 immunotherapy cohort. (J) Top five small molecule drugs likely to act on patients in high‐risk groups. * p < 0.05, ** p < 0.01, *** p < 0.001.
FIGURE 8
FIGURE 8
IRF7 promotes T98G and U251 cell viability and migration. T98G and U251 were transfected with IRF7‐siRNA and negative control (NC), respectively. (A) Cell viability was measured by the CCK‐8 assay in T98G and U251, separately. (B) Cell migration was measured by the wound healing assay in T98G and U251, separately. (C) Cell cycle was measured by the flow cytometry assay in T98G and U251, separately. Each experiment was repeated three times with similar results. (D) Confocal (IF microscopy indicated strong IRF7 immunofluorescent staining in IDH‐wild glioma tissues by merging DAPI and IBA‐1, which is a marker of activated microglia and inflammation. (E) Representative images of subcutaneous tumors formed by sh‐NC and sh‐IRF7 glioma cells. Tumor volume and weights measurements after excision, presented as mean ± SEM, showing significant differences using Student's t‐test. (F) Representative hematoxylin and eosin (HE) staining images showing the histological features of the tumors. Representative Ki‐67 immunohistochemical staining images indicating the proliferative activity in the tumors. Quantification of Ki‐67‐positive cells is presented as mean ± SEM. * p < 0.05, ** p < 0.01, *** p < 0.001.

References

    1. Diplas BH, Liu H, Yang R, et al. Sensitive and rapid detection of TERT promoter and IDH mutations in diffuse gliomas. Neuro Oncol. 2019;21(4):440‐450. - PMC - PubMed
    1. Louis DN, Perry A, Reifenberger G, et al. The 2016 World Health Organization classification of tumors of the central nervous system: a summary. Acta Neuropathol. 2016;131(6):803‐820. - PubMed
    1. Louis DN, Perry A, Wesseling P, et al. The 2021 WHO classification of tumors of the central nervous system: a summary. Neuro‐oncology. 2021;23(8):1231‐1251. - PMC - PubMed
    1. Miller JJ, Gonzalez Castro LN, McBrayer S, et al. Isocitrate dehydrogenase (IDH) mutant gliomas: a Society for Neuro‐Oncology (SNO) consensus review on diagnosis, management, and future directions. Neuro‐oncology. 2023;25(1):4‐25. - PMC - PubMed
    1. Vargas López AJ. Glioblastoma in adults: a Society for Neuro‐Oncology (SNO) and European Society of Neuro‐Oncology (EANO) consensus review on current management and future directions. Neuro‐oncology. 2021;23(3):502‐503. - PMC - PubMed

LinkOut - more resources