

The abundance and localization of environmental microplastics in gastrointestinal tract and muscle of Atlantic killifish (Fundulus heteroclitus): a pilot study
- PMID: 39493281
- PMCID: PMC11527914
- DOI: 10.1186/s43591-024-00101-w
The abundance and localization of environmental microplastics in gastrointestinal tract and muscle of Atlantic killifish (Fundulus heteroclitus): a pilot study
Abstract
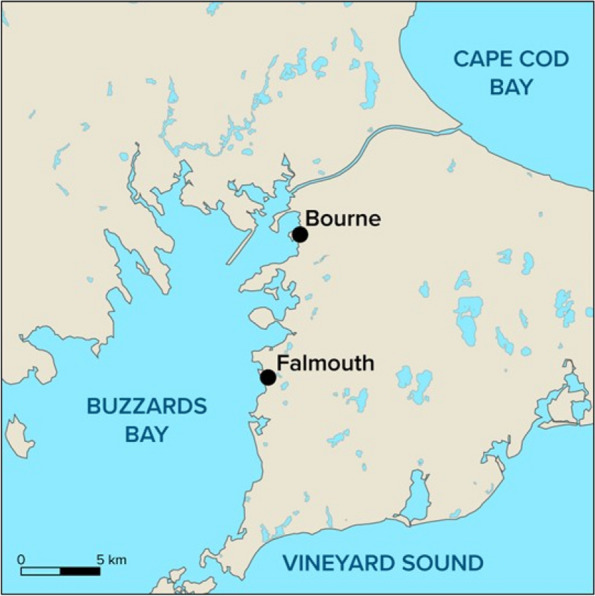
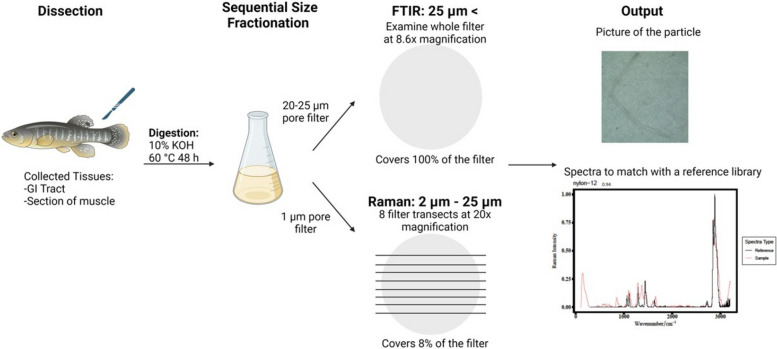
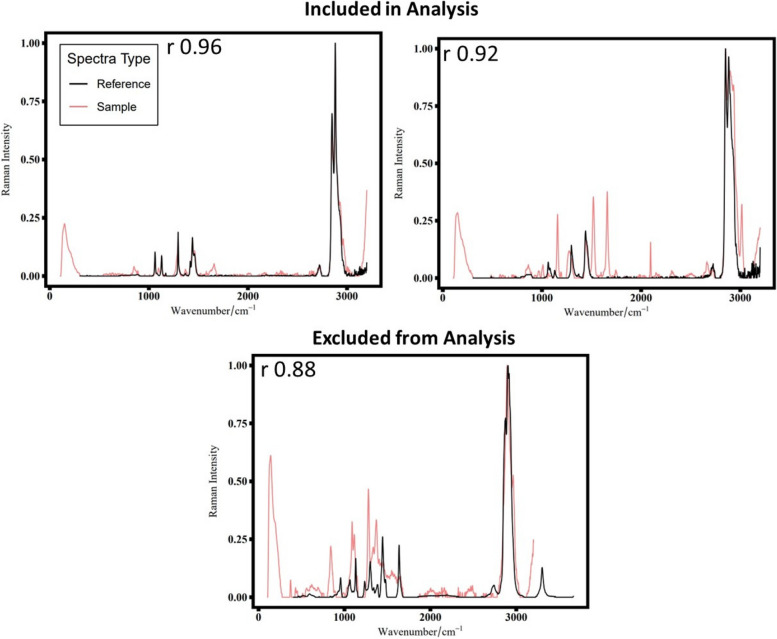
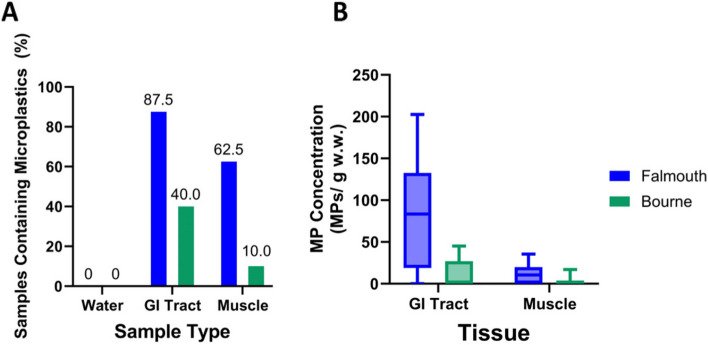
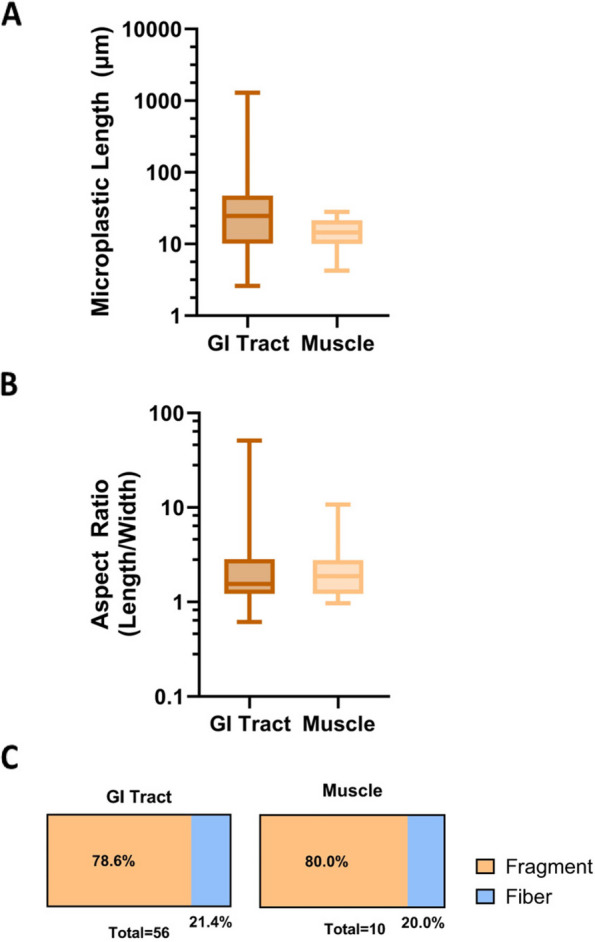
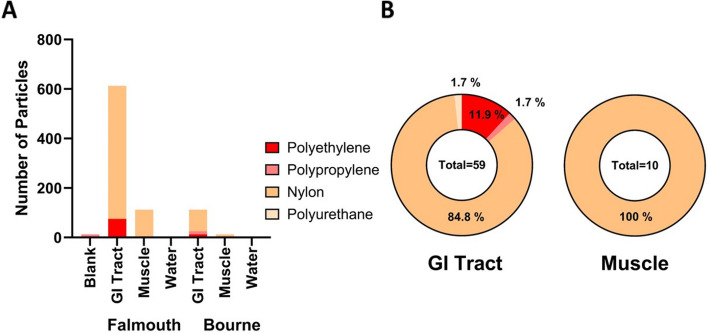
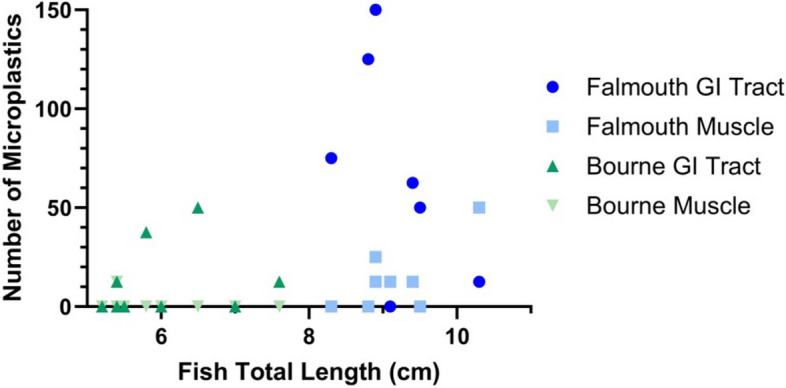
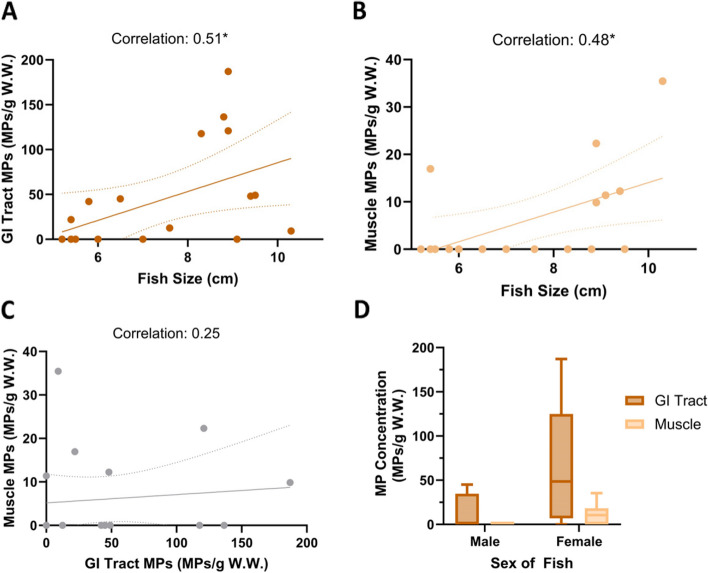
Microplastics (MPs) have been found in a diverse range of organisms across trophic levels. While a majority of the information on organismal exposure to plastics in the environment comes from gastrointestinal (GI) data, the prevalence of MP particles in other tissues is not well understood. Additionally, many studies have not been able to detect the smallest, most prevalent, MPs (1 µm - 5 mm) that are the most likely to distribute to tissues in the body. To address these knowledge gaps, MPs in the GI tract and muscle of Atlantic killifish (Fundulus heteroclitus) collected from two sites (Falmouth and Bourne) on Buzzards Bay, Cape Cod, MA were quantified down to 2 µm in size. Eight fish from Falmouth and 10 fish Bourne site were analyzed. Fourier-transform infrared spectroscopy and Raman spectroscopy were used to identify all particles. The mean concentrations of MPs in the GI tract and muscle from fish collected from Falmouth was 85.5 ± 70.2 and 11 ± 12.5 particles per gram wet weight, respectively. Fish collected from Bourne site had mean particle concentrations of 12.2 ± 18.1 and 1.69 ± 5.36 particles per gram wet weight. Of the 2,008 particles analyzed in various fish tissue samples, only 3.4% (69 particles) were identified as plastic; polymers included nylon, polyethylene, polypropylene, and polyurethane. MPs detected in the GI tract samples also tended to be more diverse in both size and polymer type than those found in the muscle. We found that MPs < 50 µm, which are often not analyzed in the literature, were the most common in both the GI tract and muscle samples. There was not a significant correlation between the MP content in the muscle compared to the GI tract, indicating that GI tract MP abundance cannot be used to predict non-GI tract tissue MP content; however, MP abundance in muscle correlated with fish total length, suggesting potential bioaccumulation of these small MPs.
Supplementary information: The online version contains supplementary material available at 10.1186/s43591-024-00101-w.
Keywords: Bioaccumulation; Fish; Fourier-transform infrared spectroscopy; Microplastics; Raman spectroscopy; Translocation.
© The Author(s) 2024.
Conflict of interest statement
Competing interestsThe authors declare no competing interests.
Figures
References
-
- Abbasi S, Soltani N, Keshavarzi B, Moore F, Turner A, Hassanaghaei M. Microplastics in different tissues of fish and prawn from the Musa Estuary, Persian Gulf. Chemosphere. 2018;205:80–7. 10.1016/J.CHEMOSPHERE.2018.04.076. - PubMed
-
- Abraham BJ. Species profiles. Life histories and environmental requirements of coastal fishes and invertebrates (Mid-Atlantic). Mummichog and Striped Killifish. 1985.
-
- Akhbarizadeh R, Moore F, Keshavarzi B. Investigating a probable relationship between microplastics and potentially toxic elements in fish muscles from northeast of Persian Gulf. Environ Pollut. 2018;232:154–63. 10.1016/J.ENVPOL.2017.09.028. - PubMed
-
- Akoueson F, Sheldon LM, Danopoulos E, Morris S, Hotten J, Chapman E, Li J, Rotchell JM. A preliminary analysis of microplastics in edible versus non-edible tissues from seafood samples. Environ Pollut. 2020;263:114452. 10.1016/J.ENVPOL.2020.114452. - PubMed
-
- Amini-Birami F, Keshavarzi B, Esmaeili HR, Moore F, Busquets R, Saemi-Komsari M, Zarei M, Zarandian A. Microplastics in aquatic species of Anzali wetland: an important freshwater biodiversity hotspot in Iran. Environ Pollut. 2023;330:121762. 10.1016/J.ENVPOL.2023.121762. - PubMed
Grants and funding
LinkOut - more resources
Full Text Sources