. 2024;11(1):155.
doi: 10.1186/s40537-024-01023-3. Epub 2024 Oct 30.

Integrating Big Data, Artificial Intelligence, and motion analysis for emerging precision medicine applications in Parkinson's Disease

Affiliations

Integrating Big Data, Artificial Intelligence, and motion analysis for emerging precision medicine applications in Parkinson's Disease

Laura Dipietro et al. J Big Data. 2024.

Abstract

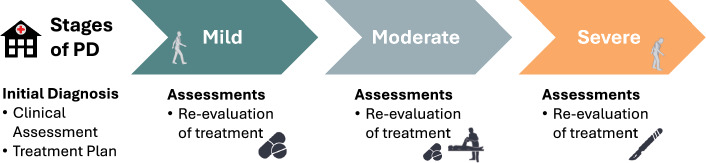
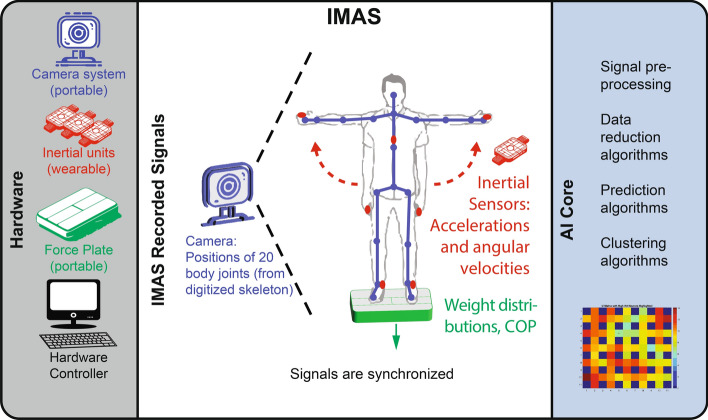
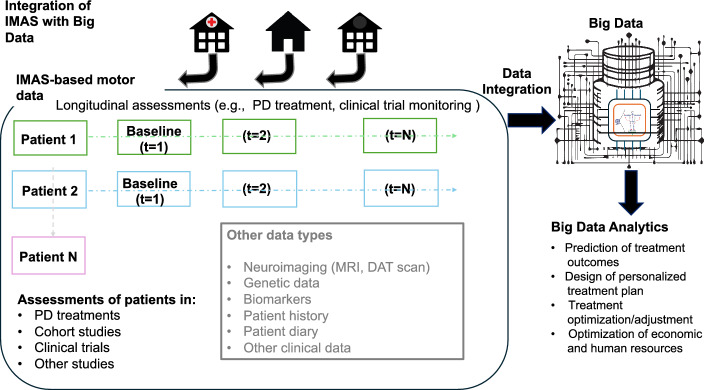
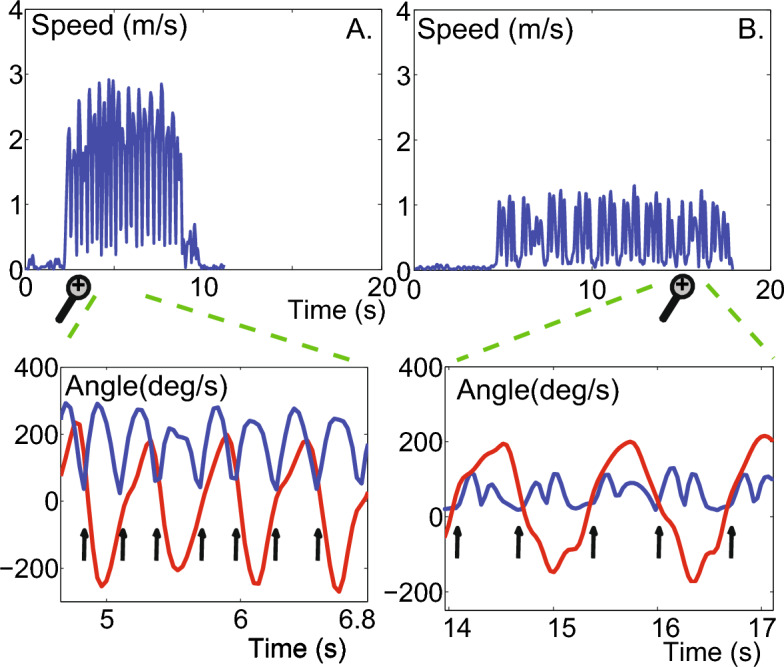
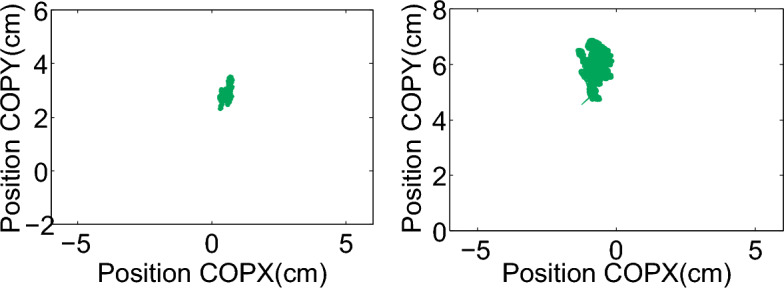
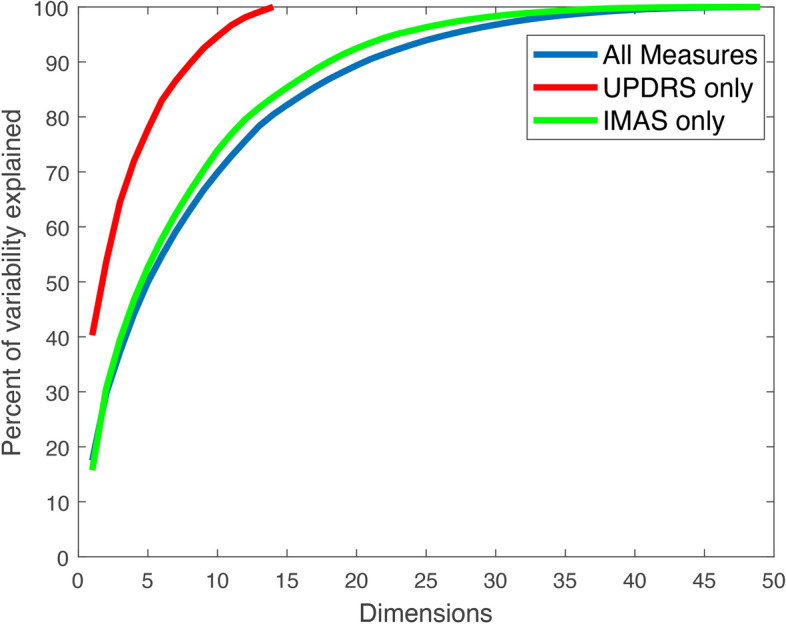
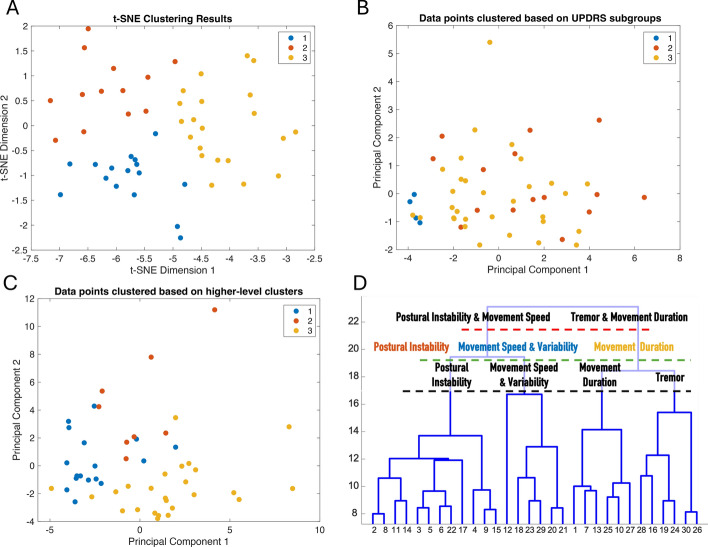
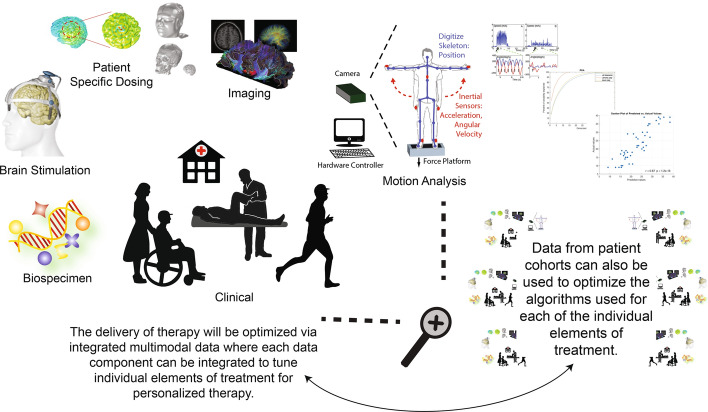
One of the key challenges in Big Data for clinical research and healthcare is how to integrate new sources of data, whose relation to disease processes are often not well understood, with multiple classical clinical measurements that have been used by clinicians for years to describe disease processes and interpret therapeutic outcomes. Without such integration, even the most promising data from emerging technologies may have limited, if any, clinical utility. This paper presents an approach to address this challenge, illustrated through an example in Parkinson's Disease (PD) management. We show how data from various sensing sources can be integrated with traditional clinical measurements used in PD; furthermore, we show how leveraging Big Data frameworks, augmented by Artificial Intelligence (AI) algorithms, can distinctively enrich the data resources available to clinicians. We showcase the potential of this approach in a cohort of 50 PD patients who underwent both evaluations with an Integrated Motion Analysis Suite (IMAS) composed of a battery of multimodal, portable, and wearable sensors and traditional Unified Parkinson's Disease Rating Scale (UPDRS)-III evaluations. Through techniques including Principal Component Analysis (PCA), elastic net regression, and clustering analysis we demonstrate how this combined approach can be used to improve clinical motor assessments and to develop personalized treatments. The scalability of our approach enables systematic data generation and analysis on increasingly larger datasets, confirming the integration potential of IMAS, whose use in PD assessments is validated herein, within Big Data paradigms. Compared to existing approaches, our solution offers a more comprehensive, multi-dimensional view of patient data, enabling deeper clinical insights and greater potential for personalized treatment strategies. Additionally, we show how IMAS can be integrated into established clinical practices, facilitating its adoption in routine care and complementing emerging methods, for instance, non-invasive brain stimulation. Future work will aim to augment our data repositories with additional clinical data, such as imaging and biospecimen data, to further broaden and enhance these foundational methodologies, leveraging the full potential of Big Data and AI.

Keywords: Artificial Intelligence; Big Data; Clustering; Noninvasive brain stimulation; Parkinson’s disease; Precision medicine; Prediction; UPDRS; Wearables.


Conflict of interest statement

Competing interestsTW and LD are officers at Highland Instruments, a medical device company. They have patents pending or issued, personally or as officers in the company, related to imaging, brain stimulation, diagnostics, modeling, and simulation.

Figures

Fig. 1
Fig. 1
PD continuum of care. After an initial diagnosis, primarily based on a history and motor examination, and potentially supplemented by neuroimaging and L-Dopa challenge results, patients enter the care continuum. Symptoms are monitored periodically, and treatments are adjusted depending on patient response. Treatment depends on symptom type and severity and might include pharmacological, Physical Therapy (PT), neuromodulation, and/or surgical interventions. Continued assessments are a fundamental component of the PD care continuum
Fig. 2
Fig. 2
IMAS. During IMAS assessments patients are monitored with a battery of sensors, including camera-based, inertial, and force sensors. IMAS recorded signals: Integrating different sensor modalities allows recording the patient’s motor status and overcomes the limitations associated with using a single type of sensor. Notably, the camera-based system is equipped with a computer-vision software that generates a skeleton core of the patient and monitors the position of 20 or more joints in real-time. All signals are synchronized. IMAS AI core: The AI core is equipped with a battery of algorithms for off-line processing, including data reduction and machine learning. Parts of this figure are adapted from Fig. 5 in our paper [6] and Creative Commons licensed images
Fig. 3
Fig. 3
Integration of IMAS with Big Data. IMAS motor assessments can be performed in diverse settings (e.g., clinics, PT offices, or the patient’s home). We are building a database of IMAS data collected from PD patients at different times (“t” in the figure) and undergoing different treatments, including neuromodulation, PT or a combination thereof, as well as data from other patient cohorts with limited mobility (see Fig. 8). Engineered to facilitate systematic, quantitative data recording, along with software for automated data analysis, IMAS ensures the production of homogenous datasets. This homogeneity facilitates implementation of clinical protocols, enhances the comparability of results across clinical sites, and enhances statistical analysis for instance by reducing bias
Fig. 4
Fig. 4
IMAS camera and IMU data. Examples of wrist speed profiles of an elbow flexion/extension task performed by two PD patients with different motor impairments. The speed profiles of the patient with lower motor impairment show clear speed minima (4.A), i.e., beginning and end of each movement, differently from the speed profiles of the patient with higher motor impairment (4.B) for which gyroscope recordings are needed to determine the start and stop of each movement. The bottom half of the Fig. shows an expanded view of the segmented movements (indicated by the black vertical arrows ) from the speed profile where the gyroscope data (red) is overlaid on the camera data (blue)
Fig. 5
Fig. 5
IMAS force plate data. Examples of two PD patients with different abilities to control body posture as measured by the force plate. CoP trajectories of a patient with UPDRS-III = 14 (path length = 23.57 cm) and of a patient with UPDRS-III = 46 (path length = 51.73 cm) are shown in the left and right panel, respectively
Fig. 6
Fig. 6
PCA. Percentage of variability as a function of the number of PCs retained for the UPDRS-III, IMAS, and combined data sets
Fig. 7
Fig. 7
Clustering. A displays clusters identified by a K-means clustering algorithm from a dataset reduced via t-SNE (perplexity = 30, learning rate = 200, maximum number of iterations = 1000). The data points are plotted after dimensionality reduction by t-SNE and color-coded based on cluster membership, as per the K-means algorithm (3 desired clusters). B shows the classification of patients into 3 groups (1. tremor-dominant, 2. akinetic-rigid, and 3. mixed) based on their UPDRS-III scores, using the Eggers et al. method [149]. Each patient’s classification is depicted along the first two PCs derived from a PCA analysis of the UPDRS-III scores. Each group is distinctly color-coded according to the clinical classification. C illustrates the clusters obtained through higher-level clustering derived from the neuron weights of the SOM. The plot uses the first two PCs of the original input data, with data points color-coded according to their cluster identities, as per the hierarchical clustering algorithm. A comparative analysis of A and C with B shows that the IMAS metrics produce more clearly delineated and visually distinct clusters compared to the Eggers method based on UPDRS-III subscores. D: The dendrogram shows the results of hierarchical clustering using the Ward method on the SOM neuron weights. The y-axis represents the linkage distances, indicating the variance increase with each cluster merger. Clustering into 2, 3, and 4 groups highlight the structural relationships and significant separations within the data. For each group, the most important features are reported (see text). Note, the color coding for the 3 clusters corresponds to that in C
Fig. 8
Fig. 8
IMAS future expansion and data integration. Planned IMAS implementation and integration with additional data types (e.g., biospecimen, imaging, etc.). This figure is adapted from our Fig. 5 in [6]

References

    1. Ray Dorsey E, Elbaz A, et al. Global, regional, and national burden of Parkinson’s disease, 1990–2016: a systematic analysis for the global burden of disease study 2016. Lancet Neurol. 2018;17(11):939–53. - PMC - PubMed
    1. Organization WH. Parkinson Disease https://www.who.int/news-room/fact-sheets/detail/parkinson-disease2023
    1. Feigin VL, Abajobir AA, Abate KH, Abd-Allah F, Abdulle AM, et al. Global, regional, and national burden of neurological disorders during 1990–2015: a systematic analysis for the global burden of disease study. Lancet Neurol. 2015;16(11):877–97. - PMC - PubMed
    1. Organization WH. Parkinson disease: a public health approach: technical brief https://www.who.int/publications/i/item/978924005098314 June 2022
    1. Yang W, Hamilton JL, Kopil C, Beck JC, Tanner CM, Albin RL, et al. Current and projected future economic burden of Parkinson’s disease in the US. NPJ Parkinsons Dis. 2020;6:15. - PMC - PubMed

LinkOut - more resources