. 2024 Oct 18:15:1466762.
doi: 10.3389/fimmu.2024.1466762. eCollection 2024.

Single-cell analysis of matrisome-related genes in breast invasive carcinoma: new avenues for molecular subtyping and risk estimation

Affiliations

Single-cell analysis of matrisome-related genes in breast invasive carcinoma: new avenues for molecular subtyping and risk estimation

Lingzi Su et al. Front Immunol. .

Abstract

Background: The incidence of breast cancer remains high and severely affects human health. However, given the heterogeneity of tumor cells, identifying additional characteristics of breast cancer cells is essential for accurate treatment.

Purpose: This study aimed to analyze the relevant characteristics of matrix genes in breast cancer through the multigroup data of a breast cancer multi-database.

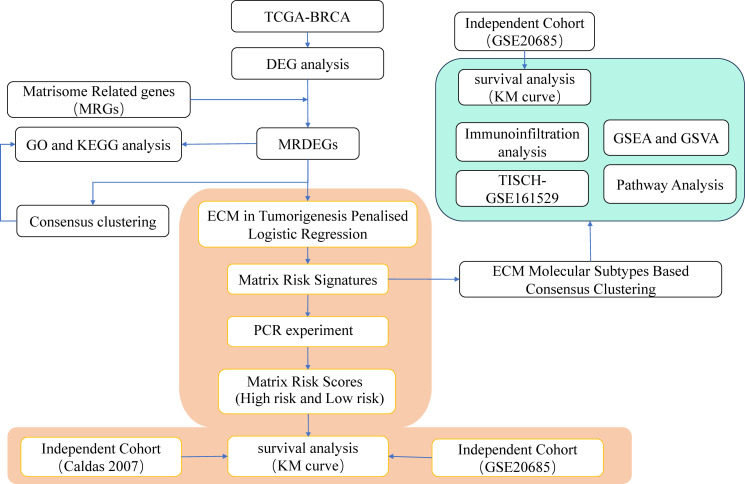
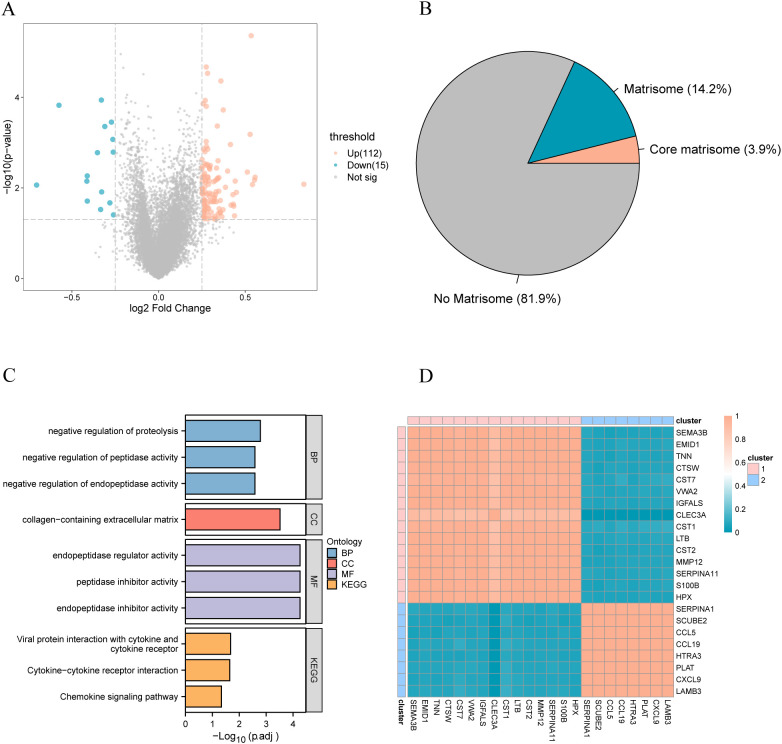
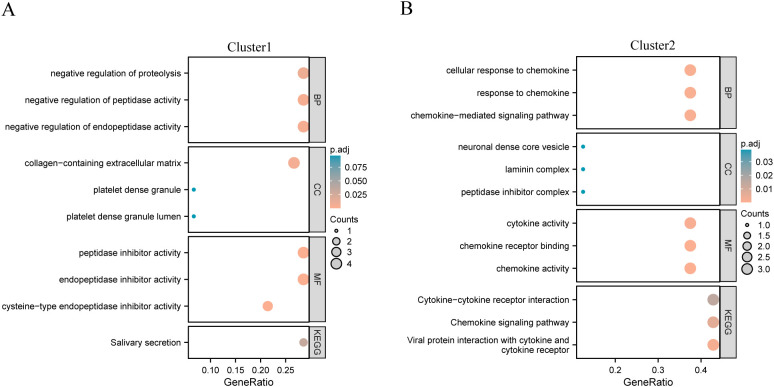
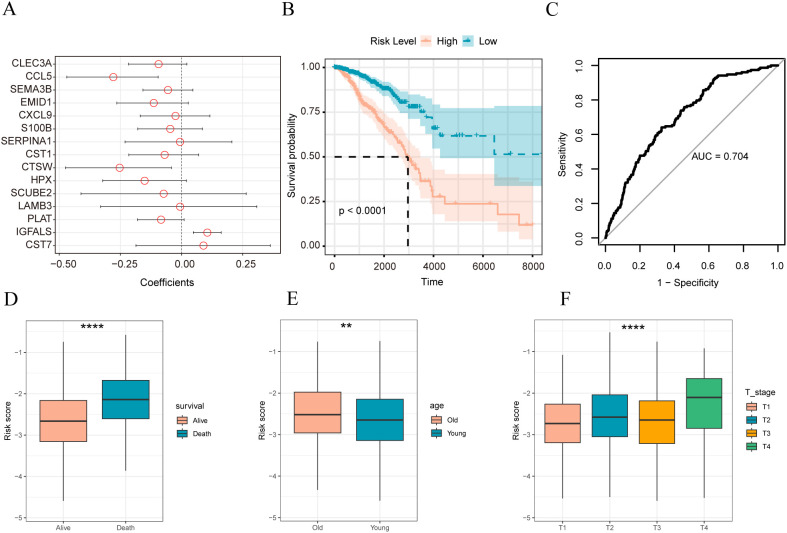
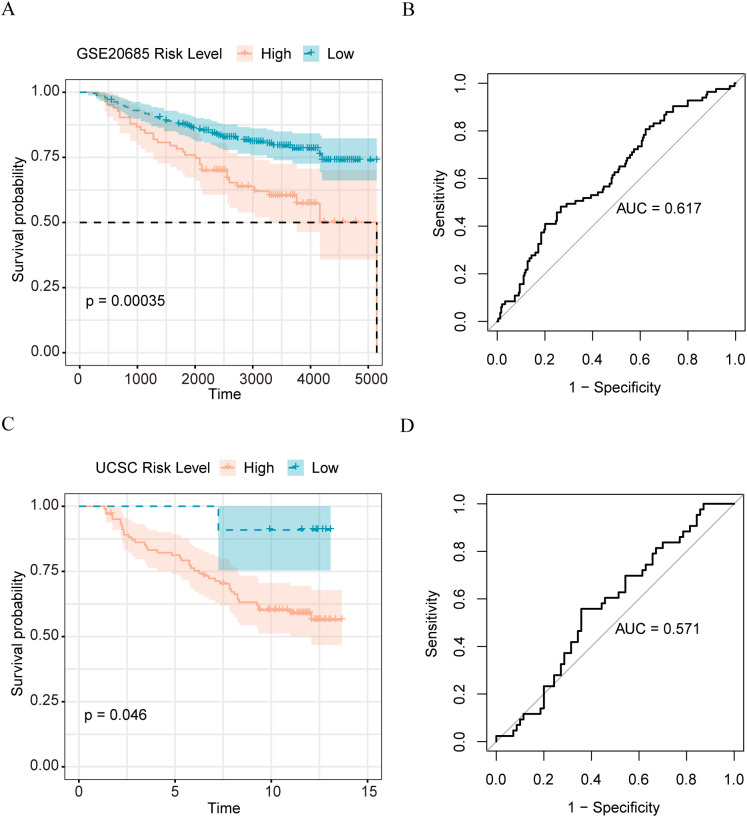
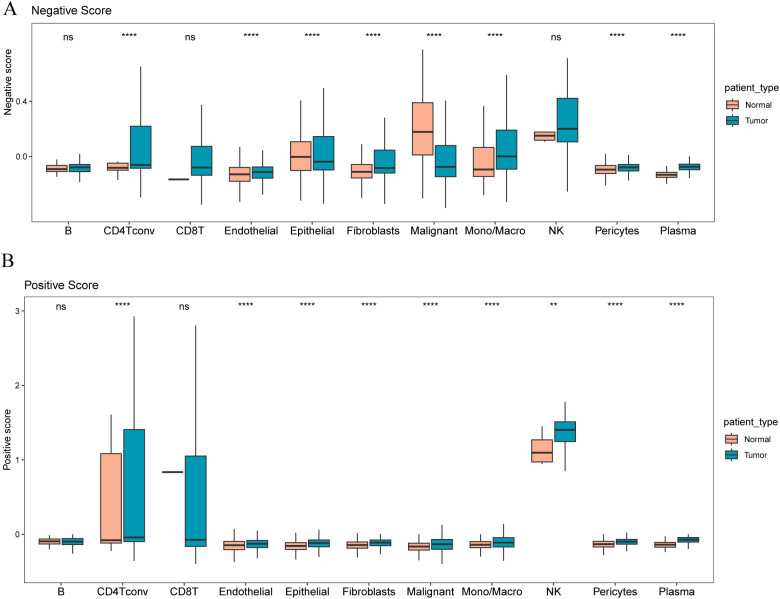
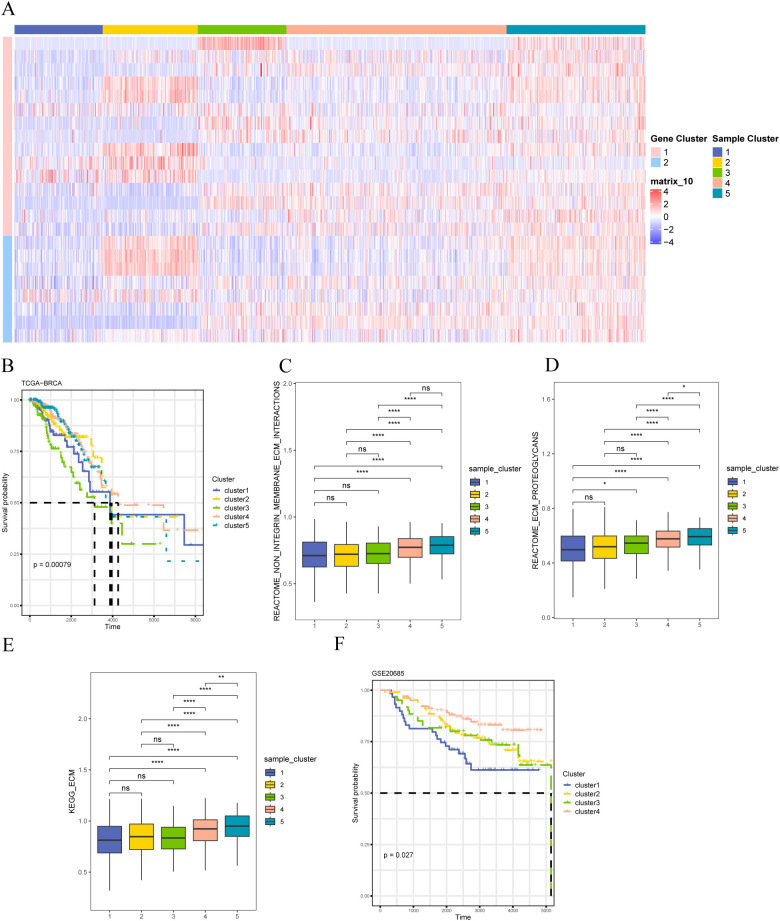
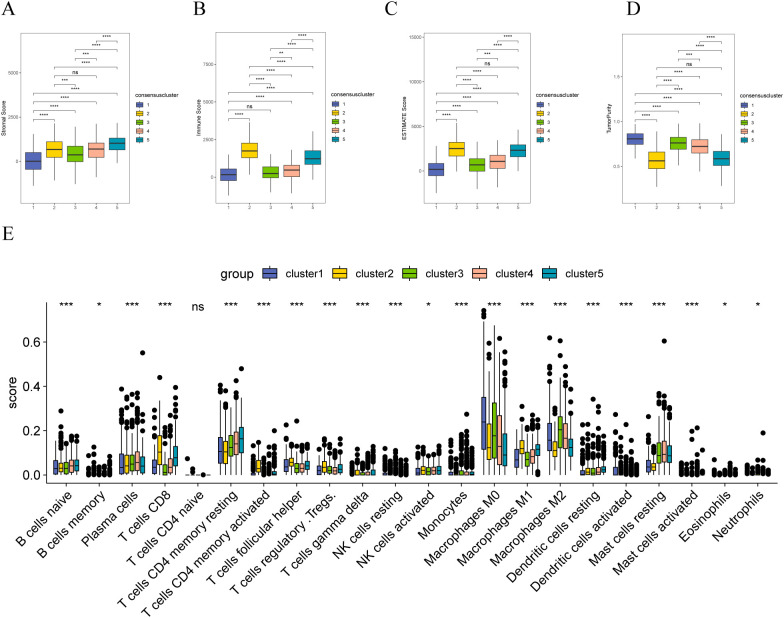
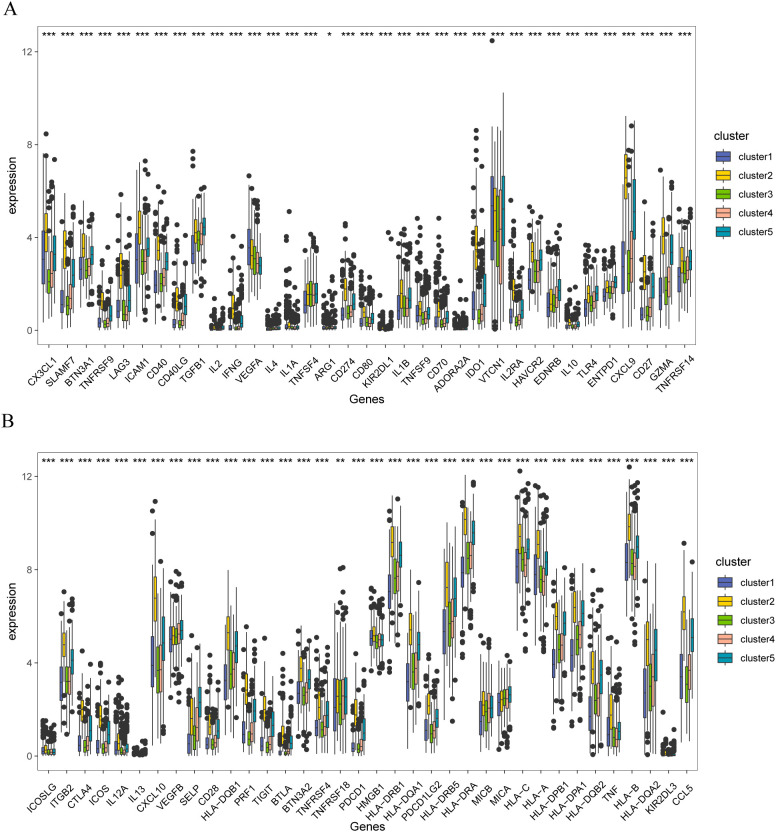
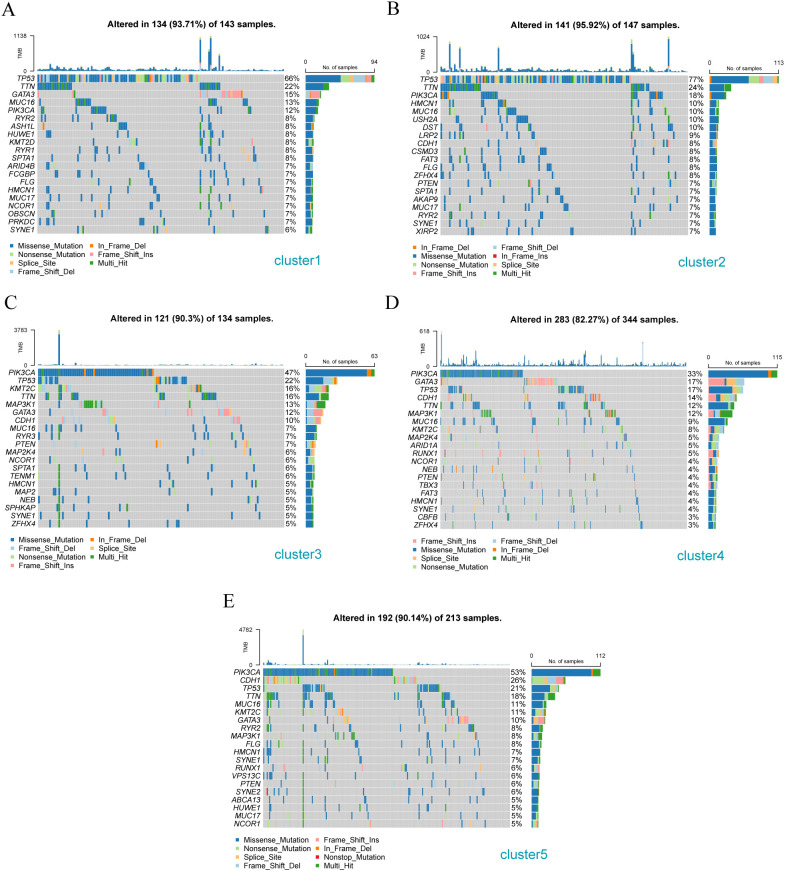
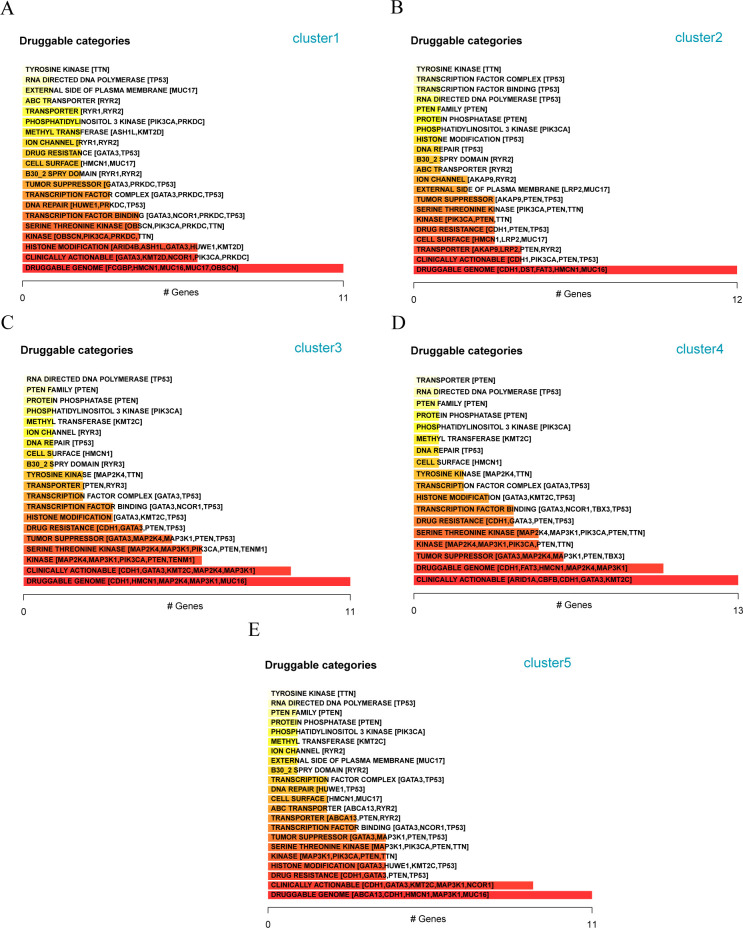
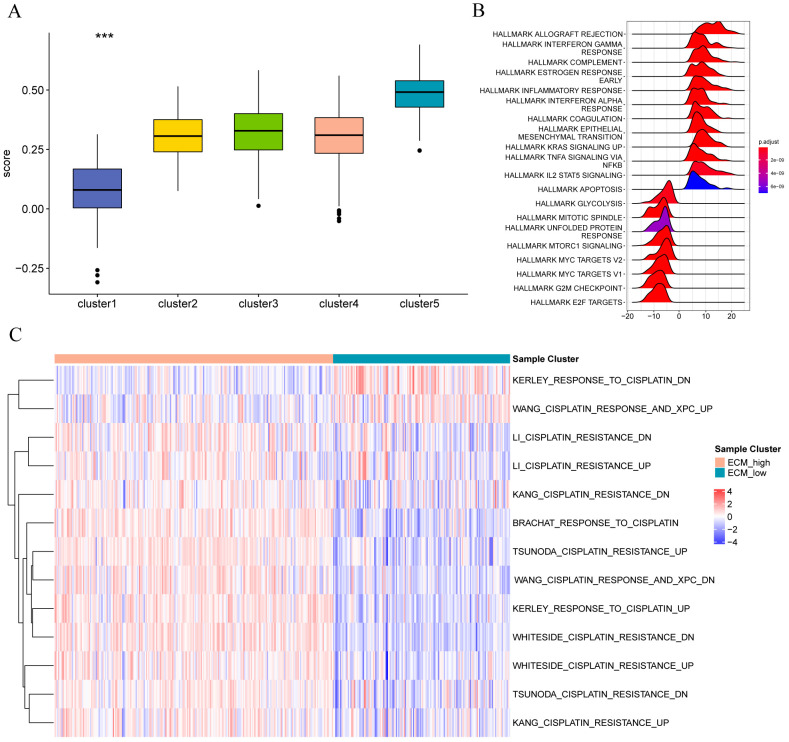
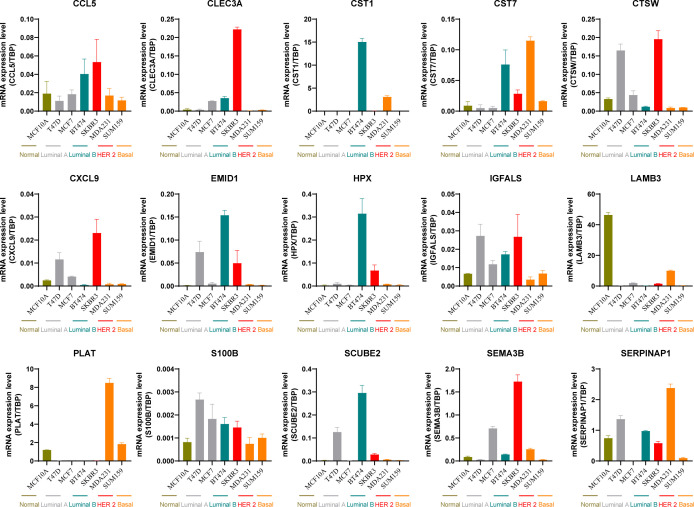
Methods: The related characteristics of matrix genes in breast cancer were analyzed using multigroup data from the breast cancer multi database in the Cancer Genome Atlas, and the differential genes of breast cancer matrix genes were identified using the elastic net penalty logic regression method. The risk characteristics of matrix genes in breast cancer were determined, and matrix gene expression in different breast cancer cells was evaluated using real-time fluorescent quantitative polymerase chain reaction (PCR). A consensus clustering algorithm was used to identify the biological characteristics of the population based on the matrix molecular subtypes in breast cancer, followed by gene mutation, immune correlation, pathway, and ligand-receptor analyses.

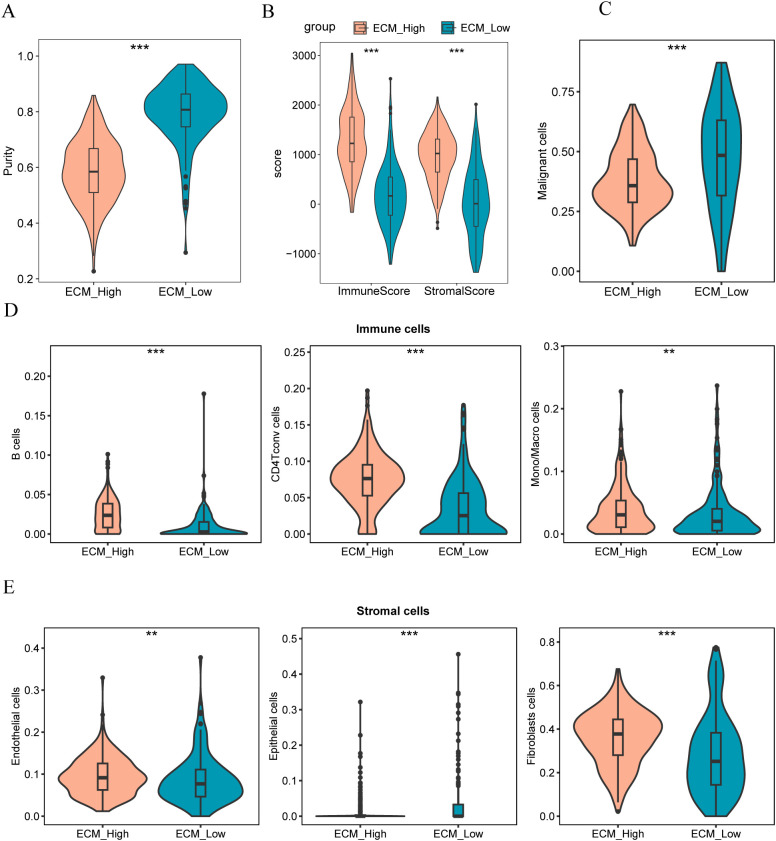
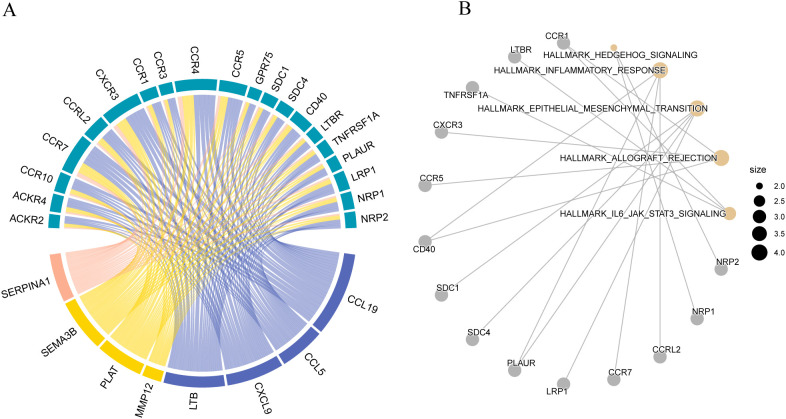
Results: This study reveals the genetic characteristics of cell matrix related to breast cancer. It is found that 18.1% of stromal genes are related to the prognosis of breast cancer, and these genes are mostly concentrated in the biological processes related to metabolism and cytokines in protein. Five different matrix-related molecular subtypes were identified by using the algorithm, and it was found that the five molecular subtypes were obviously different in prognosis, immune infiltration, gene mutation and drug-making gene analysis.

Conclusions: This study involved analyzing the characteristics of cell-matrix genes in breast cancer, guiding the precise prevention and treatment of the disease.

Keywords: breast cancer; cellular matrix gene; matrix score; molecular subtyping; single-cell sequencing.


Conflict of interest statement

The authors declare that the research was conducted in the absence of any commercial or financial relationships that could be construed as a potential conflict of interest.

Figures

Figure 1
Figure 1
Work Flow. GO, Gene Ontology; KEGG, Kyoto Encyclopedia of Genes and Genomes; DEGs, differentially expressed genes; MRDEGs, matrisomal-related differentially expressed genes; TISCH: Tumor Immune Single-cell Hub; BRCA, Breast invasive carcinoma; TCGA, The Cancer Genome Atlas; GSEA, Gene Set Enrichment Analysis; GSVA, Gene Set Variation Analysis; ECM, extracellular matrix.
Figure 2
Figure 2
(A) The volcano plot of differential analysis, where red represents upregulated genes and blue represents downregulated genes; (B) The proportion of differential plastid genes, with red indicating the proportion of core plastid genes and blue indicating the proportion of other plastid genes; (C) Functional enrichment analysis of differentially expressed plastid genes; (D) Correlation heatmap of differentially expressed plastid genes. GO, Gene Ontology; BP, biological process; CC, cellular component; MF, molecular function; KEGG, Kyoto Encyclopedia of Genes and Genomes.
Figure 3
Figure 3
KEGG functional enrichment analysis of different gene clusters. (A) Gene cluster 1 enrichment results display; (B) Gene cluster 2 enrichment results display.
Figure 4
Figure 4
Construction of stromal body risk signature in breast cancer (A) Coefficient of genes in stromal risk signature; (B) K-M survival curve of high and low stromal risk score sample group; (C) ROC plot of stromal risk feature predicting patient prognosis; (D) stromal risk score in Distribution boxplots between living and dead patients; (E) distribution boxplots of stromal body risk scores between older and younger patients; (F) distributions of stromal body risk scores among patients with different T stages box plot. The symbol ** is equivalent to p < 0.01; the symbol **** is equivalent to p < 0.0001.
Figure 5
Figure 5
Validation of the performance of matrix body risk features (A) K-M survival curve of high and low stromal body risk score sample group in GSE20685 dataset; (B) ROC plot of stromal body risk characteristics in GSE20685 data set predicting patient prognosis; (C) UCSC K-M survival curve of high and low stromal body risk score sample group in Caldas 2007 dataset; (D) UCSC Caldas 2007 data set stromal body risk characteristics predict patient prognosis ROC plot.
Figure 6
Figure 6
Distribution of different risk signature gene scores in tumor and paracancerous samples (A) Distribution of negative scores in different cell types in tumor and paracancerous samples; (B) Distribution of positive scores in different cell types in tumor and paracancerous samples. The symbol ns (not statistically significant) is equivalent to p≥0.05, no statistical significance; the symbol ** is equivalent to p < 0.01; the symbol **** is equivalent to p < 0.0001.
Figure 7
Figure 7
Identification of stromal molecular subtypes in breast cancer (A) Expression heat map of differentially expressed stromal body-related genes; (B) K-M survival curves of patients with different stromal molecular subtypes in the TCGA-BRCA dataset; (C) REACTOME ECM Interactions of patients with different stromal molecular subtypes Enrichment degree of pathway; (D) enrichment degree of REACTOME ECM Proteoglycans pathway in patients with different matrix molecular subtypes; (E) enrichment degree of KEGG_ECM pathway in patients with different matrix molecular subtypes; (F) GSE20685 K–M survival curves for patients with different matrix molecular subtypes in the dataset. The symbol ns is equivalent to p≥0.05, no statistical significance; the symbol * is equivalent to p< 0.05; the symbol ** is equivalent to p< 0.01; **** is equivalent to p < 0.0001.
Figure 8
Figure 8
Immune correlation analysis of stromal molecular subtypes in breast cancer (A) Distribution of matrix scores in patients with different matrix molecular subtypes; (B) Distribution of immune scores in patients with different matrix molecular subtypes; (C) Distribution of ESTIMATE scores in patients with different matrix molecular subtypes; (D) Tumor purity of patients with different stromal molecular subtypes; (E) distribution of infiltration degree of 22 immune cell types in patients with different stromal molecular subtypes; the symbol ns is equal to p ≥ 0.05, no statistical significance; the symbol * is equal to p < 0.05; the symbol ** is equivalent to p < 0.01; the symbol *** is equivalent to p < 0.001; the symbol **** is equivalent to p < 0.0001.
Figure 9
Figure 9
Immune checkpoint correlation analysis of stromal molecular subtypes in breast cancer (A) Distribution of immune checkpoint gene expression in patients with different matrix molecular subtypes, (B) Distribution of immune checkpoint gene expression in patients with different matrix molecular subtypes. The symbol ns is equivalent to p≥ 0.05, no statistical significance; the symbol * is equivalent to p< 0.05; the symbol ** is equivalent to p< 0.01; the symbol *** is equivalent to p< 0.001.
Figure 10
Figure 10
Gene mutation analysis of different breast cancer subtypes. (A) Gene mutation waterfall diagram of Cluster -1 sample cluster; (B) Gene mutation waterfall diagram of Cluster -2 sample cluster; (C) Gene mutation waterfall diagram of Cluster -3 sample cluster; (D) Gene mutation waterfall diagram of Cluster - 4 sample clusters; (E) Cascade diagram of gene mutations in Cluster - 5 sample clusters.
Figure 11
Figure 11
Analysis of available genes of matrix molecular subtypes in different breast cancer populations (A) Classification of potentially druggable genes in Cluster-1; (B) Classification of potentially druggable genes in Cluster-2; (C) Classification of potentially druggable genes in Cluster-3; (D) Classification of potentially druggable genes in Cluster-4; (E) Classification of potentially druggable genes in Cluster-5.
Figure 12
Figure 12
Functional enrichment analysis of stromal molecular subtype populations in different breast cancers (A) Group comparison diagram of matrix scores of different subtypes of samples; (B) enrichment of Hallmark gene set among different sample groups; (C) enrichment of C2 oncogenic pathway gene set among different sample groups.
Figure 13
Figure 13
Expression of matrix related marker genes in different breast cancer cells.
Figure 14
Figure 14
(A, B) Comparison charts of tumor purity, stroma score, and immune score in high and low ECM group samples; (C) Comparison chart of malignant tumor scores in high and low ECM group samples; (D) Comparison chart of scores in different immune cells for high and low ECM group samples; (E) Comparison chart of scores in different stromal cells for high and low ECM group samples. The symbol ** indicates p < 0.01, which has high statistical significance; the symbol *** indicates p < 0.001, which has extremely high statistical significance.
Figure 15
Figure 15
Ligand-receptor interaction analysis (A) Receptor-ligand interaction diagram; (B) Enrichment analysis of Hallmark pathways corresponding to matrix ligands and their receptors.

Similar articles

References

    1. Sung H, Ferlay J, Siegel RL, Laversanne M, Soerjomataram I, Jemal A, et al. . Global cancer statistics 2020: GLOBOCAN estimates of incidence and mortality worldwide for 36 cancers in 185 countries. CA: Cancer J Clin. (2021) 71:209–49. doi: 10.3322/caac.21660 - DOI - PubMed
    1. Slamon DJ, Fasching PA, Hurvitz S, Chia S, Crown J, Martín M, et al. . Rationale and trial design of NATALEE: a Phase III trial of adjuvant ribociclib + endocrine therapyversus endocrine therapy alone in patients with HR+/HER2– early breast cancer. Ther Adv Med Oncol. (2023) 15:1–16. doi: 10.1177/17588359231178125 - DOI - PMC - PubMed
    1. Johnston S, Harbeck N, Hegg R, Toi M, Martin M, Shao ZM, et al. . Abemaciclib combined with endocrine therapy for the adjuvant treatment of HR+, HER2-, node-positive, high-risk, early breast cancer (monarchE). J Clin Oncol. (2020) 38:3987–98. doi: 10.1200/JCO.20.02514 - DOI - PMC - PubMed
    1. Bidard FC, Kaklamani VG, Neven P, Streich G, Montero AJ, Forget F, et al. . Elacestrant (oral selective estrogen receptor degrader) Versus Standard Endocrine Therapy for Estrogen Receptor-Positive, Human Epidermal Growth Factor Receptor 2-Negative Advanced Breast Cancer: Results From the Randomized Phase III EMERALD Trial. J Clin Oncol. (2022) 40:3246–56. doi: 10.1200/JCO.22.00338 - DOI - PMC - PubMed
    1. Lu Y, Im S, Colleoni M, Franke F, Bardia A, Cardoso F, et al. . Updated Overall Survival of Ribociclib plus Endocrine Therapy versus Endocrine Therapy Alone in Pre- and Perimenopausal Patients with HR+/HER2– Advanced Breast Cancer in MONALEESA-7: A Phase III Randomized Clinical Trial. Clin Cancer Res. (2022) 28:851–59. doi: 10.1158/1078-0432.CCR-21-3032 - DOI - PMC - PubMed

Substances

LinkOut - more resources