. 2024 Oct 18:15:1470383.
doi: 10.3389/fimmu.2024.1470383. eCollection 2024.

Proteomic profiling of neutrophils and plasma in community-acquired pneumonia reveals crucial proteins in diverse biological pathways linked to clinical outcome

Affiliations

Proteomic profiling of neutrophils and plasma in community-acquired pneumonia reveals crucial proteins in diverse biological pathways linked to clinical outcome

Erik H A Michels et al. Front Immunol. .

Abstract

Introduction: Neutrophils play a dichotomous role in community-acquired pneumonia (CAP), providing protection and potentially causing damage. Existing research on neutrophil function in CAP relies on animal studies, leaving a gap in patient-centered investigations.

Methods: We used mass spectrometry to characterize the neutrophil proteome of moderately ill CAP patients at general ward admission and related the proteome to controls and clinical outcomes.

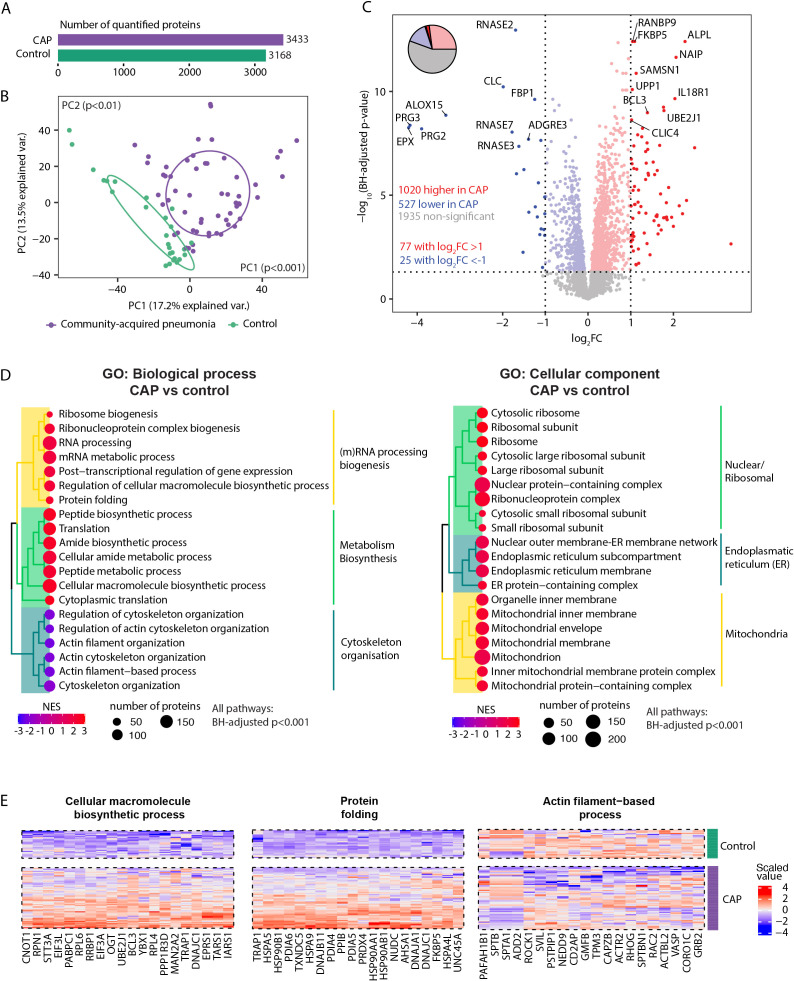
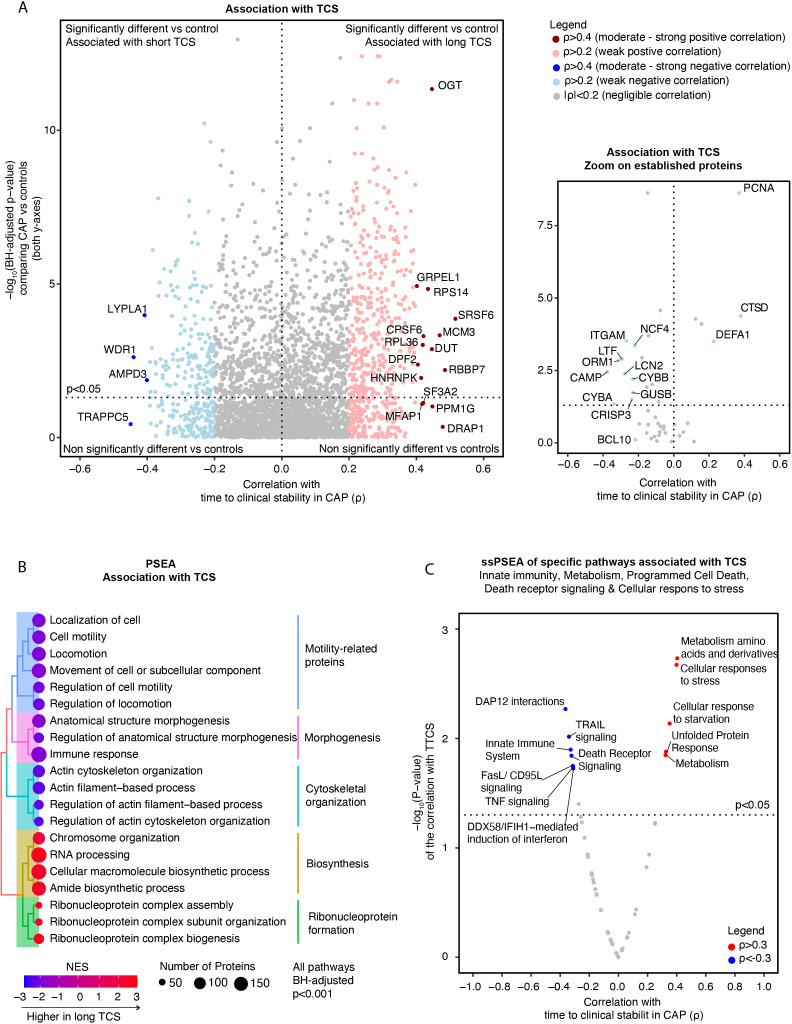
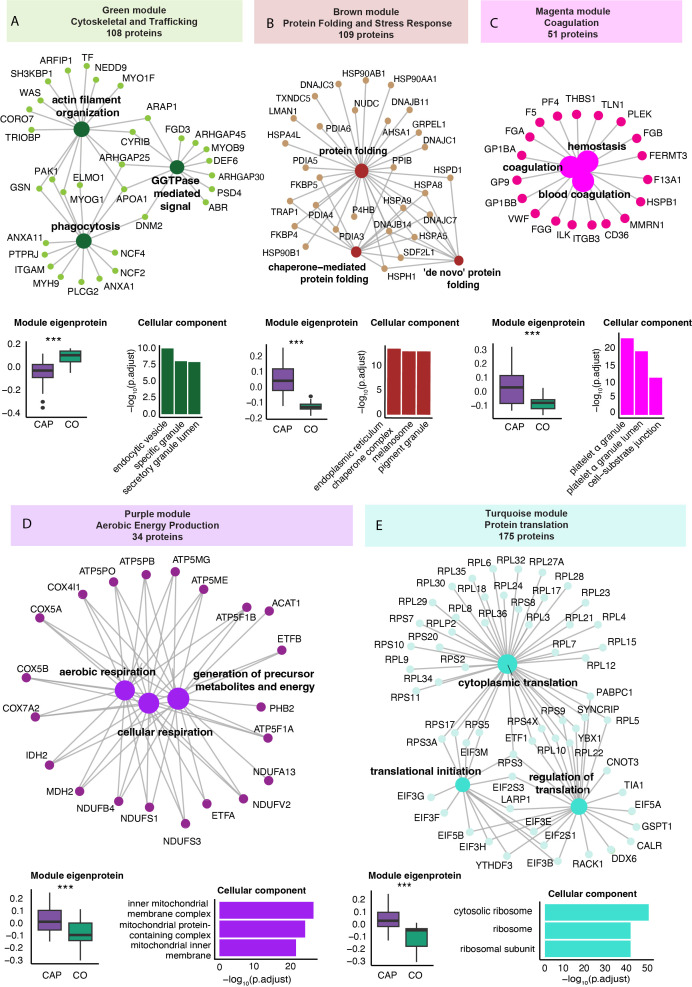
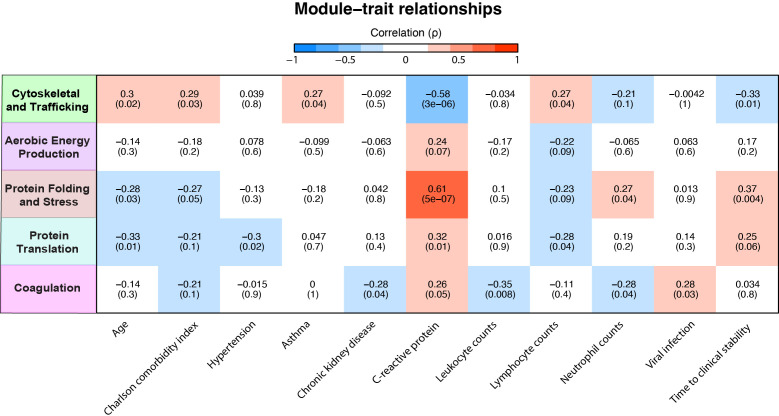
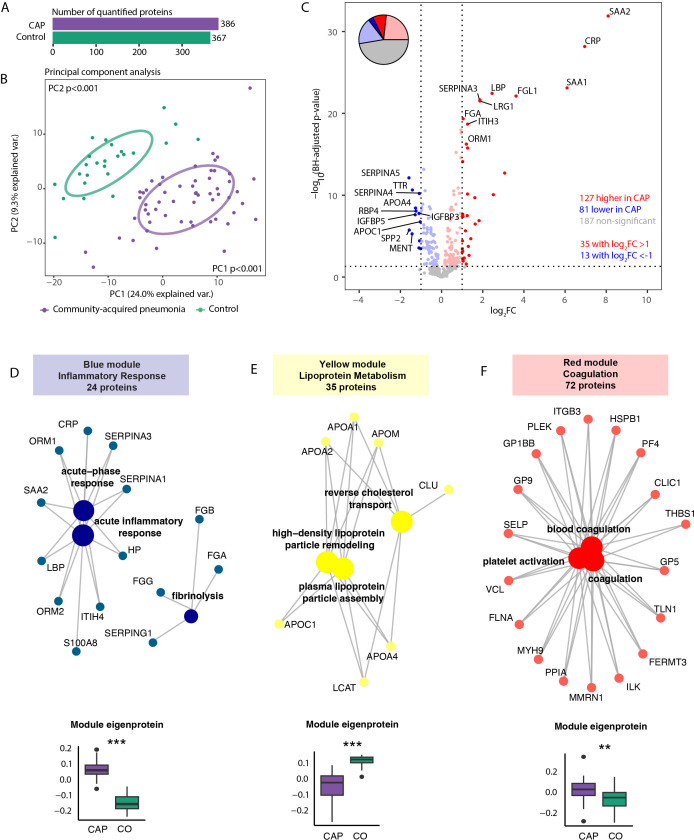
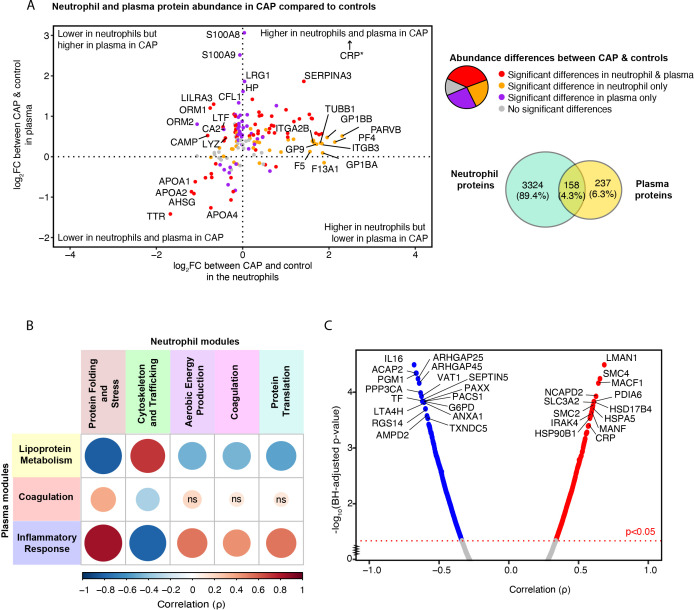
Results: We prospectively included 57 CAP patients and 26 controls and quantified 3482 proteins in neutrophil lysates and 386 proteins in concurrently collected plasma. The extensively studied granule-related proteins in animal models did not drive the neutrophil proteome changes associated with human CAP. Proteome alterations were primarily characterized by an increased abundance of proteins related to (aerobic) metabolic activity and (m)RNA translation/processing, concurrent with a diminished presence of cytoskeletal organization-related proteins (all pathways p<0.001). Higher and lower abundances of specific proteins, primarily constituents of these pathways, were associated with prolonged time to clinical stability in CAP. Moreover, we identified a pronounced presence of platelet-related proteins in neutrophil lysates of particularly viral CAP patients, suggesting the existence of neutrophil-platelet complexes in non-critically ill CAP patients. Of the proteins measured in neutrophils, 4.3% were detected in plasma.

Discussion: Our study presents new perspectives on the neutrophil proteome associated with CAP, laying the groundwork for forthcoming patient-centred investigations. Our results could pave the way for targeted strategies to fine-tune neutrophil responses, potentially improving CAP outcomes.

Keywords: community-acquired pneumonia; general ward; innate immunity; mass spectrometry; neutrophil; pneumonia; proteomics.


Conflict of interest statement

The authors declare that the research was conducted in the absence of any commercial or financial relationships that could be construed as a potential conflict of interest.

Figures

Figure 1
Figure 1
Neutrophil proteome in community-acquired pneumonia (CAP) patients and controls. (A) Number of quantified proteins stratified by group. (B) Principal component analysis (PCA) of all quantified proteins stratified by group. Each dot represents an individual subject. The ellipse indicates the central 50% of each group, color-coded as shown in the bottom part of this panel. P-values were derived from a t-test comparing the PCs between groups. (C) Volcano plot depicting the magnitude and significance of differences in neutrophil protein abundance between CAP patients and controls. P-values are derived from a limma differential expression analysis, including empirical Bayes moderation and Benjamini-Hochberg (BH) correction. Red dots represent proteins significantly more abundant in CAP patients, and blue dots represent proteins significantly lower in CAP patients. Dots with decreased transparency represent significant proteins with a Log2 fold change (FC) between -1 and 1. The pie chart visually represents the distribution of proteins with significantly different abundances between the groups. (D) Left panel; results of untargeted pathway analysis of the differences in neutrophil protein abundance between CAP patients and controls using the Gene ontology (GO) Biological Process database (31). The top 20 significantly different pathways are displayed and clustered based on the similarity of proteins in each pathway using Ward’s clustering and the Enrichment plot R-package (33). Normalized Enrichment Scores (NES) were used to quantify the magnitude of the difference. Right panel; similar method as left panel but now using the GO: Cellular Component database (31). (E) The top 20 driving proteins of the most significantly different paths per GO: biological process pathway cluster.
Figure 2
Figure 2
Association of neutrophil proteome in community-acquired pneumonia (CAP) patients with time to clinical stability. (A) Left panel; Comprehensive quadrant plot depicting the association of proteins with time to clinical stability (TCS) in CAP patients. The x-axis denotes the strength of the correlation between the protein and TCS in CAP patients derived from Spearman’s correlation test. The significance of the differences in protein abundance between CAP patients and controls was plotted on the y-axis (in line with Figure 1C ) to facilitate interpretation. The top 20 proteins with the strongest association with TCS were labeled. Right panel: Focused Quadrant plot featuring established neutrophil proteins. This panel serves to highlight these key proteins, which are also present but unlabeled in the left panel due to their lower correlation values. (B) Results of an untargeted pathway analysis of proteins ranked by the strength of their Spearman’s correlation with TCS in CAP using the Gene ontology (GO) Biological Process database (31). The top 20 pathways with the strongest association with TCS were displayed and clustered based on the similarity of proteins in each pathway using Ward’s clustering and the Enrichment plot R-package (33). Normalized Enrichment Scores (NES) were used to quantify the magnitude. (C) Single Sample Protein Set Enrichment Analysis (ssPSEA) using the Reactome ssGSEA plugin and database in which we explored specific neutrophil-related pathways (32). The individual pathway expression values for each patient, based on the protein abundance in that patient, were correlated to TCS using a Spearman’s correlation test unadjusted for multiple testing.
Figure 3
Figure 3
Weighted correlation network analysis of the neutrophil proteome in community-acquired pneumonia (CAP) patients and controls. (A) Network visualization of the three most significant Gene Ontology Biological Process (GO: BP) pathways (large dots) as determined by an overrepresentation analysis of the proteins in the green module. The numbers in the colored boxes represent the total number of proteins in the module. Displayed protein names (small dots) reflect the proteins in these top three GO: BP pathways. The boxplot in the left lower corner depicts the variation in the module score, representing the overall protein abundance pattern of all the modules’ proteins. P-values were derived from the Wilcoxon test comparing the module score between groups. The higher value of the green module score in controls (CO) compared to CAP patients indicates a higher abundance of these proteins in controls compared to CAP. The bar chart in the lower right corner reflects the three most significant GO Cellular Component pathways equally determined by an overrepresentation analysis. Collectively, this panel illustrates that CAP patients display a lower abundance of the 108 proteins in the green module (boxplot), which are functionally related to phagocytosis and cytoskeletal organization (network) and mainly originate from vesicles and granules (bar chart). (B) Brown protein module [methods as in (A)]. (C) Magenta protein module [methods as in (A)]. (D) Purple protein module [methods as in (A)]. (E) Turquoise protein module [methods as in (A)]. *** p<0.001 after Benjamini-Hochberg correction for multiple testing.
Figure 4
Figure 4
Association of neutrophil protein modules with clinical characteristics in community-acquired pneumonia (CAP) patients. Association between neutrophil protein modules and clinical characteristics in CAP patients. Only clinical characteristics with at least one significant association with a module are displayed. See sheet 12 of the Supplementary Excel File for all other correlations. The intensity of the red coloration denotes the strength of positive association, with deeper reds indicating stronger positive correlations. Conversely, the intensity of blue signifies the strength of negative association, with deeper blues indicating stronger negative correlations.
Figure 5
Figure 5
Plasma proteome in community-acquired pneumonia (CAP) patients and controls. (A) Number of quantified proteins stratified by group. (B) Principal component analysis (PCA) of all quantified proteins stratified by group. Each dot represents an individual subject. The ellipse indicates the central 50% of each group, color-coded as shown in the bottom part of the figure. P-values were derived from a t-test comparing the PCs between groups. (C) Volcano plot depicting the magnitude and significance of differences in plasma protein abundance between CAP patients and controls. P-values are derived from a limma differential expression analysis, including empirical Bayes moderation and Benjamini-Hochberg (BH) correction. Red dots represent proteins significantly more abundant in CAP patients, and blue dots represent proteins substantially less abundant in CAP patients. Dots with decreased transparency represent significant proteins with a Log2 fold change (FC) between -1 and 1. The pie chart visually represents the distribution of proteins with significantly different abundances between the groups. (D) Blue plasma protein module using a method similar to the neutrophil protein network analysis (see legend of Figure 3 for an extensive explanation) (E) Yellow plasma protein module. (F) Red plasma protein module. CO: controls. **p<0.01 and ***p<0.001 after Benjamini-Hochberg correction for multiple testing.
Figure 6
Figure 6
Relation between neutrophil and plasma proteome in community-acquired pneumonia (CAP) patients and controls. (A) Quadrant plot visualization of proteins that overlap between neutrophils and plasma. The x-axis denotes the magnitude of the difference in neutrophil protein abundance between CAP patients and controls. The y-axis indicates the difference in plasma protein abundance. Dots are colored based on the significance of comparisons. *CRP demonstrated a plasma Log2 fold change (FC) of 7 but was lowered to facilitate visualization. (B) Spearman’s correlation between neutrophil and plasma module scores. A positive correlation between modules suggests that a high abundance of the proteins comprising one module are associated with a high abundance of the proteins of the other module. Red colors represent positive associations, and blue colors negative associations. Shades of red indicate positive associations, while shades of blue denote negative associations. The magnitude of the association is depicted by both the size of the dot and the intensity of the color: larger dots and more saturated colors correspond to stronger associations. For instance, the pronounced positive correlation between the ‘Inflammatory Response’ module in plasma (blue) and the ‘Protein Folding and Stress Response’ module in neutrophils (brown) suggests that, for most patients, an increase in the plasma protein levels within the blue module corresponds with a rise in the abundance of proteins within the brown neutrophil module. (C) Spearman’s correlation between the inflammatory response in plasma, reflected by the blue module score, and individual neutrophil proteins in CAP patients. Abbreviations; ns: non-significant, BH; Benjamini-Hochberg.

Similar articles

References

    1. Welte T, Torres A, Nathwani D. Clinical and economic burden of community-acquired pneumonia among adults in Europe. Thorax. (2012) 67:71 LP – 79. doi: 10.1136/thx.2009.129502 - DOI - PubMed
    1. Torres A, Cilloniz C, Niederman MS, Menéndez R, Chalmers JD, Wunderink RG, et al. . Pneumonia. Nat Rev Dis Primers. (2021) 7:25. doi: 10.1038/s41572-021-00259-0 - DOI - PubMed
    1. Bouma G, Ancliff PJ, Thrasher AJ, Burns SO. Recent advances in the understanding of genetic defects of neutrophil number and function. Br J Haematol. (2010) 151:312–26. doi: 10.1111/j.1365-2141.2010.08361.x - DOI - PubMed
    1. Amulic B, Cazalet C, Hayes GL, Metzler KD, Zychlinsky A. Neutrophil function: from mechanisms to disease. Annu Rev Immunol. (2012) 30:459–89. doi: 10.1146/annurev-immunol-020711-074942 - DOI - PubMed
    1. Castanheira FVS, Kubes P. Neutrophils and NETs in modulating acute and chronic inflammation. Blood. (2019) 133:2178–85. doi: 10.1182/blood-2018-11-844530 - DOI - PubMed

LinkOut - more resources