

Combining PET and Compton imaging with edge-on CZT detectors for enhanced diagnostic capabilities
- PMID: 39493887
- PMCID: PMC11529829
- DOI: 10.36922/arnm.3330
Combining PET and Compton imaging with edge-on CZT detectors for enhanced diagnostic capabilities
Abstract
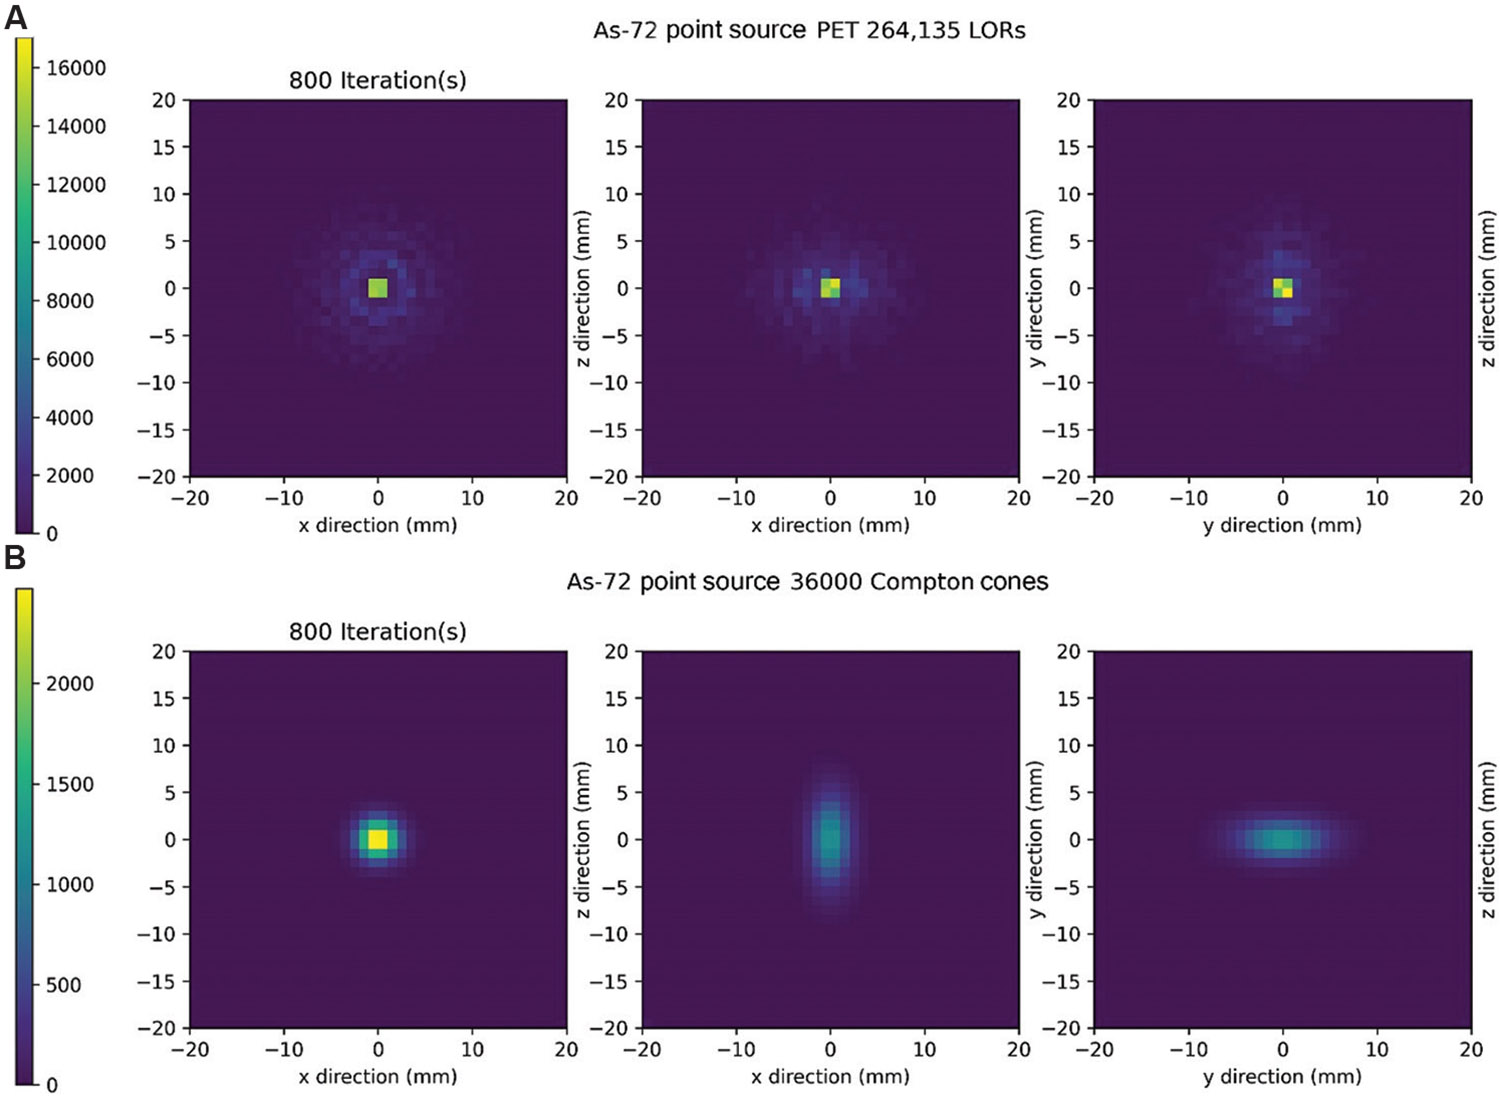
The key metrics for positron emission tomography (PET) imaging devices include the capability to capture the maximum available amount of annihilation photon information while generating high-quality images of the radiation distribution. This capability carries clinical implications by reducing scanning time for imaging, thus reducing radiation exposure for patients. However, imaging quality is degraded by positron range effects and the non-collinearity of positron annihilation photons. Utilizing an edge-on configuration of cadmium zinc telluride (CZT) detector crystals offers a potential solution to increase PET sensitivity. The high cross-section of CZT and its capacity to detect both 511 keV annihilation gammas and high-energy prompt gammas, along with multiple photon interaction events, contribute to this increased sensitivity. In this study, we propose a dual-panel edge-on CZT detector system comprised of 4 × 4 × 0.5 cm3 CZT detectors, with panel dimensions of 20 × 15 cm2 and a thickness of 4 cm. In this study, we demonstrate the increased sensitivity of our imaging system due to the detection of the Compton kinematics of high-energy gammas originating from prompt-gamma-emitting isotopes. This was achieved using Monte Carlo simulations of a prompt-gamma-emitting isotope,72As, with mean positron ranges >3 mm. Our system's dynamic energy range, capable of detecting gammas up to 1.2 MeV, allows it to operate in a dual-mode fashion as both a Compton camera (CC) and standard PET. By presenting reconstructions of 72As, we highlight the absence of positron range effects in CC reconstructions compared to PET reconstructions. In addition, we evaluate the system's increased sensitivity resulting from its ability to detect high-energy prompt gammas.
Keywords: Compton camera; Multi-isotope imaging; Positron emission tomography/computed tomography; Positron range.
Conflict of interest statement
Conflict of interest The authors declare that they have no competing interests.
Figures


Similar articles
-
Effects of system geometry and other physical factors on photon sensitivity of high-resolution positron emission tomography.Phys Med Biol. 2007 Jul 7;52(13):3753-72. doi: 10.1088/0031-9155/52/13/007. Epub 2007 May 29. Phys Med Biol. 2007. PMID: 17664575 Free PMC article.
-
Experimental Evaluation of a 3-D CZT Imaging Spectrometer for Potential Use in Compton-Enhanced PET Imaging.IEEE Trans Radiat Plasma Med Sci. 2023 Jan;7(1):18-32. doi: 10.1109/trpms.2022.3200010. Epub 2022 Aug 18. IEEE Trans Radiat Plasma Med Sci. 2023. PMID: 38106623 Free PMC article.
-
The effects of Doppler broadening and detector resolution on the performance of three-stage Compton cameras.Med Phys. 2013 Jan;40(1):012402. doi: 10.1118/1.4767756. Med Phys. 2013. PMID: 23298111 Free PMC article.
-
Sensors for Positron Emission Tomography Applications.Sensors (Basel). 2019 Nov 17;19(22):5019. doi: 10.3390/s19225019. Sensors (Basel). 2019. PMID: 31744258 Free PMC article. Review.
-
Myocardial blood flow evaluation with dynamic cadmium-zinc-telluride single-photon emission computed tomography: Bright and dark sides.Diagn Interv Imaging. 2023 Jul-Aug;104(7-8):323-329. doi: 10.1016/j.diii.2023.02.001. Epub 2023 Feb 14. Diagn Interv Imaging. 2023. PMID: 36797156 Review.
References
Grants and funding
LinkOut - more resources
Full Text Sources
Research Materials