Multiplexed Assay for Small-Molecule Quantification via Photo-cross-linking of Structure Switching Aptamers
- PMID: 39493996
- PMCID: PMC11525510
- DOI: 10.1021/acsomega.4c05258
Multiplexed Assay for Small-Molecule Quantification via Photo-cross-linking of Structure Switching Aptamers
Abstract
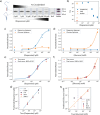
There is an unmet need for molecular detection assays that enable the multiplexed quantification of small-molecule analytes. We present xPlex, an assay that combines aptamer switches with ultraviolet-cross-linkable complementary strands to record target-binding events. When the aptamer's small-molecule target is present, the cross-linkable strand is displaced, enabling PCR amplification and detection of the relevant aptamer. In the absence of that target, the aptamer is readily cross-linked to the strand, preventing amplification from happening. The resulting aptamer-specific amplicons can be detected and quantified in a multiplexed fashion using high-throughput sequencing. We demonstrate quantitative performance for a pair of small-molecule analytes, dopamine and glucose, and show that this assay retains good specificity with mixtures of the two molecules at various concentrations. We further show that xPlex can effectively evaluate the specificity of cross-reactive aptamers to a range of different small-molecule analytes. We believe that the xPlex assay format could offer a useful strategy for achieving multiplexed analysis of small-molecule targets in a variety of scenarios.
© 2024 The Authors. Published by American Chemical Society.
Conflict of interest statement
The authors declare no competing financial interest.
Figures


Similar articles
-
No Structure-Switching Required: A Generalizable Exonuclease-Mediated Aptamer-Based Assay for Small-Molecule Detection.J Am Chem Soc. 2018 Aug 8;140(31):9961-9971. doi: 10.1021/jacs.8b04975. Epub 2018 Jul 26. J Am Chem Soc. 2018. PMID: 30011200 Free PMC article.
-
Multiplexed detection of small analytes by structure-switching aptamer-based capillary electrophoresis.Anal Chem. 2010 Jun 1;82(11):4613-20. doi: 10.1021/ac100755q. Anal Chem. 2010. PMID: 20446673
-
Accelerating Post-SELEX Aptamer Engineering Using Exonuclease Digestion.J Am Chem Soc. 2021 Jan 20;143(2):805-816. doi: 10.1021/jacs.0c09559. Epub 2020 Dec 30. J Am Chem Soc. 2021. PMID: 33378616 Free PMC article.
-
Aptamer-based lateral flow assay on-site biosensors.Biosens Bioelectron. 2021 Aug 15;186:113279. doi: 10.1016/j.bios.2021.113279. Epub 2021 Apr 24. Biosens Bioelectron. 2021. PMID: 33979718 Review.
-
Advances and Challenges in Small-Molecule DNA Aptamer Isolation, Characterization, and Sensor Development.Angew Chem Int Ed Engl. 2021 Jul 26;60(31):16800-16823. doi: 10.1002/anie.202008663. Epub 2021 Feb 9. Angew Chem Int Ed Engl. 2021. PMID: 33559947 Free PMC article. Review.
Cited by
-
Photoactivatable Aptamer-Based Biosensors for Point-of-Care Testing: Advances and Applications.Biosensors (Basel). 2025 May 24;15(6):336. doi: 10.3390/bios15060336. Biosensors (Basel). 2025. PMID: 40558418 Free PMC article. Review.
References
LinkOut - more resources
Full Text Sources
