. 2024 Oct 29:12:e18406.
doi: 10.7717/peerj.18406. eCollection 2024.

Forkhead box D subfamily genes in colorectal cancer: potential biomarkers and therapeutic targets

Affiliations

Forkhead box D subfamily genes in colorectal cancer: potential biomarkers and therapeutic targets

Ying Chen et al. PeerJ. .

Abstract

Background: The forkhead box (FOX) family members regulate gene transcription and expression. FOX family members regulate various biological processes, such as cell proliferation and tumorigenesis. FOXD, a FOX protein subfamily, is associated with poor prognosis for various cancers. However, the potential clinical value of FOXD subfamily members in colorectal cancer (CRC) has not yet been elucidated. Therefore, in this study, we aimed to determine the role of the FOXD subfamily members in CRC development.

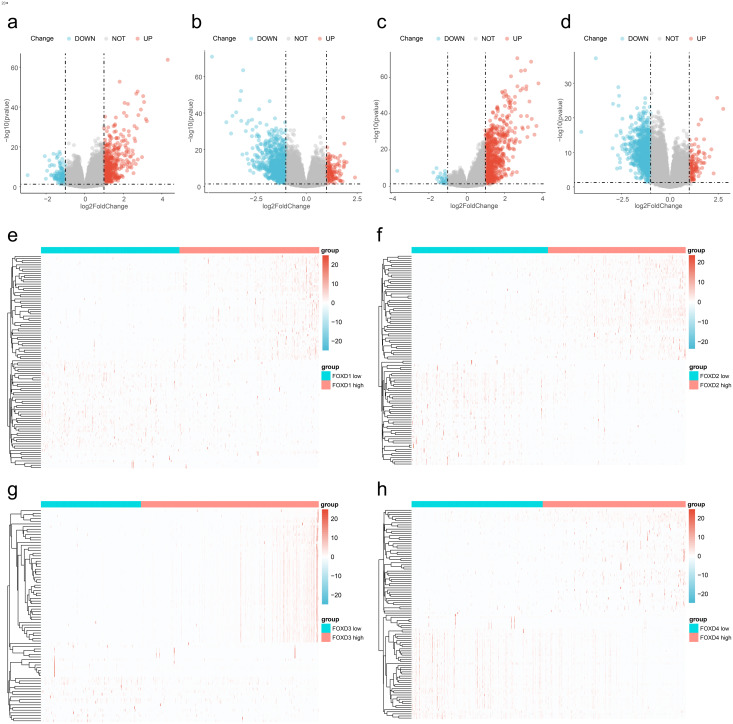
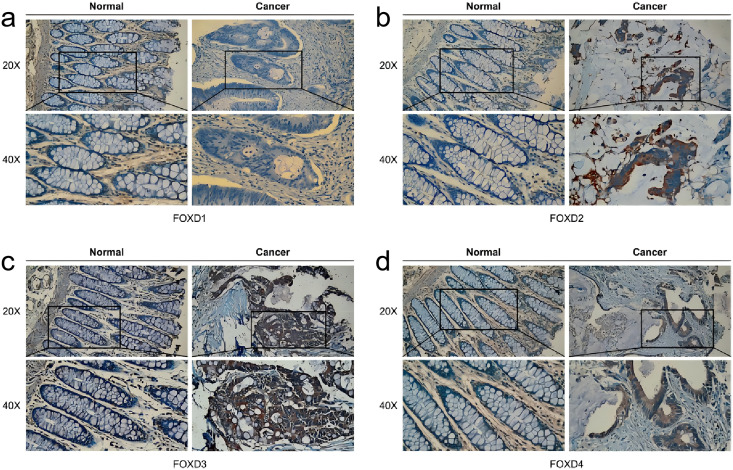
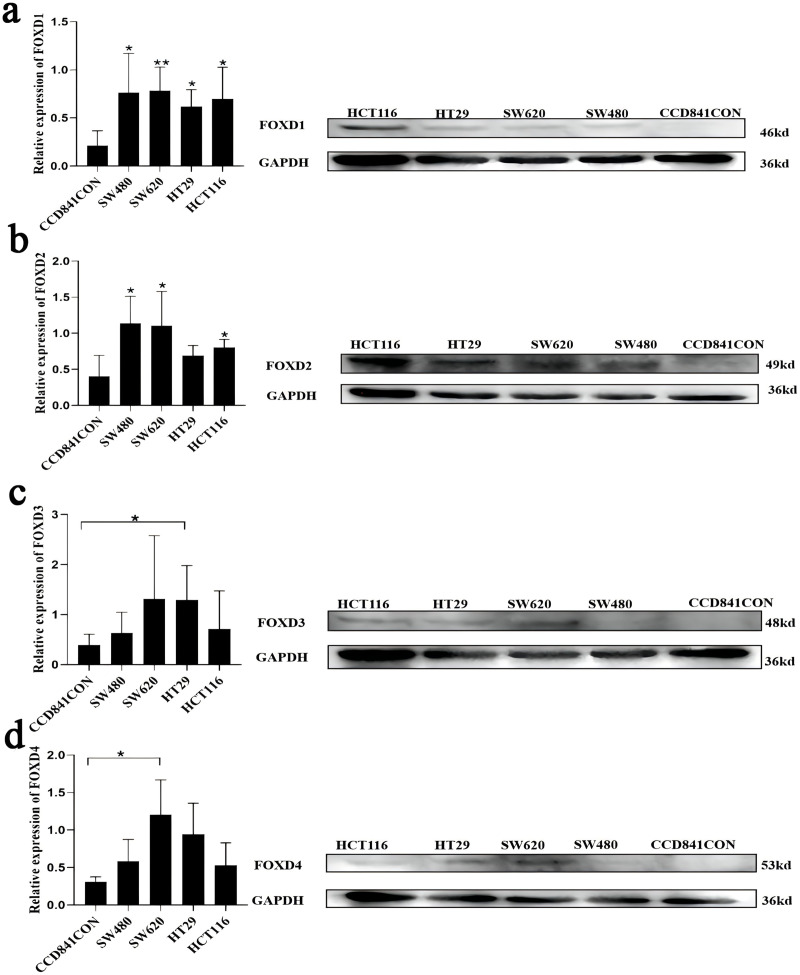
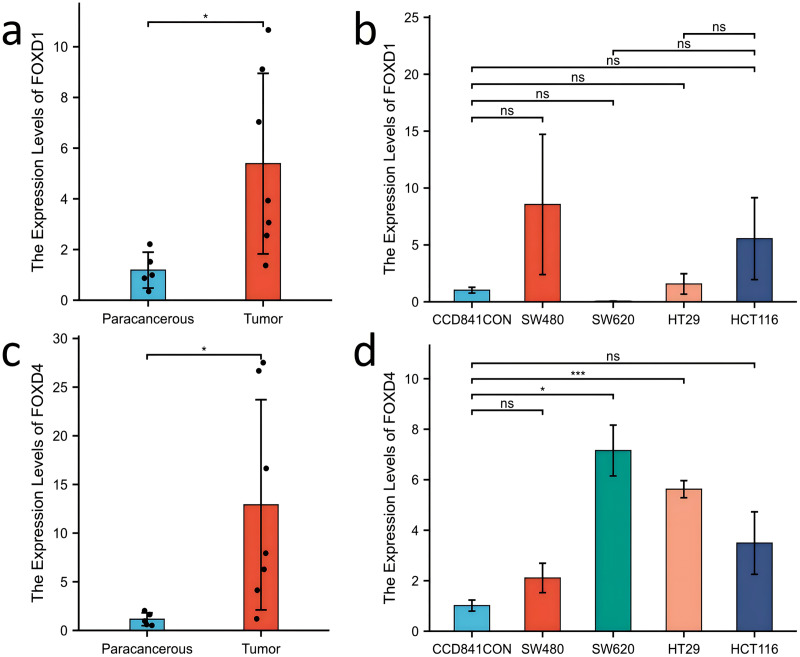
Methods: Using HTSeq-count data, clinical data, and single-nucleotide polymorphisms (obtained from The Cancer Genome Atlas Project), and bioinformatics analyses (using DESEQ2 software), we identified differentially expressed genes (DEGs) in CRC. Next, each DEG expression was validated in vitro using reverse transcription-quantitative polymerase chain reaction, western blotting, and immunohistochemistry (IHC).

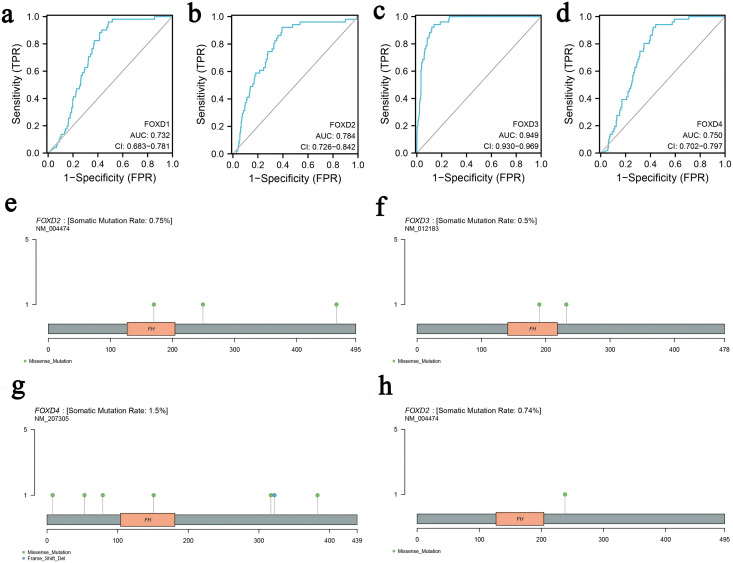
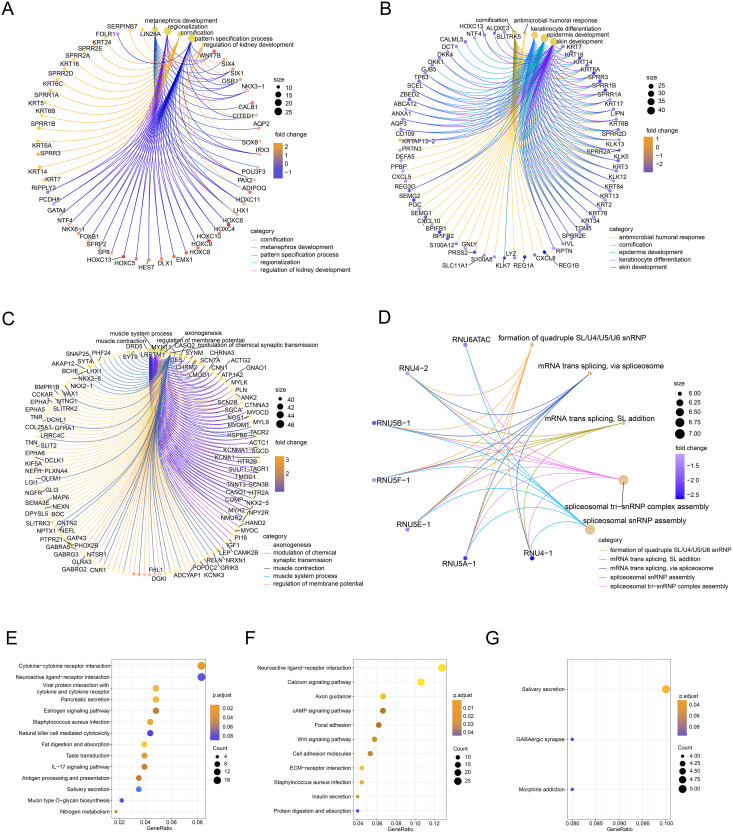
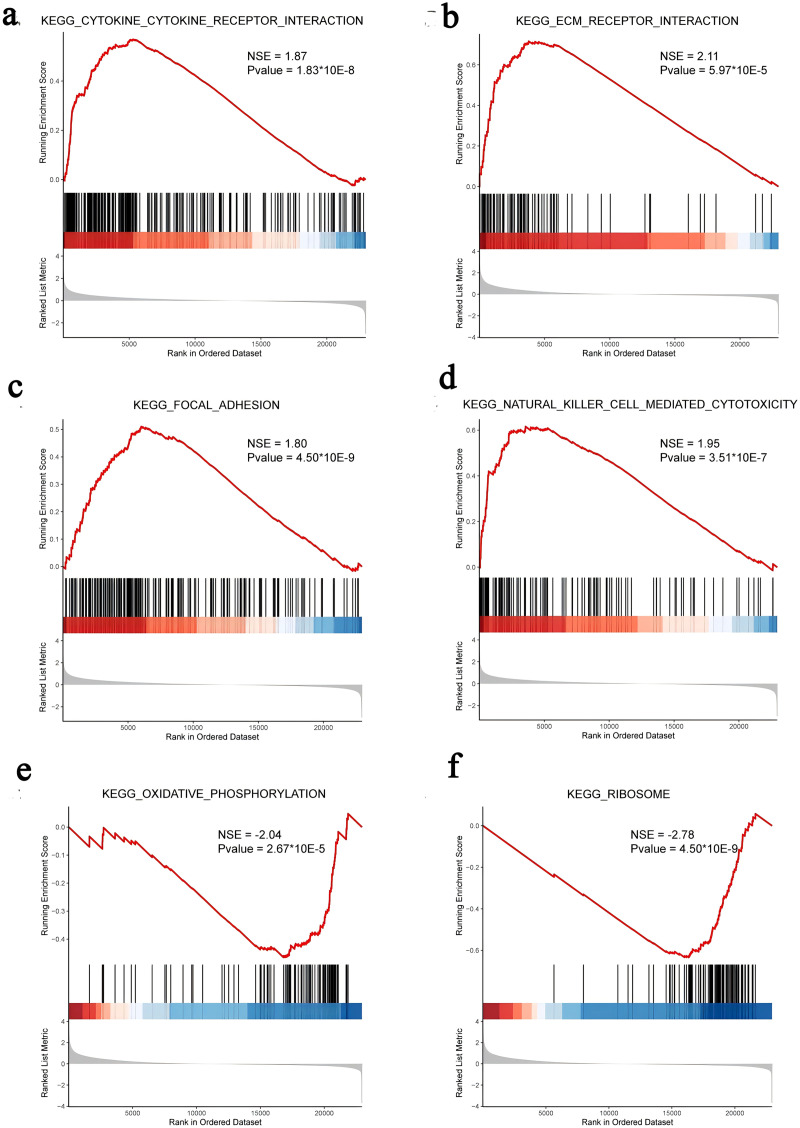
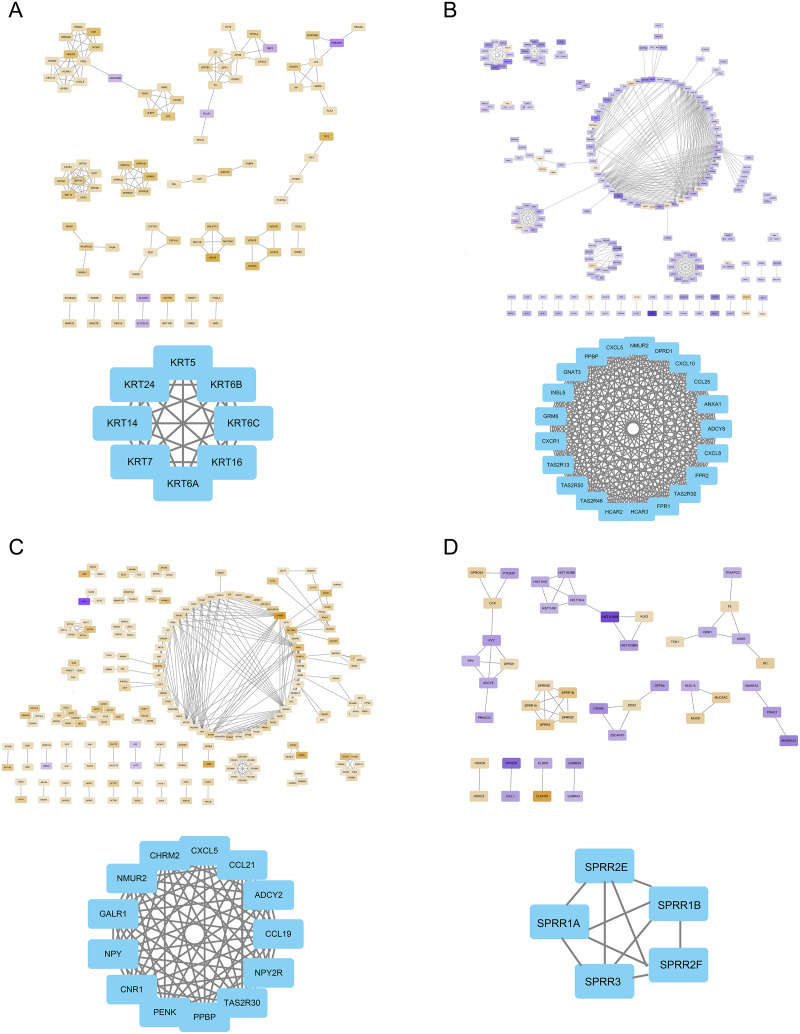
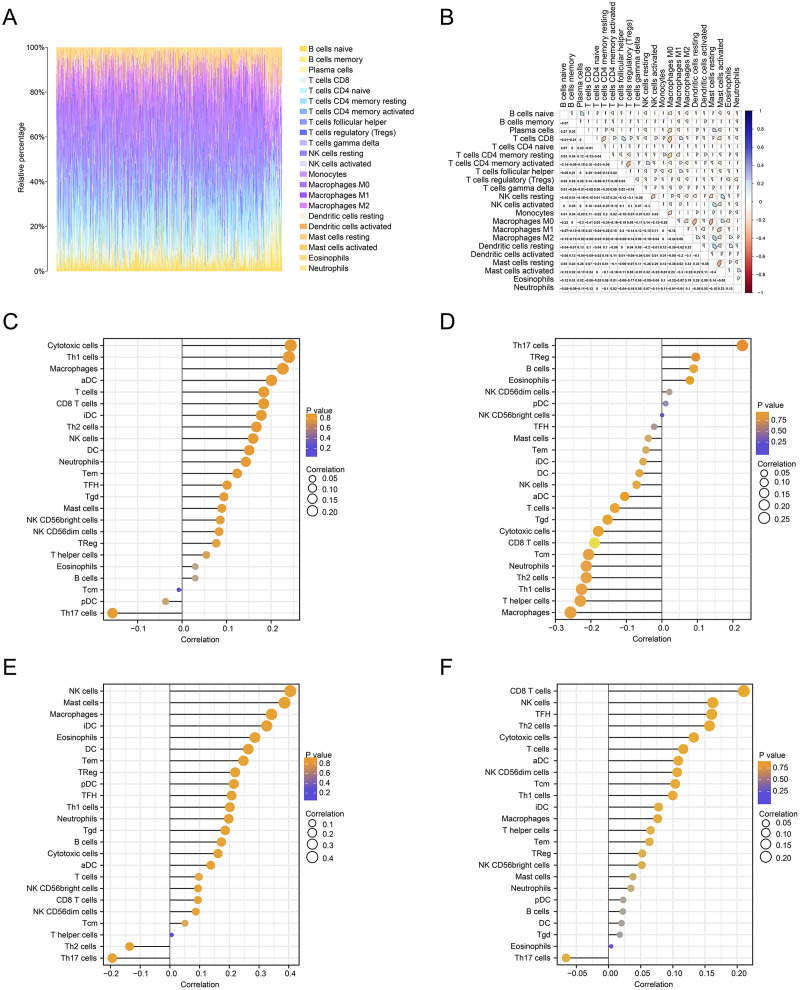
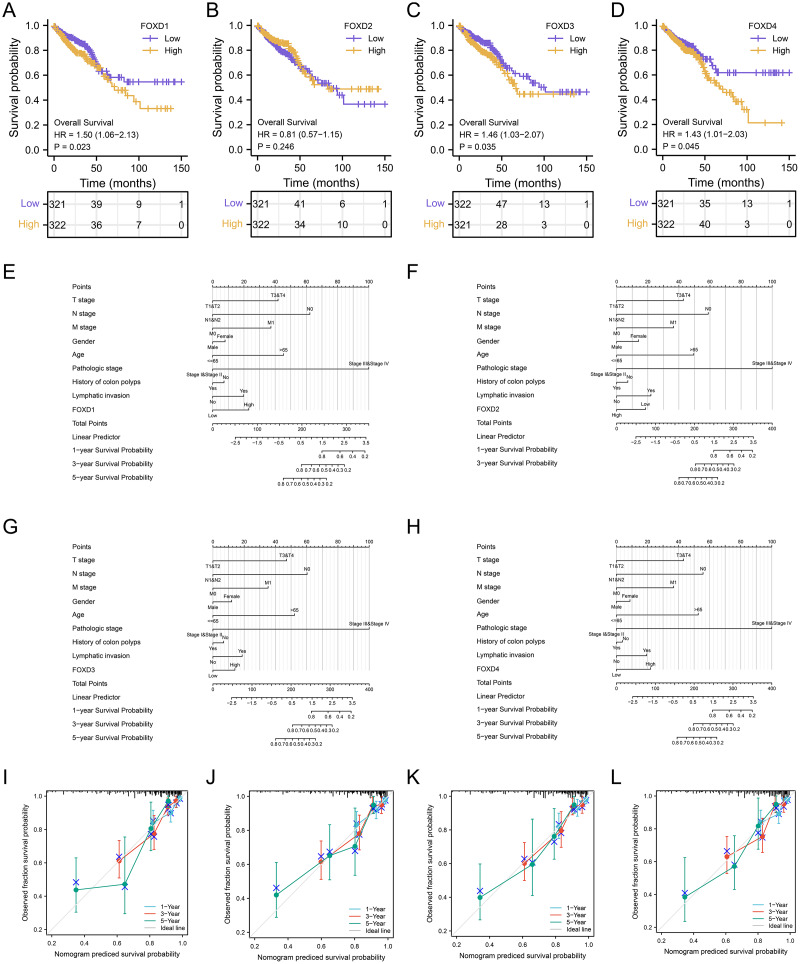
Results: Among the FOXD subfamily members, the area under the receiver operating characteristic curve of FOXD3 was 0.949, indicating that FOXD3 has a high overall diagnostic accuracy for CRC. Gene Set Enrichment Analysis revealed that FOXD-DEGs were mainly related to pathways such as cytokine, cytokine, and extracellular matrix receptor interactions. Kaplan-Meier curves and nomograms showed that FOXD1, FOXD3, and FOXD4 were prognostically significant. In conclusion, FOXD subfamily members (especially FOXD3) could serve as diagnostic and prognostic biomarkers for CRC and an immunotherapy target in patients with CRC.

Keywords: Colorectal cancer; Forkhead box D subfamily; Immune cells; Prognosis.


Conflict of interest statement

The authors declare that they have no competing interests.

Figures

Figure 1
Figure 1. The characteristics of FOXD subfamily genes.
(A–D) ROC-curve analysis of FOXD1, FOXD2, FOXD3, and FOXD4, respectively. The AUC of FOXD1, FOXD2, FOXD3, and FOXD4 was 0.732, 0.784, 0.949, and 0.750, respectively. (E–H). The mutation analysis of the FOXD subfamily is shown in lollipop plots. The mutation of FOXD1 was not detected. FOXD2 was mutated in both COAD and READ. FOXD3 and FOXD4 were mutated only in COAD. Green dots represent missense mutations and blue dots represent gene deletions.
Figure 2
Figure 2. Visualization of FOXD subfamily genes difference analysis.
(A–D) Volcano plots showed differentially expressed genes comparing high vs. low expression in the FOXD subfamily. Specifically, (A) represents FOXD1, (B) represents FOXD2, (C) represents FOXD3, and (D) represents FOXD4, respectively. Down-regulated genes were in blue and up-regulated genes were in red. (E–H) Heat maps showed that FOXD subfamily genes were grouped into low and high expression. Blue indicates low gene expression and red indicates high gene expression.
Figure 3
Figure 3. Functional enrichment analysis of the differentially expressed genes (DEGs) of the FOXD subfamily.
(A–D) The network graph showed the GO enrichment analysis of FOXD1, FOXD2, FOXD3, and FOXD4-related DEGs. (E–G) Bubble plots showed the KEGG pathways of FOXD subfamily-related DEGs.
Figure 4
Figure 4. GSEA of FOXD subfamily-related genes.
(A–F). The results showed that cytokine-cytokine receptor interaction, ECM-receptor interaction, focal adhesion, natural killer cell-mediated cytotoxicity, oxidative phosphorylation, and ribosome were the main KEGG pathways of FOXD subfamily-related genes, respectively.
Figure 5
Figure 5. The PPI network of hub genes.
(A) PPI visualization of FOXD1-DEGs and hub genes was displayed. (B) PPI visualization of FOXD2-DEGs and hub genes was displayed. (C) PPI visualization of FOXD3-DEGs and hub genes was displayed. (D) PPI visualization of FOXD4-DEGs and hub genes was displayed.
Figure 6
Figure 6. Immune cell infiltration analysis.
(A) The immune landscape represented the overall immune infiltration of patients. (B) The correlation heatmap of the 22 immune cells. Blue indicated positive correlation, red indicated negative correlation, and the darker the color, the stronger the correlation. (C–F) Lollipop figures showed the correlation between immune cells and FOXD subfamily genes.
Figure 7
Figure 7. Survival analysis and clinical correlation analysis of FOXD subfamily genes.
(A–D) The prognostic survival analysis of FOXD1, FOXD2, FOXD3, and FOXD4. (E–H) The clinical correlation analysis of FOXD subfamily genes combined with clinical indices. (I–L). The 1-, 3-, and 5-year nomogram calibration curves of FOXD1, FOXD2, FOXD3, and FOXD4 were displayed, respectively.
Figure 8
Figure 8. The IHC analysis of FOXD subfamily genes.
(A) FOXD1 expression was not detected in both tumor and normal tissues. (B) FOXD2 showed intermediate intensity staining in tumor tissues. (C) FOXD3 showed strong staining in tumor tissues. (D) FOXD4 showed intermediate intensity staining in tumor tissues. Images were at 20× magnification, and insets were at 40× magnification. CRC tumor tissues and adjacent normal colon tissues were collected from the Second Hospital of Dalian Medical University.
Figure 9
Figure 9. Cell lines were assessed for FOXD1, FOXD2, FOXD3, and FOXD4 expression by WB.
(A) FOXD1 expression was higher in all CRC cell lines, and there was a statistically significant difference. (B) FOXD2 was expressed at a higher level in SW480, SW620, HT29, and HCT116 cell lines than in normal colon cells (CCD841CON), but the difference was statistically significant only in the SW480, SW620, and HCT116 cell lines. (C) FOXD3 expression seemed to be higher in all CRC cell lines, but the difference was statistically significant only in the HT29 cell line. (D) The FOXD4 expression level seemed to be higher in all CRC cell lines, but the difference was statistically significant only in the SW620 cell line. CCD841CON was purchased from Meisen CTCC (Zhejiang, China), and all colon cancer cell lines were purchased from ProCell company (Wuhan, China). An asterisk (*) indicates a P-value < 0.05, suggesting the result is statistically significant. Two asterisks (**) indicate a P-value < 0.01, demonstrating a high level of statistical significance.
Figure 10
Figure 10. Expression of FOXD1 and FOXD4 was assayed with qPCR.
(A) The expression level of FOXD1 was higher in tumors compared with the paracancerous tissues. (B) FOXD1 expression was higher in SW480, HT29, and HCT116 cell lines than in normal colon cells (CCD841CON), but the difference was not statistically significant. (C) FOXD4 was expressed at a higher level in tumor tissues than in paracancerous tissues. (D) FOXD4 was expressed at a higher gene level in CRC cells (HCT116, HT29, SW620, SW480) than in normal colon cells (CCD841CON). However, the difference was statistically significant only in the SW620 and HT29 cell lines. An asterisk (*) indicates a P-value < 0.05, suggesting the result is statistically significant. Two asterisks (**) indicate a P-value < 0.01, demonstrating a high level of statistical significance.

Similar articles

References

    1. Adeleke S, Haslam A, Choy A, Diaz-Cano S, Galante JR, Mikropoulos C, Boussios S. Microsatellite instability testing in colorectal patients with Lynch syndrome: lessons learned from a case report and how to avoid such pitfalls. Personalized Medicine. 2022;19(4):277–286. doi: 10.2217/pme-2021-0128. - DOI - PubMed
    1. Bach DH, Long NP, Luu TT, Anh NH, Kwon SW, Lee SK. The dominant role of forkhead box proteins in cancer. International Journal of Molecular Sciences. 2018;19(10):3279. doi: 10.3390/ijms19103279. - DOI - PMC - PubMed
    1. Bademci G, Abad C, Incesulu A, Elian F, Reyahi A, Diaz-Horta O, Cengiz FB, Sineni CJ, Seyhan S, Atli EI, Basmak H, Demir S, Nik AM, Footz T, Guo S, Duman D, Fitoz S, Gurkan H, Blanton SH, Walter MA, Carlsson P, Walz K, Tekin M. FOXF2 is required for cochlear development in humans and mice. Human Molecular Genetics. 2019;28(8):1286–1297. doi: 10.1093/hmg/ddy431. - DOI - PMC - PubMed
    1. Bader GD, Hogue CW. An automated method for finding molecular complexes in large protein interaction networks. BMC Bioinformatics. 2003;4:2. doi: 10.1186/1471-2105-4-2. - DOI - PMC - PubMed
    1. Bond KH, Fetting JL, Lary CW, Emery IF, Oxburgh L. FOXD1 regulates cell division in clear cell renal cell carcinoma. BMC Cancer. 2021;21:312. doi: 10.1186/s12885-021-07957-8. - DOI - PMC - PubMed

LinkOut - more resources