. 2024 Oct 7;20(14):5450-5473.
doi: 10.7150/ijbs.97723. eCollection 2024.

N-Acetylcysteine Alleviates Depressive-Like Behaviors in Adolescent EAAC1-/- Mice and Early Life Stress Model Rats

Affiliations

N-Acetylcysteine Alleviates Depressive-Like Behaviors in Adolescent EAAC1-/- Mice and Early Life Stress Model Rats

Han-Byeol Kim et al. Int J Biol Sci. .

Abstract

Exposure to adverse experiences during early life is associated with an increased risk of psychopathology during adolescence. In a previous study, we demonstrated that neonatal maternal separation (NMS) combined with social isolation led to impulsive and depressive-like behaviors in male adolescents. Additionally, it significantly reduced the expression of excitatory amino acid carrier 1 (EAAC1) in the hippocampus. Building upon this work, we investigated the effects of N-acetylcysteine (NAC), a precursor to glutathione, in early-life stress (ELS) model rats and in EAAC1-/- mice. EAAC1 plays a dual role in transporting both glutamate and cysteine into neurons. Our findings revealed that female adolescents subjected to in the ELS model also exhibited behavioral defects similar to those of males. NAC injection rescued depressive-like behaviors in both male and female NMS models, but it improved impulsive behavior only in males. Furthermore, we observed increased reactive oxidative stress (ROS) and neuroinflammation in the ventral hippocampus (vHPC) and prefrontal cortex of NMS model rats, which were mitigated by NAC treatment. Notably, NAC reversed the reduced expression of EAAC1 in the vHPC of NMS model rats. In EAAC1-/- mice, severe impulsive and depressive-like behaviors were evident, and the NAC intervention improved only depressive-like behaviors. Collectively, our results suggest that ELS contributes to depression and impulsive behaviors during adolescence. Moreover, the cysteine uptake function of EAAC1 in neurons may be specifically related to depression rather than impulsive behavior.

Keywords: Depressive-like behavior; Early life stress; Excitatory amino acid carrier 1 (EAAC1); Impulsive behavior; N-acetylcysteine (NAC); Neonatal maternal separation.


Conflict of interest statement

Competing Interests: The authors have declared that no competing interest exists.

Figures
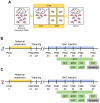
Figure 1
Figure 1
Experimental procedure and schedule for the NAC injection and behavioral tests. (A) A schematic diagram of the experimental procedure. Pups were individually separated from their mothers and littermates for a duration of 3 hrs/day, from 10:00 to 13:00. This maternal separation was applied to the experimental subjects from PND 2 to PND 21. Behavioral experiments were conducted from PND 36 to PND 42 in male rats (B) and from PND 31 to PND 37 in female rats (C). The i.p. injection of NAC commenced 2 days prior to the behavioral tests.
Figure 2
Figure 2
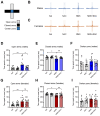
NAC mitigates NMS-induced impulsive behaviors in male rats in the OFT. (A) A schematic of the tested open field arena, displaying the edge, outer, and inner zones. Representative tracks of male (B) and female (C) rats in the Sal, NAC, NMS, and NMS+NAC groups. The bar graph shows the time spent in the inner zone (D), outer zone (E), and edge zone (F) by male rats. The bar graph shows the total distance traveled (G) and velocity (H) of male rats. The bar graph shows the time spent in the inner zone (I), outer zone (J), and edge zone (K) by female rats. The bar graph shows the total distance (L) and velocity (M) of female rats. The locomotor behavioral data are presented as the means ± S.E.M.s. Differences among the experimental groups were determined using one-way ANOVA with Tukey's multiple comparisons test. **p < 0.01, ***p < 0.001 and #p < 0.05.
Figure 3
Figure 3
NAC rescues NMS-induced impulsive behaviors in male rats in the EPM. (A) A schematic of the EPM, displaying the open, closed, and center zones. Representative tracks of male (B) and female (C) rats in the Sal, NAC, NMS, and NMS+NAC groups. The bar graph shows the time spent in the open arms (D), closed arms (E), and center zone (F) by male rats. The bar graph shows the time spent in the open arms (G), closed arms (H), and center zone (I) by female rats. The quantified data are presented as the means ± S.E.M.s. Differences among the experimental groups were determined using one-way ANOVA with Tukey's multiple comparisons test. *p < 0.05, **p < 0.01, and #p < 0.05.
Figure 4
Figure 4
NAC rescues NMS-induced impulsive behaviors in male rats in the VCAT. (A) Schematic representation of the test arena in the CAT, highlighting the center, border, and floor zones. (B) Representative tracks of male rats treated with Sal, NAC, NMS, or NMS+NAC. (C) Representative tracks of female rats treated with Sal, NAC, NMS, or NMS+NAC. (D) Bar graph showing the time spent in the border + floor zones. (E) Bar graph showing the CAT (%) in male rats. (F) Bar graph showing the time spent in the border + floor zones by female rats. (G) Bar graph showing the CAT (%) in female rats. (H) Schematic of the VCAT platform. (I) Bar graph showing the jumping latency of male rats. (J) Bar graph showing the CAT activity (%) of male rats (CON, NMS: chi square = 7.413, ***p < 0.01; NMS, NMS+NAC: chi square = 7.674, ##p < 0.01). (K) Bar graph showing the jumping latency of female rats. (L) Bar graph showing the CAT activity (%) of female rats (CON, NMS: chi square = 9.061, ***p < 0.001). The data quantifying impulsive-like behaviors are presented as the means ± S.E.M.s. Differences in the experimental groups were determined using one-way ANOVA with Tukey's multiple comparisons test. *p < 0.05, ****p < 0.0001, #p < 0.05 and ####p < 0.0001.
Figure 5
Figure 5
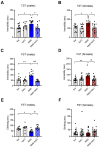
NAC rescues NMS-induced depressive-like behaviors in male and female rats. NMS rats were tested in the TST, and the immobility time was measured. The bar graph shows the immobility time in of male rats (A) and female rats (B). NMS rats were also tested in the FST. The bar graphs show the time spent immobile (C) and climbing (E) by male rats and the time spent immobile (D) and climbing (F) by female rats. The data quantifying depressive-like behaviors are presented as the means ± S.E.M.s. Differences in the experimental groups were determined using one-way ANOVA with Tukey's multiple comparisons test. *p < 0.05, **p < 0.01, #p < 0.05, ##p < 0.01, and ###p < 0.001.
Figure 6
Figure 6
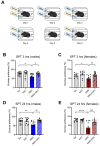
NAC alleviates NMS-induced anhedonic behavior in male and female rats. Adolescent NMS rats performed the SPT. (A) A schematic representation of the SPT protocol is shown. The measurement of anhedonic behavior by the SPT in adolescent male and female rats over 5 days (habituation) and 6 days (test) is presented. The bar graphs show the percentage of sucrose preference during 3 hrs (B) and 24 hrs (D) in male rats and during 3 hrs (C) and 24 hrs (E) in female rats. The data quantifying anhedonic behavior are presented as the means ± S.E.M.s. Differences in the experimental groups were determined using one-way ANOVA with Tukey's multiple comparisons test. *p < 0.05, **p < 0.01, ****p < 0.0001, #p < 0.05, ##p < 0.01, and ###p < 0.001.
Figure 7
Figure 7
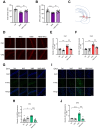
NAC reduces oxidative stress in the vHPC, resulting in neuroprotection. Antioxidant activities of SOD (A) and GPx (B) in the HPC of adolescent animals treated with NAC. (C) The illustration shows the stained regions of the vHPC, including the CA1 and CA3 areas. (D) Images of IF staining for DHE in the CA1 and CA3 regions of the vHPC. Scale bar, 100 μm. Quantification of DHE immunoreactivity in the CA1 (E) and CA3 (F) regions. (G and I) Sections of the vHPC (CA1 and CA3 regions) from each group of rats were stained with an anti-4-HNE antibody; scale bar, 50 μm. (H and J) Quantification of 4-HNE immunoactivity in the CA1 (G) and CA3 (I) regions. The data are presented as the means ± S.E.M.s. Differences in the experimental groups were determined using one-way ANOVA with Tukey's multiple comparisons test. *p < 0.05, ***p < 0.001, ****p < 0.0001, ##p < 0.01, and ####p < 0.0001.
Figure 8
Figure 8
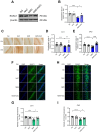
NAC reduces iNOS levels, resulting in neuroprotection in the vHPC. (A) Western blot analysis of iNOS and gp91phox levels in the HPC of each group of rats. (B) Quantification of iNOS immunoreactivity. (C) Quantification of gp91phox immunoreactivity. (D and F) Sections of the vHPC (CA1 and CA3 regions) from each group of rats were stained with an anti-iNOS antibody; scale bar, 50 μm. (E and G) Quantification of iNOS immunoreactivity in the CA1 (D) and CA3 (F) regions. The data are presented as the means ± S.E.M.s. Differences among the experimental groups were determined using one-way ANOVA with Tukey's multiple comparisons test. *p < 0.05, ****p < 0.0001, #p < 0.05, and ####p < 0.0001.
Figure 9
Figure 9
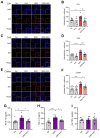
NAC mitigates NMS-induced neuroinflammation. Sections of the rat brain containing the vHPC were stained with an anti-Iba1 antibody. Representative images illustrate the expression of Iba1 in the CA1 (A) and CA3 (C) regions of the vHPC, as well as in the cerebral cortex (E). Scale bar, 50 μm; inset, enlarged areas. Scale bar, 25 μm. (B) Quantitative analysis of the number of activated Iba1+ cells/mm² in A (n=10; *p < 0.05, ##p < 0.01). (D) Quantitative analysis of the number of activated Iba1+ cells/mm² in C (n=10; ****p < 0.0001, ###p < 0.001). (F) Quantitative analysis of the number of activated Iba1+ cells/mm² in E (n=10; ***p < 0.0001, #p < 0.05). ELISAs of cytokine levels in the hippocampus of adolescent animals treated with NAC. (G) Quantitative analysis of the IL-1β concentration (n=8; *p < 0.05 and #p < 0.05). (H) Quantitative analysis of the IL-6 concentration (n=8; ***p < 0.001 and #p < 0.05). (I) Quantitative analysis of the TNFα concentration (n=8; p > 0.05). The bar graph shows the quantification of the data, which are presented as the means ± S.E.M.s. Differences among the experimental groups were determined using one-way ANOVA with Tukey's multiple comparisons test.
Figure 10
Figure 10
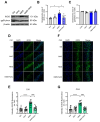
NAC reverses the NMS-induced downregulation of EAAC1 expression in the vHPC. (A) Western blot analysis of EAAC1 levels in the HPC of each group of rats. (B) Quantitative analysis of EAAC1 immunoreactivity in (A). (C) Sections of the vHPC (CA1 and CA3 regions) from each group of rats were stained with an anti-EAAC1 antibody. Scale bar, 50 μm. Quantitative analysis of EAAC1 immunoreactivity in the CA1 (D) and CA3 (E) regions. (F and H) Sections of the rat brain containing the vHPC were stained with an anti-EAAC1 antibody. Scale bar, 50 μm. (G and I) Bar graphs display the results of the quantitative analysis presented as the means ± S.E.M.s. Differences in the experimental groups were determined using one-way ANOVA with Tukey's multiple comparisons test. ***p < 0.001, ****p < 0.0001, #p < 0.05, ##p < 0.01, and ####p < 0.0001.
Figure 11
Figure 11
NAC mitigates depressive-like behaviors in adolescent EAAC1-/- mice. The mice were subjected to the FST and TST. The bar graphs show the immobility time of the mice during the TST (A) and FST (B). The data quantifying depressive-like behaviors are presented as the means ± S.E.M.s. Differences in the experimental groups were determined using one-way ANOVA with Tukey's multiple comparisons test. *p<0.05, ****p<0.0001, and #p < 0.05.
Figure 12
Figure 12
NAC attenuates anhedonic behavior in adolescent EAAC1-/- mice. Adolescent EAAC1+/+ and EAAC1-/- mice were subjected to the SPT. The bar graph shows the % sucrose preference of male mice at 3 hrs (A) and 24 hrs (B). The data quantifying anhedonic behavior are presented as the means ± S.E.M.s. Differences in the experimental groups were determined using one-way ANOVA with Tukey's multiple comparisons test. ***p<0.001, ****p<0.0001, #p<0.05, and ####p<0.0001.
Figure 13
Figure 13
Effects of NAC on impulsive behaviors in adolescent EAAC1-/- mice in the OFT and EPM. The bar graph represents the time spent in the inner zone (A), outer zone (B), and edge zone (C) of the OFT. The data also show the time spent in the open arms (D), closed arms (E), and center zone (F) of the EPM. The data are presented as the means ± S.E.M.s. Differences in the experimental groups were determined using one-way ANOVA with Tukey's multiple comparisons test. *p < 0.05, **p < 0.01, and ***p < 0.001.

References

    1. Smith KE, Pollak SD. Early life stress and development: potential mechanisms for adverse outcomes. J Neurodev Disord. 2020;12(1):34. - PMC - PubMed
    1. Nishi M. Effects of Early-Life Stress on the Brain and Behaviors: Implications of Early Maternal Separation in Rodents. Int J Mol Sci. 2020;21(19):7212. - PMC - PubMed
    1. Harris T, Brown GW, Bifulco A. Loss of parent in childhood and adult psychiatric disorder: the role of lack of adequate parental care. Psychol Med. 1986;16(3):641–59. - PubMed
    1. Agid O, Shapira B, Zislin J, Ritsner M, Hanin B, Murad H. et al. Environment and vulnerability to major psychiatric illness: a case control study of early parental loss in major depression, bipolar disorder and schizophrenia. Mol Psychiatry. 1999;4(2):163–72. - PubMed
    1. Loeber R, Stouthamer-Loeber M. Development of juvenile aggression and violence. Some common misconceptions and controversies. Am Psychol. 1998;53(2):242–59. - PubMed

Substances