. 2024 Oct 14;20(14):5531-5547.
doi: 10.7150/ijbs.99176. eCollection 2024.

Reconstruction of the Hepatic Microenvironment and Pathological Changes Underlying Type II Diabetes through Single-Cell RNA Sequencing

Affiliations

Reconstruction of the Hepatic Microenvironment and Pathological Changes Underlying Type II Diabetes through Single-Cell RNA Sequencing

Chia-Yen Dai et al. Int J Biol Sci. .

Abstract

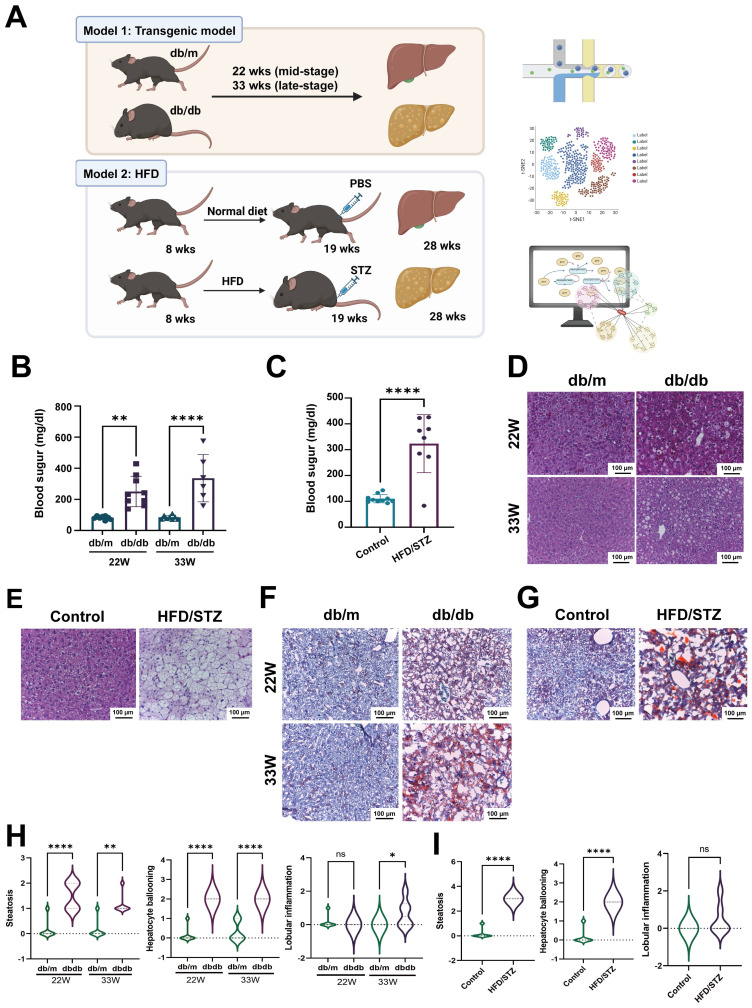
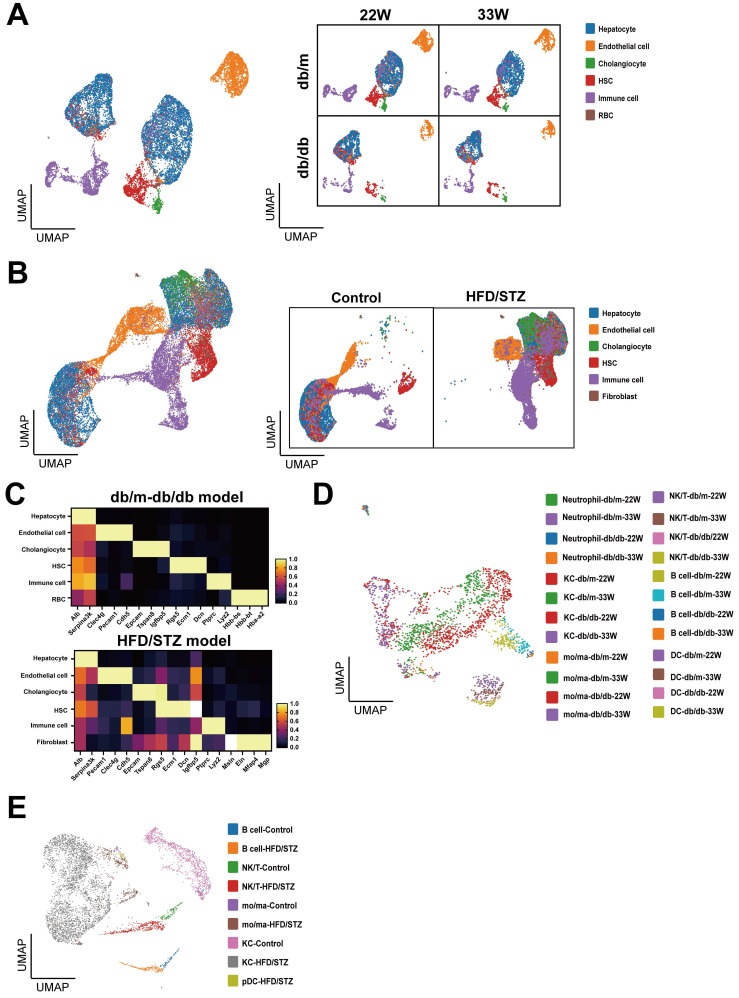
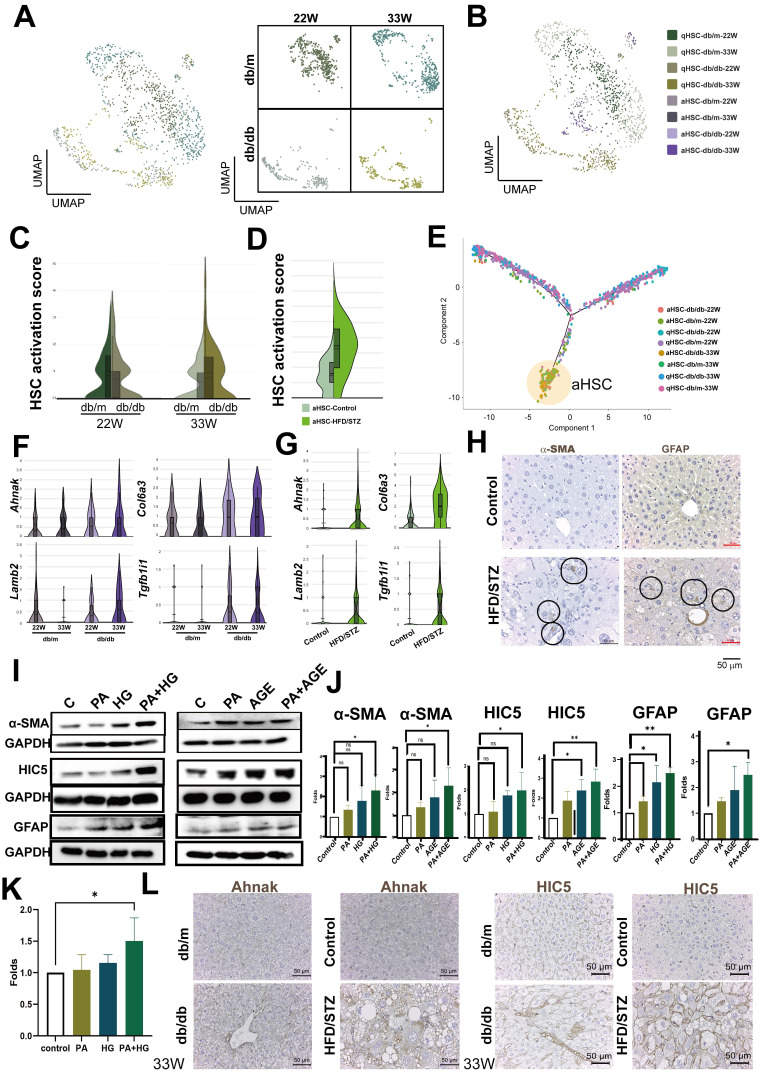
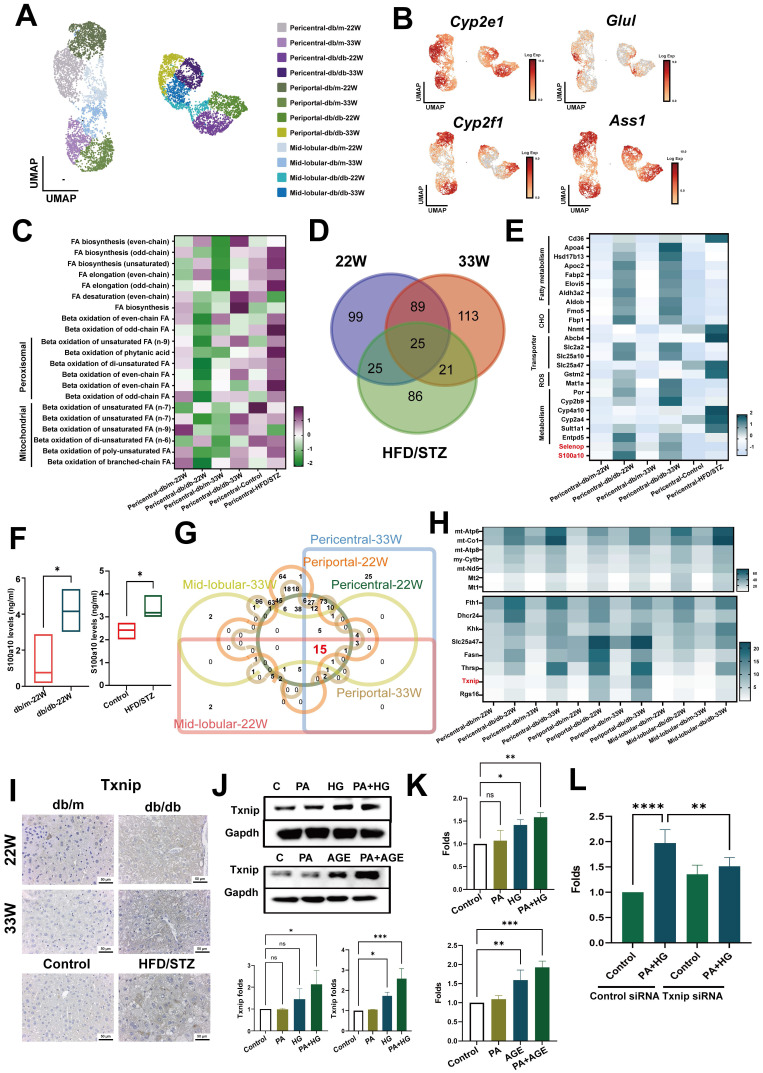
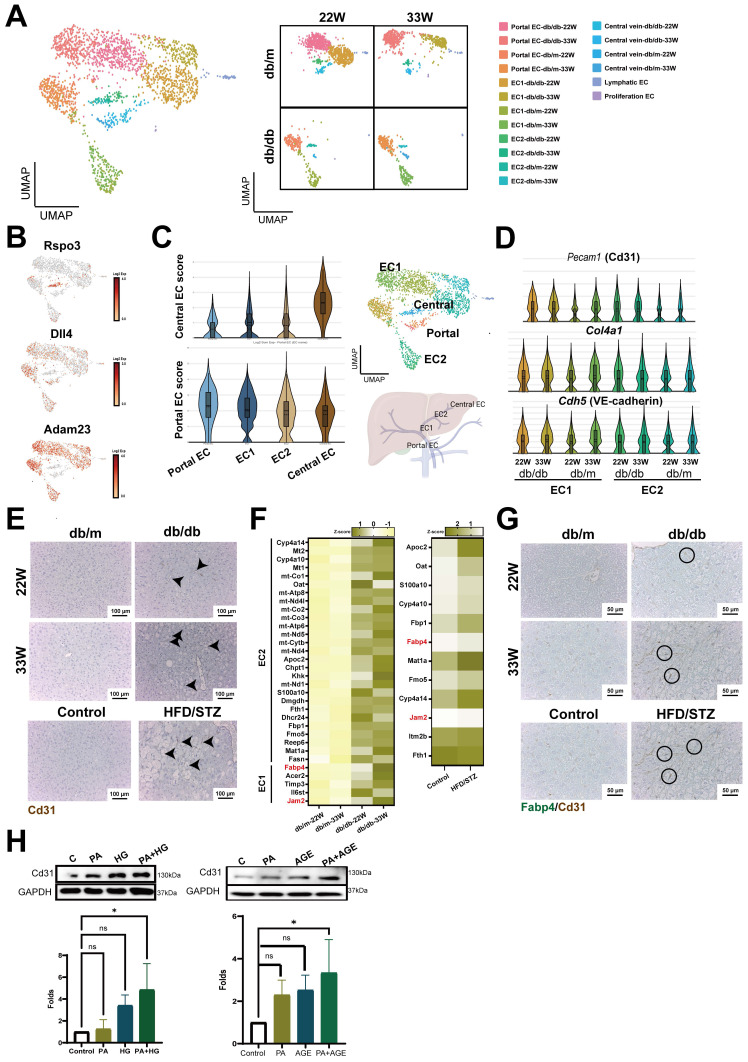
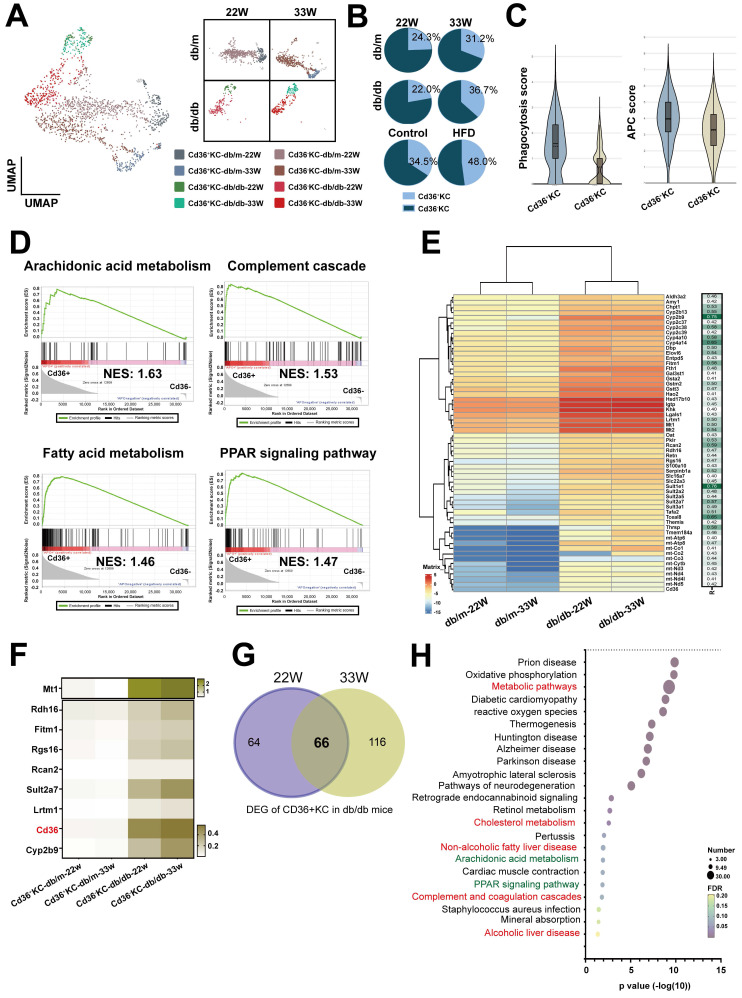
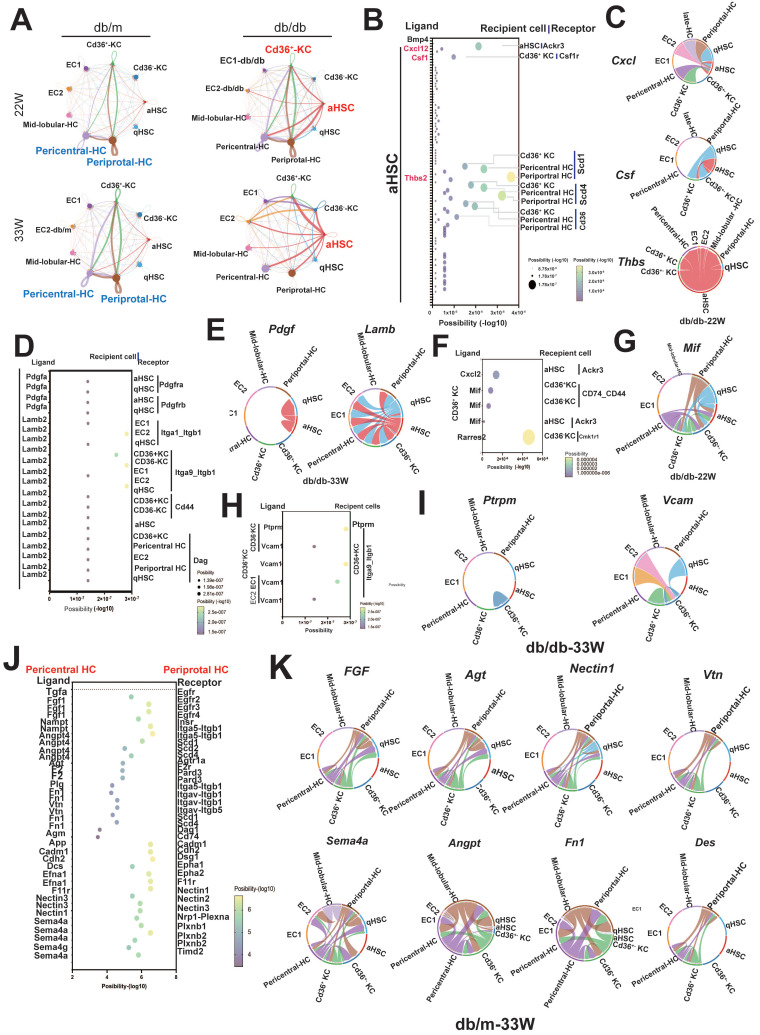
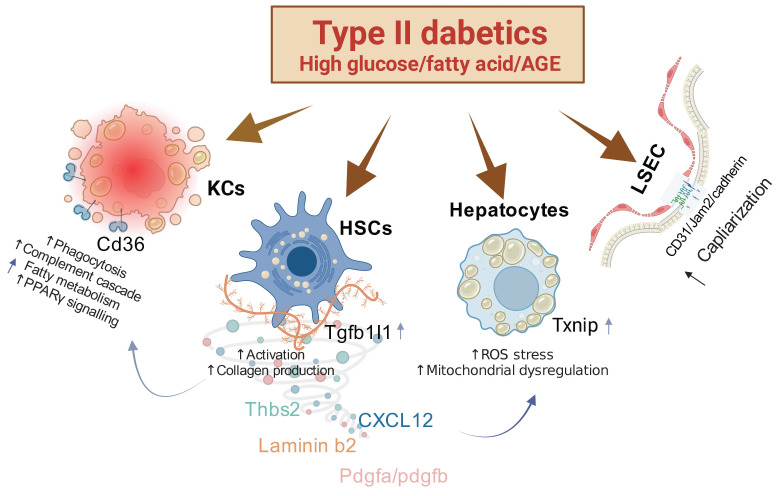
The global prevalence of type 2 diabetes mellitus (T2DM) continues to rise. Therefore, it has become a major concern health issue worldwide. T2DM leads to various complications, including metabolic-associated fatty liver disease (MAFLD). However, comprehensive studies on MAFLD as a diabetic complication at different stages are still lacking. Using advanced single-cell RNA-seq technology, we explored changes of livers in two T2DM murine models. Our findings revealed that increase activation of hepatic stellate cells (HSCs) exacerbated the development of MAFLD to steatohepatitis by upregulating transforming growth factor β1 induced transcript 1 (Tgfb1i1). Upregulated thioredoxin-interacting protein (Txnip) contributed to hepatocyte damage by impairing reactive oxygen species clearance. Additionally, the capillarization of liver sinusoidal endothelial cells correlated with Fabp4 overexpression in endothelial cells. A novel subset of Kupffer cells (KCs) that expressed Cd36 exhibited an activated phenotype, potentially participating in inflammation in the liver of diabetic mice. Furthermore, ligand-receptor pair analysis indicated that activated HSCs interacted with hepatocytes or KCs through Thbs2 and Lamb2 in late-stage diseases. The reduction in cell-cell interactions within hepatocytes in diabetic mice, reflects that the mechanisms regulating liver homeostasis is disrupted. This research underscores the importance of dynamics in diabetic MAFLD, and provides new insights for targeted therapies.

Keywords: Capillarization; MAFLD; T2DM; Tgfb1i1; Txnip.


Conflict of interest statement

Competing Interests: The authors have declared that no competing interest exists.

Figures

Figure 1
Figure 1
Schematic representation of scRNA-seq pipeline using two diabetic models. (A) The flowchart of scRNA-seq analysis of livers harvested from two diabetic mice models. The levels of blood sugar of db/m and db/db mice (B) or HFD/STZ mice (C). The H&E staining of livers of db/m and db/db mice (D) or HFD/STZ mice (E). The oil red staining of livers of db/m and db/db mice (F) or HFD/STZ mice (G). The development of hepatic steatosis, hepatocyte ballooning and lobular inflammation in db/m and db/db mice (H) and HFD/STZ(I) models **, p < 0.01, ****, p < 0.001. Abbreviations: HFD, high-fat diet; STZ, streptozotocin; PBS, phosphate-buffered saline.
Figure 2
Figure 2
Clustering and annotation of single-cell transcriptomes of liver in mice with T2DM. (A) Uniform Manifold Approximation and Projection (UMAP) visualization of livers in db/m and db/db mice at 22W and 33W of age. (B) UMAP visualization of mice liver cells treated with or without HFD/STZ. (C) The cell markers used to cluster main cell subpopulations. The cell clusters of immune cells of db/m and db/db mice (D) or HFD/STZ mice (E). Abbreviations: HSC, hepatic stellate cell; RBC, red blood cell, KC, Kupffer cell; DC, dendritic cell; mo/ma, monocyte/macrophage.
Figure 3
Figure 3
Increased activation of HSCs at the late-stage of T2DM. (A) UMAP plot of HSCs in db/m and db/db mice. (B) Distinction between activated and quiescent HSCs (aHSC and qHSC). (C) Higher activation scores in the HSCs of db/db mice at 33 W of age. (D) Increased activation scores in the HSCs of mice with T2DM using the HFD/STZ model. (E) Transition of HSC activation in the liver of db/db mice. Genes associated with the activation of HSCs in db/db mice (F) and HFD/STZ mice (G). (H) Immunohistochemistry staining shows the increment of HSC activation in the liver of mice with T2DM. Circles indicate activated HSCs in the liver sections. (I) PA (palmitic acid) plus high glucose (HG) or AGEs (Advanced Glycation End-products) increased LX-2 activation and expression of α-SMA, HIC5, and GFAP. LX-2 cells were treated with PA (50 μM) under normal glucose conditions (5.5 mM, control) or high glucose conditions (25 mM, HG) for 48 hours. Alternatively, LX-2 cells were treated with PA, AGE (300 μg/ml), or PA plus AGE under a high glucose condition for 48 hours. Protein expression was analyzed using Western blotting. (J) Quantitative results from Western blot analysis. (K) Upregulated Laminin β2 protein in LX2 induced by PA/HG. (L) The IHC of Ahank and HIC5 expression in liver sections. *, p < 0.05; **, p < 0.01. Expression values are presented as mean ± SD. In vitro experiments were performed with at least three independent replicates.
Figure 4
Figure 4
Txnip contributes to the oxidative stress in hepatocyte of mice with T2DM. (A) UMAP plot of hepatocyte in db/m and db/db mice. (B) The expression of annotation markers. (C) The changes of pericentral hepatocyte in lipid metabolism at different zones. Venn diagram (D) and heatmap (E) represented the genes regulating the different metabolic profiles at different stages of T2DM. (F) The level of S100A10 protein in the serum of mice. Venn diagram (G) and heatmap (H) indicate pan-genes changed in all hepatocytes of mice with T2DM. (I) IHC staining of Txnip in the liver sections. (K) PA plus HG increased the expression of Txnip in AML-12 hepatocytes. (K) PA plus HG (upper) and PA plus AGE (bottom) increased the production of ROS at 24 hours in AML-12 hepatocytes. (L) Knockdown of Tnxip by siRNA transfection decreased ROS production of AML-12 hepatocyte after PA/HG treatment. *, p<0.05; **, p<0.01. Expression values are presented as mean ± SD. In vitro experiments were performed with at least three independent replicates.
Figure 5
Figure 5
Enhanced capillarization of endothelial cells (ECs) in the livers of diabetic mice. (A) UMAP plot of ECs in db/m and db/db mice. (B) The distribution of specific genes associated with central and portal EC. (C) Central or Portal EC score in all cell clusters of ECs. (D) The expression of capillarization markers in the cell clusters of liver EC. (E) IHC represents CD31+ EC in the liver of mice with T2DM. (F) Heatmap of upregulated genes in EC1 and EC2 clusters in mice at 22W and 33W of age. (G) IHC represents CD31+FABP4+ ECs in the liver of mice with T2DM. (H) PA (palmitic acid) plus high glucose (HG) increased the level of CD31 in HHSECs. HHSECs were treated with PA (50 μM) under normal glucose conditions (5.5 mM) or high glucose conditions (25 mM) for 48 hours. Protein expression was analyzed using Western blotting. (I) Quantitative results from Western blot analysis. *, p < 0.05; Expression values are presented as mean ± SD. In vitro experiments were performed with at least three independent replicates.
Figure 6
Figure 6
Increased Cd36+ KCs infiltration in the liver of mice with T2DM. (A) UMAP plot of KCs in db/m and db/db mice. (B) The ratio of Cd36- and Cd36+ KCs in the livers of db/m and db/db mice at 22W and 33W of age. (C) The APC and phagocytosis score of Cd36+ and Cd36- KCs. (D) GSEA of Cd36+ and Cd36- KCs. (E) The genes positively correlated with Cd36 expression in KC cells. (F) Heatmap of genes upregulated in the KCs of mice with T2DM. (G) Venn diagram of DEG of Cd36+ KCs of db/db mice with mid- or late-stages T2DM. (H) The KEGG pathways of 66 genes upregulated in Cd36+ KCs of mice with T2DM. Abbreviations: APC, antigen-presenting cell; GSEA, gene set enrichment analysis; DEG, differentially expressed gene.
Figure 7
Figure 7
The cell-cell interaction in the hepatic microenvironment of mice with T2DM. (A) The cell-cell communications in the livers of db/m and db/db mice at 22W and 33W of age. (B) The interaction of aHSCs with hepatocytes and KCs in the livers of mice at 22W of age. (C) The chord diagram visualizes the cell-cell communication in Cxcl, Csf, and Thbs2. (D) The cell communication of aHSCs with other cell types in the livers of mice at 33W of age. (E) The chord diagram visualizes the cell-cell communication in Pdgf and Lamb. (F) The intercellular signaling between Cd36+ KCs with other cell types in livers of mice at 22W of age. (G) The chord diagram represents the interaction mediated by Mif. (H) The intercellular signaling between Cd36+ KCs with other cell types in the liver of mice at 33W of age. (I) The chord diagram represents the interaction mediated by Ptprm and Vcam. (J) Loss of intercellular signaling in the hepatocyte in the mice with T2DM. (K) The chord diagram represents the signaling pathways loss in the liver of mice with T2DM.
Figure 8
Figure 8
Mechanisms of Action in Liver Pathophysiology Associated with Type II Diabetes. This figure illustrates several key pathological changes linked to type II diabetes in the liver. First, the overactivity of hepatic stellate cells (HSCs) is notably enhanced by the protein HIC5. Second, the overexpression of TXNIP compromises the liver's antioxidant defenses, leading to an increase in reactive oxygen species (ROS) stress and subsequent alterations in hepatocyte function. Third, an increase in the capillarization of liver sinusoidal endothelial cells (LSECs) is associated with heightened expression of FABP4. These pathological shifts are particularly severe under combined conditions of high fat and high glucose or high fat and advanced glycation end-products (AGEs), indicating a synergistic exacerbation of liver pathology under these dietary stresses.

Similar articles

References

    1. Kumar S, Duan Q, Wu R. et al. Pathophysiological communication between hepatocytes and non-parenchymal cells in liver injury from NAFLD to liver fibrosis. Adv Drug Deliv Rev. 2021;176:113869. - PMC - PubMed
    1. Younossi Z, Anstee QM, Marietti M. et al. Global burden of NAFLD and NASH: trends, predictions, risk factors and prevention. Nat Rev Gastroenterol Hepatol. 2018;15:11–20. - PubMed
    1. Marušić M, Paić M, Knobloch M. et al. NAFLD, Insulin Resistance, and Diabetes Mellitus Type 2. Can J Gastroenterol Hepatol. 2021;2021:6613827. - PMC - PubMed
    1. Stefan N, Cusi K. A global view of the interplay between non-alcoholic fatty liver disease and diabetes. Lancet Diabetes Endocrinol. 2022;10:284–296. - PubMed
    1. Kumar V, Xin X, Ma J. et al. Therapeutic targets, novel drugs, and delivery systems for diabetes associated NAFLD and liver fibrosis. Adv Drug Deliv Rev. 2021;176:113888. - PMC - PubMed