

Early regional cerebral grey matter damage predicts long-term cognitive impairment phenotypes in multiple sclerosis: a 20-year study
- PMID: 39494361
- PMCID: PMC11528517
- DOI: 10.1093/braincomms/fcae355
Early regional cerebral grey matter damage predicts long-term cognitive impairment phenotypes in multiple sclerosis: a 20-year study
Abstract
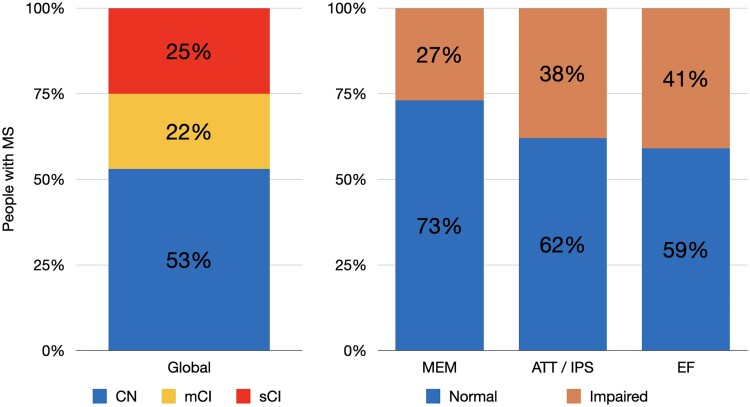
Despite grey matter atrophy in cortical and subcortical regions has been related to cognitive impairment in multiple sclerosis, only a few studies evaluated its predictive value for alterations in the long-term. We aimed to determine early predictors of cognitive status after 20 years of multiple sclerosis. In this longitudinal retrospective study, participants underwent a 1.5 T MRI scanning at diagnosis (T0) and after two years (T2), which included the evaluation of regional grey matter volume loss patterns. All individuals with multiple sclerosis underwent a comprehensive neuropsychological assessment at the end of the study and were classified considering their global and specific cognitive domains status (memory, attention/information processing speed, executive functioning). Clinical and MRI characteristics were assessed as predictors of long-term cognitive impairment. Analysis of covariance, t-test, unadjusted and adjusted (for age, sex, disease duration, volume of white matter lesions, volume of cortical lesions) logistic regression were conducted. One hundred seventy-five people with multiple sclerosis (118 females; mean ± SD age at the end of study = 47.7 ± 9.4 years) clinically followed for 20 years from onset (mean ± SD = 19.9 ± 5.1) were evaluated. At the end of the study, 81 (47%) were classified as cognitively impaired: 38 as mildly impaired (22%), and 43 as severely impaired (25%). In particular, 46 were impaired in memory (27%), 66 were impaired in attention/information processing speed (38%), and 71 were impaired in executive functioning (41%). Regression models identified precuneus (adjusted odds ratio = 3.37; P < 0.001), insula (adjusted odds ratio = 2.33; P = 0.036), parahippocampal gyrus (adjusted odds ratio = 2.07; P < 0.001) and cingulate (adjusted odds ratio = 1.81; P = 0.009) as the most associated regions with global cognitive impairment and domains-specific cognitive alterations after a mean of 20 years of multiple sclerosis, after adjusting for demographic and clinical variables as well as for focal white matter and grey matter damage. Early grey matter volume loss of specific cortical and deep grey matter regions predicts global and domain cognitive alterations after 20 years from multiple sclerosis diagnosis.
Keywords: cognitive impairment; multiple sclerosis; regional atrophy.
© The Author(s) 2024. Published by Oxford University Press on behalf of the Guarantors of Brain.
Conflict of interest statement
The authors report no competing interests.
Figures


References
-
- Calabrese M, Magliozzi R, Ciccarelli O, Geurts JJG, Reynolds R, Martin R. Exploring the origins of grey matter damage in multiple sclerosis. Nat Rev Neurosci. 2015;16(3):147–158. - PubMed
-
- Steenwijk MD, Geurts JJ, Daams M, et al. Cortical atrophy patterns in multiple sclerosis are non-random and clinically relevant. Brain. 2016;139:115–126. - PubMed
LinkOut - more resources
Full Text Sources