. 2024 Dec;11(47):e2401039.
doi: 10.1002/advs.202401039. Epub 2024 Nov 4.

Very Low-Intensity Ultrasound Facilitates Glymphatic Influx and Clearance via Modulation of the TRPV4-AQP4 Pathway

Affiliations

Very Low-Intensity Ultrasound Facilitates Glymphatic Influx and Clearance via Modulation of the TRPV4-AQP4 Pathway

Chueh-Hung Wu et al. Adv Sci (Weinh). 2024 Dec.

Abstract

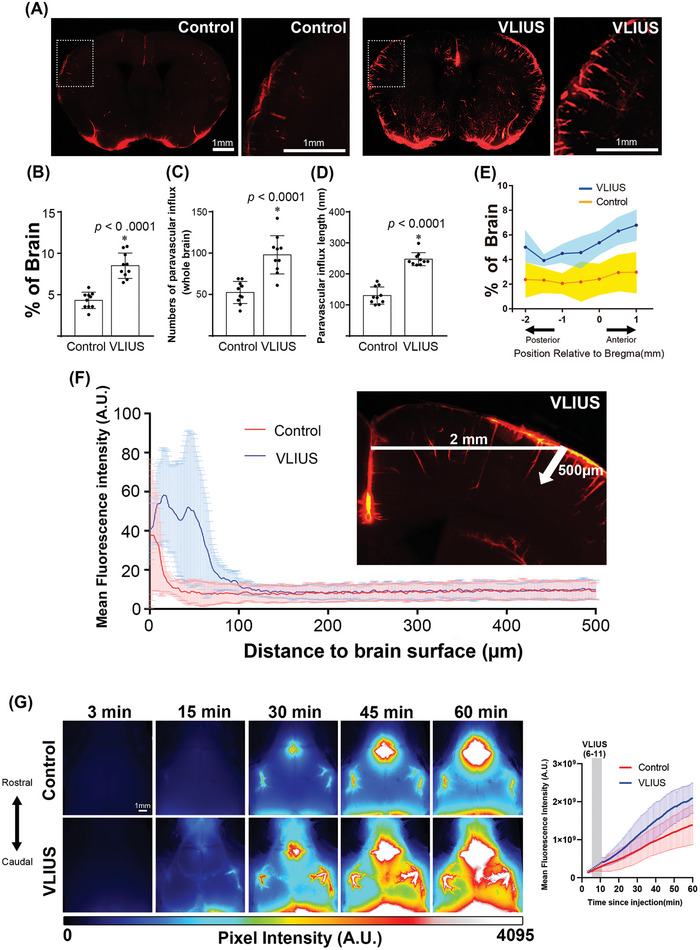
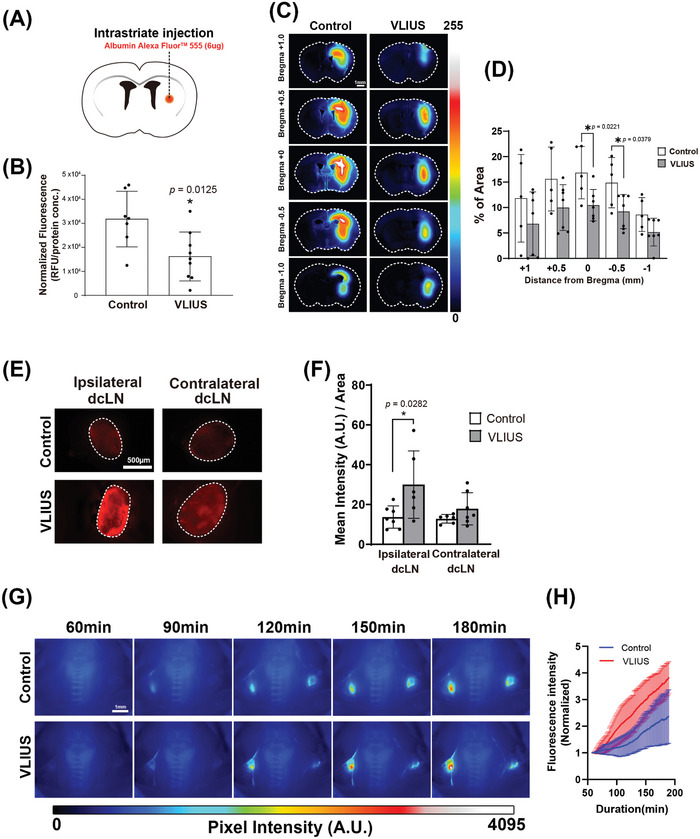
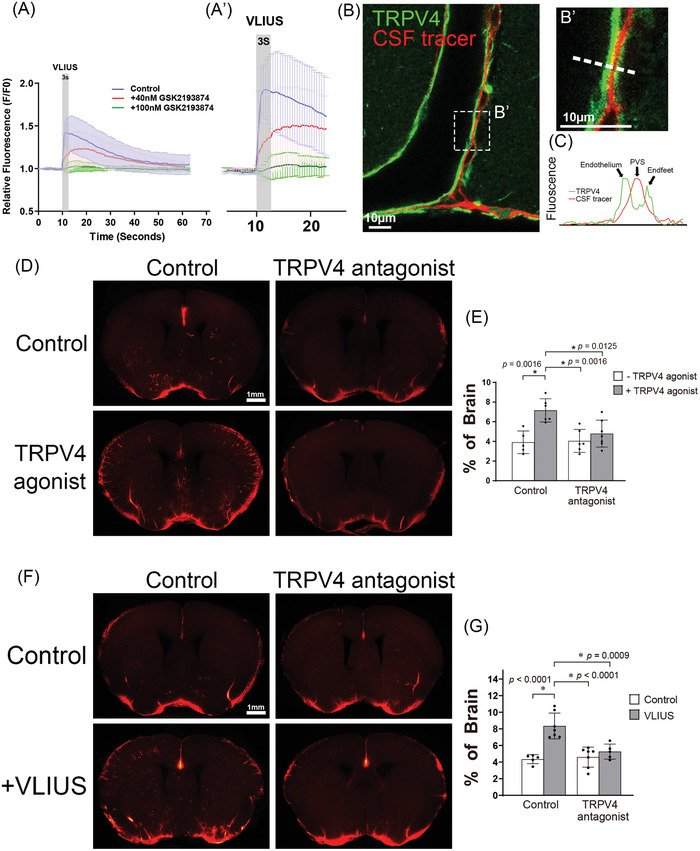
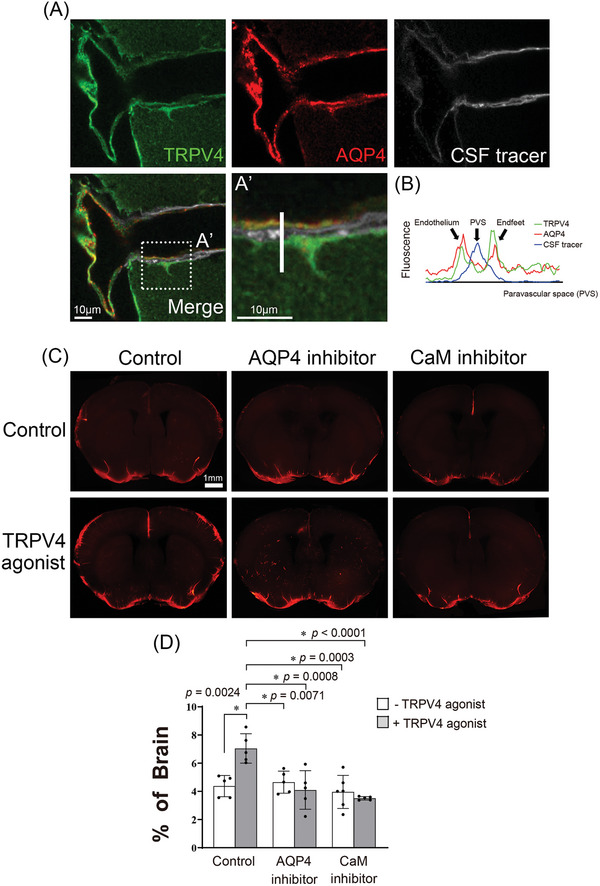
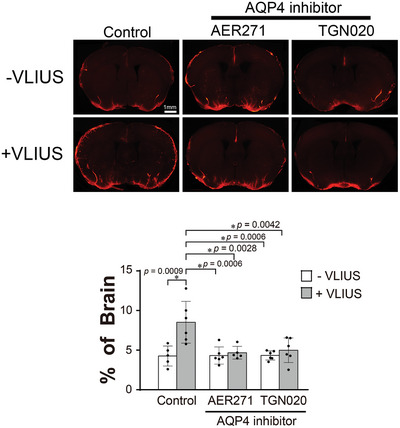
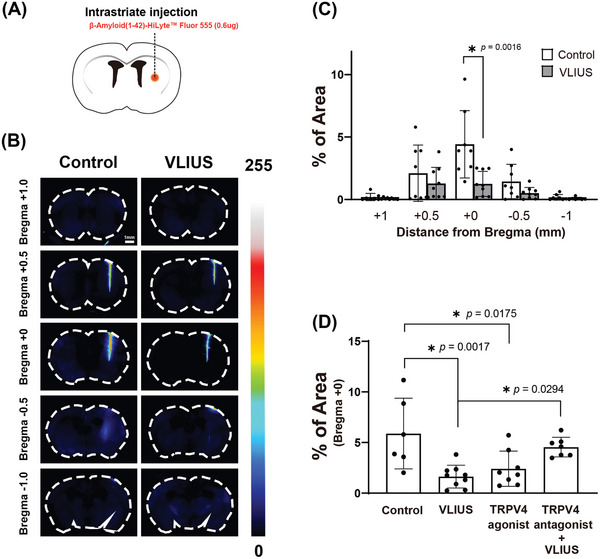
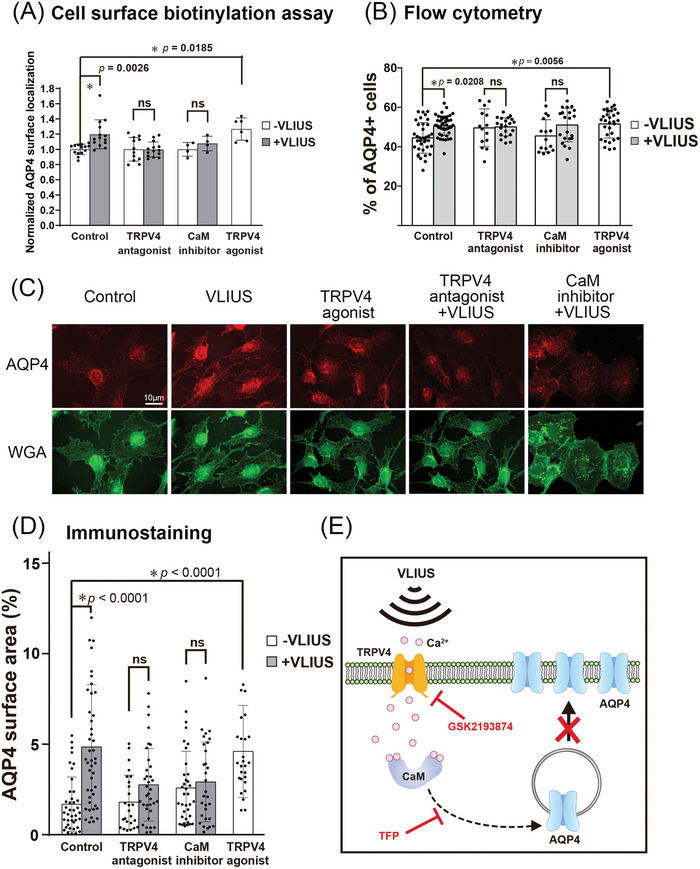
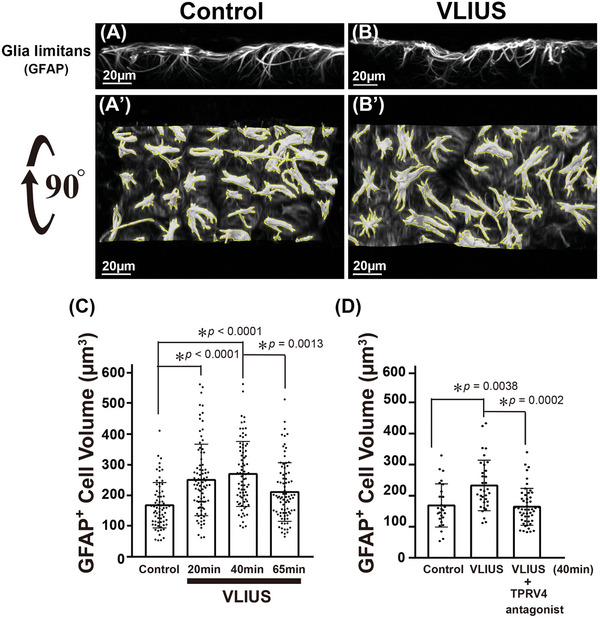
Recently, the glymphatic system has been proposed as a mechanism for waste clearance from the brain parenchyma. Glymphatic dysfunction has previously been shown to be associated with several neurological diseases, including Alzheimer's disease, traumatic brain injury, and stroke. As such, it may serve as an important target for therapeutic interventions. In the present study, very low-intensity ultrasound (VLIUS) (center frequency, 1 MHz; pulse repetition frequency, 1 kHz; duty factor, 1%; spatial peak temporal average intensity [Ispta] = 3.68 mW cm2; and duration, 5 min) is found to significantly enhance the influx of cerebrospinal fluid tracers into the paravascular spaces of the brain, and further facilitate interstitial substance clearance from the brain parenchyma, including exogenous β-amyloid. Notably, no evidence of brain damage is observed following VLIUS stimulation. VLIUS may enhance glymphatic influx via the transient receptor potential vanilloid-4-aquaporin-4 pathway in astrocytes. This mechanism may provide insights into VLIUS-regulated glymphatic function that modifies the natural course of central nervous system disorders related to waste clearance dysfunction.

Keywords: aquaporin‐4; glymphatic; transient receptor potential vanilloid‐4; ultrasound; β‐amyloid.


Conflict of interest statement

The authors declare no conflict of interest.

Figures

Figure 1
Figure 1
VLIUS stimulation increases CSF tracer influx. A) Representative images of coronal brain sections +0 mm from the bregma showing an increase in CSF tracer penetrance in response to very low‐intensity ultrasound (VLIUS) compared to controls. Scale bar: 1 mm. Quantification of the influx area B), influx numbers C), and influx length D) of VLIUS stimulation compared to controls: dots represent individual mice in each group. n = 10 mice/group; two independent repeats of n = 5 mice per group; E) Positional slice‐by‐slice representation of the area covered by tracer influx in coronal brain slices relative to the bregma. The solid line represents the percentage of the average tracer influx of all brain slices at that section per condition (shaded area = ±STDEV). n = 10 mice/group; two independent repeats of n = 5 mice per group F) Tracer penetration depth is measured at the cortical position 2 mm lateral to the midline, from the pial surface to a depth of 500 µm in the coronal section. Quantification of the mean fluorescence intensity of the tracer indicates that VLIUS stimulation induces greater penetration of the tracer deep into the brain (n = 5, respectively). G) Representative time‐lapse images of CSF influx over the first 60 min immediately following tracer injection in control and VLIUS‐stimulated mice. Images (16‐bit pixel depth) are color coded (royal form ImageJ) to depict pixel intensity (PI) in arbitrary units (AU). CSF, cerebrospinal fluid; VLIUS, very low intensity ultrasound. Scale bar: 1 mm. The results, for which the data are presented as mean ± SD (error bars denote SD), shown in Figure 1 (B, C, D) were analyzed using an independent t‐test to assess between‐group differences. An asterisk indicates p < 0.05.
Figure 2
Figure 2
Increased interstitial fluid clearance observed through VLIUS stimulation. A) Schematic of the experiment. B) Three hours after injection, the remaining tracer is significantly lower in very low‐intensity ultrasound (VLIUS)‐stimulated mouse brains compared with controls (p = 0.0125, control group n = 7, VLIUS group n = 9), indicating that the clearance rate may be higher under VLIUS stimulation. Representative images C) and quantification of tracer area percentage D) in the coronal brain sections at different distances from the bregma reveal a reduction in the remaining tracer within the brain parenchyma in response to VLIUS compared to the control group. Scale bar: 1 mm. Representative images E) and quantification of tracer intensity F) of deep cervical lymph nodes (dcLN) three hours post‐intraparenchymal tracer injection showing a statistically significant increase in tracer intensity in the VLIUS group, indicating that the clearance rate may be higher under VLIUS stimulation. Scale bar: 500 µm. Representative time‐lapse images G) and quantification of tracer intensity H) from 60 to 180 min following tracer injection revealed a faster and higher increase in dcLN tracer intensity in the VLIUS group. Images (16‐bit pixel depth) are color coded (royal form ImageJ) to depict pixel intensity (PI) in arbitrary units (AU). Scale bar: 1 mm. The results, for which the data are presented as mean ± SD (error bars denote SD), shown in Figure 2 (B, D) and 2 (F) were analyzed using an independent t‐test and ANOVA followed by Tukey's post‐hoc test, to assess between‐group differences. An asterisk indicates p < 0.05.
Figure 3
Figure 3
VLIUS promotes glymphatic function through the activation of TRPV4. A and A’) The calcium influx elevated by very low‐intensity ultrasound (VLIUS) stimulation was inhibited in a dose‐dependent manner by treatment with a transient receptor potential vanilloid‐4 (TRPV4) antagonist. B and B’) Along the cortical surface arteries, the cerebrospinal fluid (CSF) tracer (red) can be observed in the paravascular space, and TRPV4 (green) is expressed on endothelium and astrocytic endfeet. Scale bar: 10 µm. C) Representative images depicting fluorescence intensity projections from B'), indicated by white rectangles. D) The TRPV4 agonist (GSK1016790A) promoted CSF tracer permeability, which was inhibited by the co‐administered TRPV4 antagonist (GSK2193874). Scale bar: 1 mm. E) Quantification of the influx areas of various groups from D); the dots represent individual mice in each group (control group, n = 5; TRPV4 agonist group, n = 6; TRPV4 antagonist group, n = 6; and TRPV4 agonist + antagonist group, n = 7). F) VLIUS‐facilitated CSF permeability is inhibited by a TRPV4 antagonist. Scale bar: 1 mm. G) Quantification of the influx areas of various groups from F); the dots represent individual mice in each group (control group, n = 5; VLIUS group, n = 7; TRPV4 antagonist group, n = 7; and TRPV4 VLIUS + antagonist group, n = 5). Significant differences (analysis of variance with post hoc Tukey's test) are indicated with asterisks. The results, for which the data are presented as mean ± SD (error bars denote SD), shown in Figure 3(E) and (G) were analyzed using ANOVA followed by Tukey's post‐hoc test to assess between‐group differences. An asterisk indicates p < 0.05.
Figure 4
Figure 4
AQP4 is involved in TRPV4‐facilitated glymphatic circulation. A) Transient receptor potential vanilloid‐4 (TRPV4) and aquaporin‐4 (AQP4) co‐localized within the paravascular space of the adult mouse brain. In single‐plane confocal immunofluorescence images of cerebral surface artery, triple labeling with rabbit anti‐TRPV4 (green), mouse anti‐AQP4 (red), and cerebrospinal fluid (CSF) tracer (white) show the astrocyte endfeet and endothelial cells processes that are immunopositive for TRPV4 and AQP4. Scale bar: 10 µm. B) Representative images depict fluorescence intensity projections from A'), as indicated by a white line. Fluorescence imaging C) and quantification of the area covered by tracer influx D) in coronal brain slices show that 30 min after intracisternal injection, paravascular CSF influx increases with the administration of TRPV4 agonists, and does not increase with the co‐administration of the AQP4 inhibitor (AER271) or calmodulin inhibitor (trifluoperazine). The dots represent individual mice in each group (control group n = 5, TRPV4 agonist group n = 5, AQP4 inhibitor group n = 5, AQP4 inhibitor + TRPV4 agonist group n = 5, CaM inhibitor group n = 6, CaM inhibitor + TRPV4 agonist group n = 6). Scale bar: 1 mm. The results, for which the data are presented as mean ± SD (error bars denote SD), shown in Figure 4(D) were analyzed using ANOVA followed by Tukey's post‐hoc test to assess between‐group differences. An asterisk indicates p < 0.05.
Figure 5
Figure 5
The role of AQP4 in VLIUS‐induced glymphatic circulation. Fluorescence imaging and quantification of the area covered by the tracer influx in coronal brain slices revealed that 30 min after intracisternal injection, paravascular cerebrospinal fluid influx increased with very low‐intensity ultrasound (VLIUS) stimulation, and did not increase with the co‐administration of an aquaporin‐4 (AQP4) inhibitor (AER271 and TGN020). Dots represent individual mice in each group (control group, n = 5; VLIUS group, n = 6; AQP4 inhibitor group, n = 6; and AQP4 inhibitor + VLIUS group, n = 5). Scale bar: 1 mm. The results, for which the data are presented as the mean ± SD (error bars denote SD), were analyzed using ANOVA followed by Tukey's post‐hoc test to assess between‐group differences. An asterisk indicates p < 0.05.
Figure 6
Figure 6
TRPV4 is involved in the VLIUS‐facilitated clearance of β‐amyloid (1‐42). A) Schematic of the experiments. Representative images B) and quantification of β‐amyloid (1‐42) area percentage C) in coronal brain sections at different distances from the bregma reveal a reduction in the β‐amyloid (1‐42) remaining within the brain parenchyma in response to VLIUS compared to the control group. Scale bar: 1 mm. D) Both VLIUS and the TRPV4 agonists (GSK1016790A) promoted β‐amyloid (1‐42) clearance. VLIUS‐promoted clearance was inhibited by co‐administration of a TRPV4 antagonist (GSK2193874). Dots represent individual mice in each group (control group, n = 6; VLIUS group, n = 9; TRPV4 agonist group, n = 8; and TRPV4 antagonist + VLIUS group, n = 7). The results, for which the data are presented as the mean ± SD (error bars denote SD), shown in Figure 6(C) and (D) were analyzed using the Mann‐Whitney U test and ANOVA followed by Tukey's post‐hoc test, respectively, to assess between‐group differences. An asterisk indicates p < 0.05.
Figure 7
Figure 7
AQP4 protein translocation to the cell surface increased after VLIUS stimulation. A) The mean fold change in aquaporin‐4 (AQP4) surface expression, measured by cell‐surface biotinylation in C6 cells. The calmodulin (CaM) inhibitor was 20.8 µM trifluoperazine (TFP). The transient receptor potential vanilloid‐4 (TRPV4) antagonist was 100 nM GSK2193874, while the TRPV4 agonist was 2 µM GSK1016790A. Cells had been pre‐incubated with drug 30 min before very low‐intensity ultrasound (VLIUS) treatment. AQP4 on the cell surface significantly increases after treatment with VLIUS or TRPV4 agonist. However, administration of TRPV4 antagonist or CaM inhibitor inhibits VLIUS‐facilitated AQP4 cell surface localization. B) The AQP4 surface expression is analyzed by flow cytometry (without permeabilization). The population of AQP4‐positive cells was significantly increased by VLIUS or TRPV4 agonists. Administration of TRPV4 antagonist or CaM inhibitor inhibits the VLIUS effect. C) AQP4 on the cell surface can also be observed by immunofluorescence staining (without permeabilization). Cells had been counterstained by WGA‐conjugated Alexa Fluor™ 488 to determine cell boundaries. Scale bar: 10 µm. D) Quantification of AQP4 on the cell surface using immunofluorescence staining. E) The schematic showing that both the CaM inhibitor and the TRPV4 antagonist can inhibit VLIUS‐induced AQP4 translocation to the cell surface. The results, for which the data are presented as the mean ± SD (error bars denote SD), shown in Figure 7 (A,B,D) were analyzed using Kruskal‐Wallis test followed by Dunn's post‐hoc test to assess between‐group differences. An asterisk indicates p < 0.05.
Figure 8
Figure 8
The volume of astrocytes in the glia limitans are altered following VLIUS stimulation. Reconstruction of 3D images from confocal microscopy using Imaris software, and are shown as control A), very low‐intensity ultrasound (VLIUS) B), and 90° rotated images A') and B'). Scale bar: 20 µm. The yellow line represents the analysis of each intact cell (with the same threshold) using the surface creation wizard of Imaris software. Quantification shows that cell volume was altered by VLIUS stimulation C), and this effect was blocked by a transient receptor potential vanilloid‐4 (TRPV4) antagonist D). Dots represent individual intact cells in each group. The results, for which the data are presented as the mean ± SD (error bars denote SD), shown in Figure 8 (C) and (D) were analyzed using the Kruskal‐Wallis test followed by Dunn's post‐hoc test, and ANOVA followed by Tukey's post‐hoc test, respectively, to assess between‐group differences. An asterisk indicates p < 0.05.

References

    1. a) Iliff J. J., Wang M., Liao Y., Plogg B. A., Peng W., Gundersen G. A., Benveniste H., Vates G. E., Deane R., Goldman S. A., Nagelhus E. A., Nedergaard M., Sci. Transl. Med. 2012, 4, 147ra111; - PMC - PubMed
    2. b) Iliff J. J., Lee H., Yu M., Feng T., Logan J., Nedergaard M., Benveniste H., J. Clin. Invest. 2013, 123, 1299; - PMC - PubMed
    3. c) Nedergaard M., Science. 2013, 340, 1529; - PMC - PubMed
    4. d) Xie L., Kang H., Xu Q., Chen M. J., Liao Y., Thiyagarajan M., O'Donnell J., Christensen D. J., Nicholson C., Iliff J. J., Takano T., Deane R., Nedergaard M., Science. 2013, 342, 373; - PMC - PubMed
    5. e) Plog B. A., Dashnaw M. L., Hitomi E., Peng W., Liao Y., Lou N., Deane R., Nedergaard M., J. Neurosci. 2015, 35, 518. - PMC - PubMed
    1. a) Peng W., Achariyar T. M., Li B., Liao Y., Mestre H., Hitomi E., Regan S., Kasper T., Peng S., Ding F., Benveniste H., Nedergaard M., Deane R., Neurobiol. Dis. 2016, 93, 215; - PMC - PubMed
    2. b) Reeves B. C., Karimy J. K., Kundishora A. J., Mestre H., Cerci H. M., Matouk C., Alper S. L., Lundgaard I., Nedergaard M., Kahle K. T., Trends Mol. Med. 2020, 26, 285. - PMC - PubMed
    1. a) Iliff J. J., Chen M. J., Plog B. A., Zeppenfeld D. M., Soltero M., Yang L., Singh I., Deane R., Nedergaard M., J. Neurosci. 2014, 34, 16180; - PMC - PubMed
    2. b) Sullan M. J., Asken B. M., Jaffee M. S., DeKosky S. T., Bauer R. M., Neurosci. Biobehav. Rev. 2018, 84, 316. - PubMed
    1. a) Mestre H., Du T., Sweeney A. M., Liu G., Samson A. J., Peng W., Mortensen K. N., Staeger F. F., Bork P. A. R., Bashford L., Toro E. R., Tithof J., Kelley D. H., Thomas J. H., Hjorth P. G., Martens E. A., Mehta R. I., Solis O., Blinder P., Kleinfeld D., Hirase H., Mori Y., Nedergaard M., Science. 2020, 367, aax7171; - PMC - PubMed
    2. b) Goulay R., Flament J., Gauberti M., Naveau M., Pasquet N., Gakuba C., Emery E., Hantraye P., Vivien D., Aron‐Badin R., Gaberel T., Stroke. 2017, 48, 2301. - PubMed
    1. Schain A. J., Melo‐Carrillo A., Strassman A. M., Burstein R., J. Neurosci. 2017, 37, 2904. - PMC - PubMed

LinkOut - more resources