. 2024 Nov 1;41(11):msae233.
doi: 10.1093/molbev/msae233.

Rewiring of Uric Acid Metabolism in the Intestine Promotes High-Altitude Hypoxia Adaptation in Humans

Affiliations

Rewiring of Uric Acid Metabolism in the Intestine Promotes High-Altitude Hypoxia Adaptation in Humans

Qian Su et al. Mol Biol Evol. .

Abstract

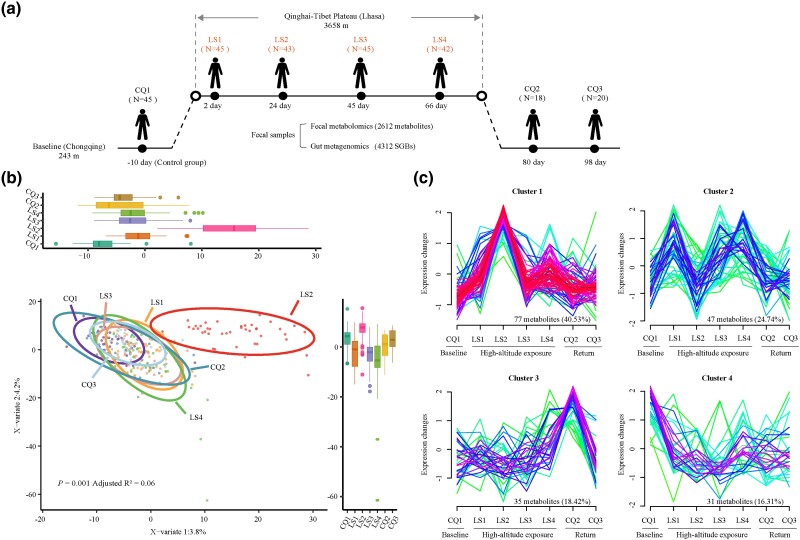
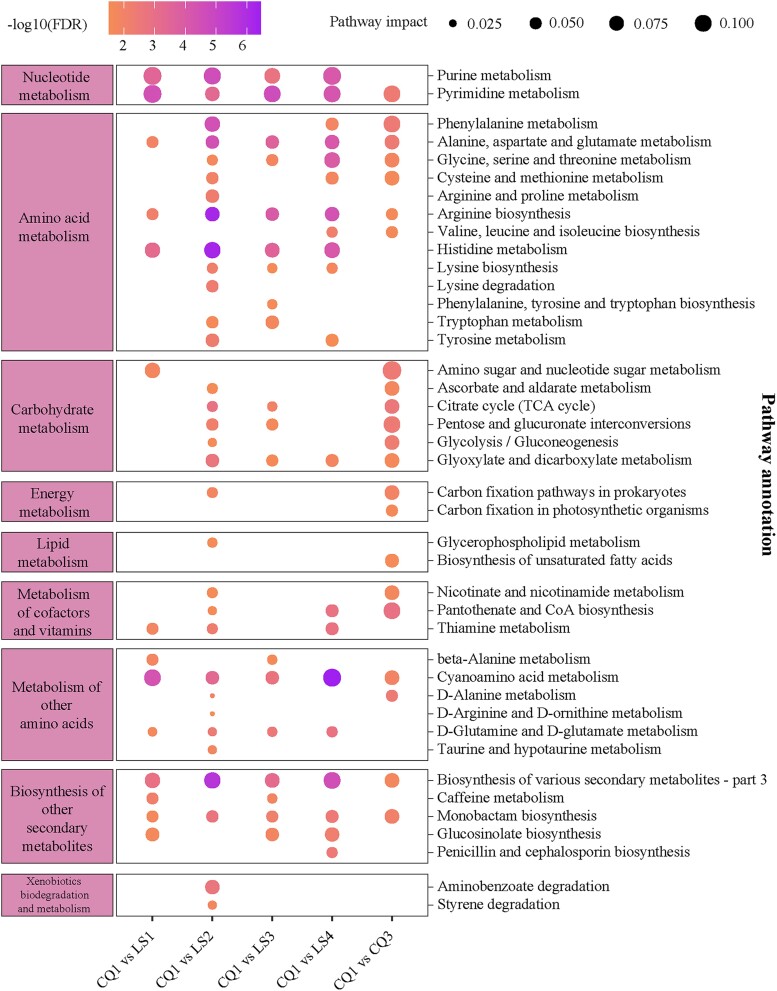
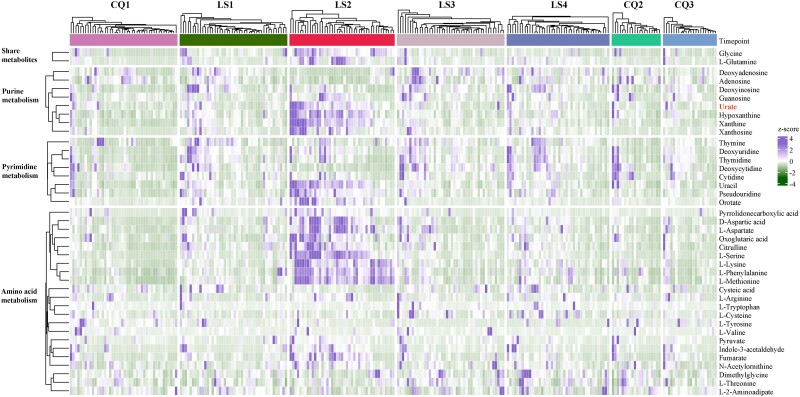
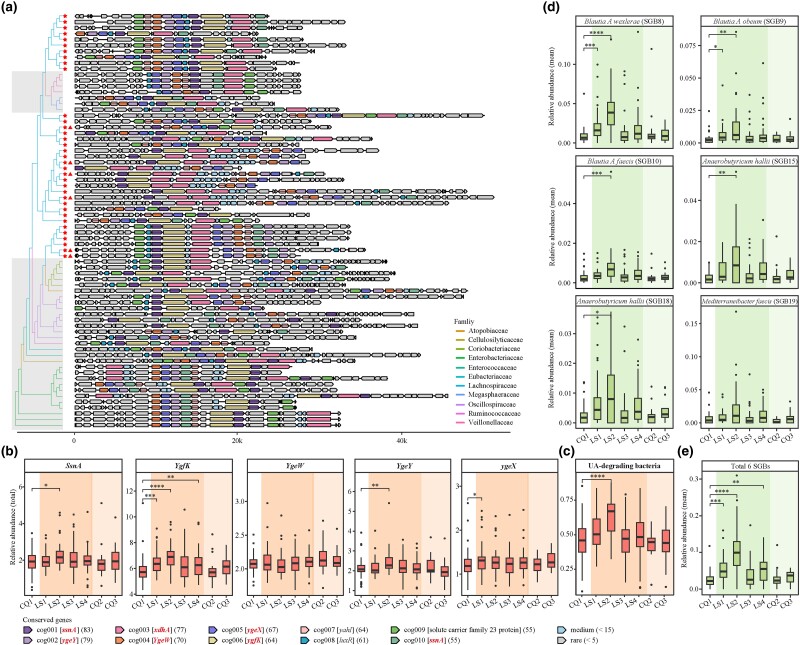
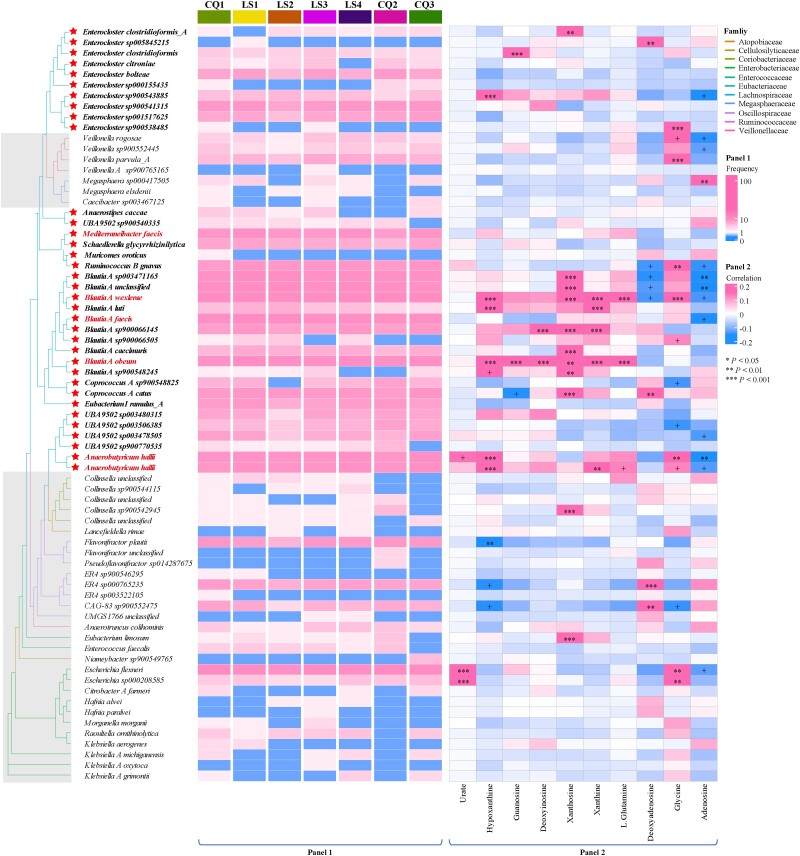
Adaptation to high-altitude hypoxia is characterized by systemic and organ-specific metabolic changes. This study investigates whether intestinal metabolic rewiring is a contributing factor to hypoxia adaptation. We conducted a longitudinal analysis over 108 days, with seven time points, examining fecal metabolomic data from a cohort of 46 healthy male adults traveling from Chongqing (a.s.l. 243 m) to Lhasa (a.s.l. 3,658 m) and back. Our findings reveal that short-term hypoxia exposure significantly alters intestinal metabolic pathways, particularly those involving purines, pyrimidines, and amino acids. A notable observation was the significantly reduced level of intestinal uric acid, the end product of purine metabolism, during acclimatization (also called acclimation) and additional two long-term exposed cohorts (Han Chinese and Tibetans) residing in Shigatse, Xizang (a.s.l. 4,700 m), suggesting that low intestinal uric acid levels facilitate adaptation to high-altitude hypoxia. Integrative analyses with gut metagenomic data showed consistent trends in intestinal uric acid levels and the abundance of key uric acid-degrading bacteria, predominantly from the Lachnospiraceae family. The sustained high abundance of these bacteria in the long-term resident cohorts underscores their essential role in maintaining low intestinal uric acid levels. Collectively, these findings suggest that the rewiring of intestinal uric acid metabolism, potentially orchestrated by gut bacteria, is crucial for enhancing human resilience and adaptability in extreme environments.

Keywords: UA-degrading bacteria; high-altitude hypoxia; human acclimatization; intestinal UA; metabolic rewiring.


Conflict of interest statement

Conflict of Interests The authors declare that they have no competing interests.

Figures

Fig. 1.
Fig. 1.
Study design and fecal metabolite dynamics during high-altitude hypoxia. a) Diagrammatic representation of the study design, illustrating exposure to high-altitude hypoxia and the ensuing comprehensive longitudinal analysis of fecal metabolomics and metagenomics. b) PLS-DA score plot of 2311 identified fecal metabolites from 260 samples. Each point denotes an individual sample, with color coding reflecting different time points, and coordinates values for each sample at each time point depicted in boxplots. c) Cluster analysis of 190 significant fecal metabolites (fold change > 1, VIP > 1, FDR < 0.2), illustrating their temporal patterns associated with hypoxic exposure.
Fig. 2.
Fig. 2.
KEGG pathway-based functional profiling of fecal metabolites. A bubble plot illustrates the significantly enriched KEGG pathways at various time points. The CQ2 time point is omitted due to the absence of significant pathway enrichment compared to the baseline. The left and right panels categorize the pathways according to KEGG metabolic categories: Levels B and C, respectively. In the central panel, bubble colors indicate the significance of enrichment relative to the baseline, while bubble sizes reflect the proportion of metabolites associated with each pathway. Enrichment significance (FDR) is calculated using Fisher's exact test (see “Materials and Methods”).
Fig. 3.
Fig. 3.
Core metabolites dynamics under high-altitude hypoxia. This heatmap illustrates the longitudinal trajectory of key metabolites implicated in purine, pyrimidine, and amino acid metabolism, which are pivotal for high-altitude adaptation in humans. The left panel categorizes the pathways (Level B) enriched by these 40 notable metabolites. In the central panel, each grid corresponds to the relative abundance of a specific metabolite within a given sample, with the grid color denoting the z-score of the metabolite's relative abundance. On the right-hand panel, there corresponds a name for each metabolite. For additional insights, refer to supplementary figs. S2 and S3 and table S7, Supplementary Material online.
Fig. 4.
Fig. 4.
Characteristics of UA gene cluster. a) The phylogenetic landscape of the UA gene cluster is depicted, with asterisks denoting SGBs from the Lachnospiraceae family and triangles highlighting the six indicator species in d). The shaded gray region delineates families distinct from Lachnospiraceae. See also supplementary table S4, Supplementary Material online. The term “cog” symbolizes the cluster orthogroup, with gene symbol IDs encased in square brackets. IDs highlighted in bold italic font signify UA-inducible genes validated by prior studies (Kasahara et al. 2023; Liu, Xu, et al. 2023; Liu, Jarman, et al. 2023), while the remaining IDs pertain to genes identified in our present study. Numbers in parentheses indicate the frequency of each gene within its respective cluster orthogroup. b) The total relative abundance of five UA-inducible genes in each sample, based on 1,079 SGBs. UA-inducible genes are styled in italicized text. Each point corresponds to an individual sample, with color gradients reflecting distinct exposure stages. c) The total abundance changes of UA-degrading bacteria in each sample. Here, “UA-degrading bacteria” refers to bacteria that harbor all five UA-inducible genes. d, e) The dynamic shifts in the relative abundance of the six indicator SGBs at the LS2 time point and their cumulative relative abundances, respectively. Statistical significance is denoted as follows: *P < 0.05, **P < 0.01, and ***P < 0.001 by Wilcoxon rank-sum test.
Fig. 5.
Fig. 5.
Gene clusters from Lachnospiraceae exhibit the most stable and abundant capacity for UA consumption. Panel 1: Gene clusters from the Lachnospiraceae family demonstrate a significant and consistent capacity for UA consumption. The asterisk on the left highlights SGBs belonging to the Lachnospiraceae family. The red font emphasizes the six indicator species outlined in Fig. 4. The squares represent the prevalence of UA gene clusters across individuals at sequential time points, with frequencies above ten highlighted in the same color. Panel 2: Spearman's correlation coefficients detail the relationships between the relative abundance of SGBs, where the gene clusters are sourced, and ten fecal metabolites linked to purine metabolism. Correlations with absolute values exceeding 0.2 are indicated in the same color. Statistical significance is denoted as follows: *P < 0.05, **P < 0.01, and ***P < 0.001.

References

    1. Adak A, Maity C, Ghosh K, Mondal KC. Alteration of predominant gastrointestinal flora and oxidative damage of large intestine under simulated hypobaric hypoxia. Z Gastroenterol. 2014:52(2):180–186. 10.1055/s-0033-1336007. - DOI - PubMed
    1. Anderson HL, Brodsky IE, Mangalmurti NS. The evolving erythrocyte: red blood cells as modulators of innate immunity. J Immunol. 2018:201(5):1343–1351. 10.4049/jimmunol.1800565. - DOI - PMC - PubMed
    1. Baibas N, Trichopoulou A, Voridis E, Trichopoulos D. Residence in mountainous compared with lowland areas in relation to total and coronary mortality. A study in rural Greece. J Epidemiol Commun H. 2005:59(4):274–278. 10.1136/jech.2004.025510. - DOI - PMC - PubMed
    1. Bartziokas K, Papaioannou AI, Loukides S, Papadopoulos A, Haniotou A, Papiris S, Kostikas K. Serum uric acid as a predictor of mortality and future exacerbations of COPD. Eur Respir J. 2014:43(1):43–53. 10.1183/09031936.00209212. - DOI - PubMed
    1. Braun B. Effects of high altitude on substrate use and metabolic economy: cause and effect? Med Sci Sport Exer. 2008:40(8):1495–1500. 10.1249/MSS.0b013e3181729dd3. - DOI - PubMed

LinkOut - more resources