. 2024 Nov 27;52(21):13269-13289.
doi: 10.1093/nar/gkae942.

ALS-associated FUS mutation reshapes the RNA and protein composition of stress granules

Affiliations

ALS-associated FUS mutation reshapes the RNA and protein composition of stress granules

Davide Mariani et al. Nucleic Acids Res. .

Abstract

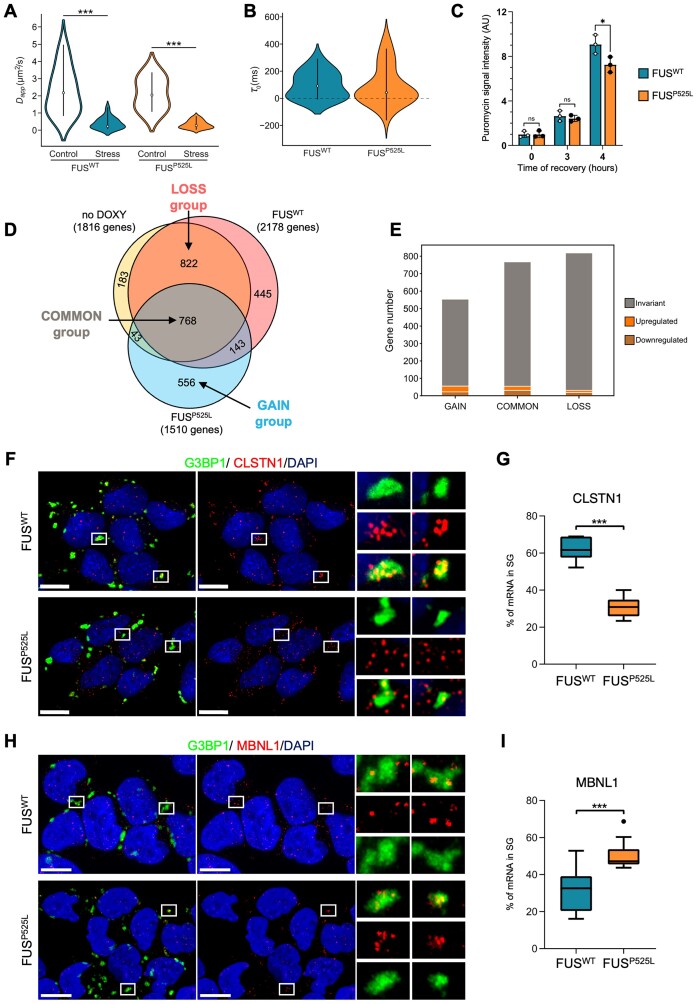
Stress granules (SG) are part of a cellular protection mechanism where untranslated messenger RNAs and RNA-binding proteins are stored upon conditions of cellular stress. Compositional variations due to qualitative or quantitative protein changes can disrupt their functionality and alter their structure. This is the case of different forms of amyotrophic lateral sclerosis (ALS) where a causative link has been proposed between the cytoplasmic de-localization of mutant proteins, such as FUS (Fused in Sarcoma), and the formation of cytotoxic inclusions. Here, we describe the SG transcriptome in neuroblastoma cells and define several features for RNA recruitment in these condensates. We demonstrate that SG dynamics and RNA content are strongly modified by the incorporation of mutant FUS, switching to a more unstructured, AU-rich SG transcriptome. Moreover, we show that mutant FUS, together with its protein interactors and their target RNAs, are responsible for the reshaping of the mutant SG transcriptome with alterations that can be linked to neurodegeneration. Our data describe the molecular differences between physiological and pathological SG in ALS-FUS conditions, showing how FUS mutations impact the RNA and protein composition of these condensates.


Figures

Graphical Abstract
Graphical Abstract
Figure 1.
Figure 1.
(A) Schematic representation of the SG purification protocol performed to isolate and analyze SG RNA composition. (B) Upper panel. Summary of the number of RNAs detected in RNAseq of SG purification experiment, and their partition among enriched, neither and depleted groups. Lower panel. Volcano plot showing the log2FC SG/INP and the −log10P value of SG enrichment for each RNA detected. Significantly enriched and depleted RNAs (FDR < 0.05, |log2FC| > 1) or neither RNAs are indicated by red or gray dots, respectively. (C) Upper panel. Pie chart depicting the proportions of SG-enriched, depleted and neither RNAs. Lower panel. Pie chart depicting the proportions of RNA biotypes among the SG-enriched RNAs. (D) Representative confocal images of single-molecule fluorescence in situ hybridization (smFISH) for NORAD (upper panel) and GAPDH (lower panel) transcripts (red), combined with immunofluorescence for G3BP1 (green) in SK-N-BE cells subjected to sodium arsenite stress. Nuclei were counterstained with DAPI. Scale bar = 10 μm. Right panels show digital magnifications of the G3BP1 granules highlighted by squares. (E) Boxplot depicting the distribution of the percentage of NORAD and GAPDH RNA localization within G3BP1-marked SG, derived from confocal images analysis. A total of 691 and 714 cells were counted for NORAD and GAPDH, respectively, from three independent biological replicates. Statistical significance was assessed with two-tailed, unpaired T-test.
Figure 2.
Figure 2.
(A) Venn diagram depicting the overlap between SG-enriched RNAs in neuroblastoma (SK-N-BE, this study), osteoblastoma (U2OS) and endocervical adenocarcinoma (SMMC-7721) cell lines. (B) Heatmap depicting for SK-N-BE, SMMC-7721, U2OS cell lines the median SG enrichment score (log2FC SG/INP) of the depleted, neither and enriched transcripts. Red color scale reports positive SG enrichment scores while blue color scale describes negative values. Heatmap density plot annotation reports the distribution of RNA GC content (ratio of GC nucleotides over the transcript length) for each transcripts group. Red color scale describes high-density of values while blue color scale describes low-density. Heatmap boxplot annotation reports global transcripts length (nt) for the specified RNA groups. Blue/orange/yellow boxplot color refers to the SK-N-BE, SMMC-7721 or U2OS system, respectively. Heatmap barplot annotation reports transcript biotypes fractions in each specified RNA group. Dark-gray color describe the fraction of mRNAs, while light-gray color the fraction of ncRNAs. (C) Heatmap (lower panel) depicting the relationship between RNA length and GO categories enriched in ‘SG common set’. The 10 transcripts groups represented were defined by length-based stratification of the transcriptome. The log2OR depicted in the heatmap shows the depletion (blue) or the enrichment (red) of each GO category in the defined group compared to the remaining fraction of the transcriptome. Boxplot (upper panel) represents the distributions of RNAs length for the 10 transcripts groups. (D) Dotplot depicting the cellular component GO over-represented categories of the SK-N-BE SG specific RNAs. Only significant categories (FDR < 0.05) were depicted. X-axis represents category enrichment score, while Y-axis reports the GO category description. Dot size represents the amount of RNAs in the analyzed group that overlap the category, while green colors report the significativity of the enrichment for CC categories. (E) Representative confocal images of smFISH for UNC5B (upper panel) and SMARCA5 (lower panel) transcripts (red), combined with immunofluorescence for G3BP1 (green) in SK-N-BE cells subjected to sodium arsenite stress. Nuclei were counterstained with DAPI. Scale bar = 10 μm. Right panels show digital magnifications of the G3BP1 granules highlighted by squares. (F) Boxplot depicting the distribution of the percentage of UNC5B and SMARCA5 RNA localization within G3BP1-marked SG, derived from confocal images analysis. 581 and 626 cells were counted for UNC5B and SMARCA5, respectively, from three independent biological replicates. Statistical significance was assessed with two-tailed, unpaired T-test.
Figure 3.
Figure 3.
(A) Violin plot showing spot-variation FCS measurements of the diffusion coefficient (Dapp) of GFP-G3BP1 in live SK-N-BE cells overexpressing FUSWT and FUSP525L, both in control and stress conditions. Dapp measures the speed of movement of individual molecules. (B) Violin plot comparing the diffusion times (t0) of individual GFP-G3BP1 molecules within formed SG in FUSWT and FUSP525L conditions. The diffusion time t0 is obtained by integrating the fluorescence signal at different pixels of the SPAD array detector and defines the confinement of movement of the analyzed molecules. (C) Barplot depicting the quantification of puromycin signal from the puromycilation assay after 0, 3 and 4 h of recovery after stress. Puromycin signal is normalized on the total protein signal from Ponceau staining. n = 3. Statistical significance was assessed with two-tailed, unpaired T-test. (D) Venn diagrams showing the overlap between SG-enriched RNAs in no DOXY, FUSWT and FUSP525L conditions. The amount of RNAs resulted enriched in SG of each condition was indicated. Arrows indicate the fraction of RNAs defined as FUSP525L GAIN, COMMON and FUSP525L LOSS. (E) Stacked Barplot depicting the amount of deregulated RNAs in FUSP525L versus FUSWT INPUT comparison among the GAIN, COMMON and LOSS groups. (F) Representative confocal images of smFISH for CLSTN1 transcript (red), combined with immunofluorescence for G3BP1 (green) in FUSWT and FUSP525L-expressing SK-N-BE cells subjected to sodium arsenite stress. Nuclei were counterstained with DAPI. Scale bar = 10 μm. Right panels show digital magnifications of the G3BP1 granules highlighted by squares. (G) Boxplot depicting the distribution of the percentage of CLSTN1 RNA localization within G3BP1-marked SG in FUSWT and FUSP525L-expressing SK-N-BE cells, derived from confocal images analysis. 536 and 405 cells were counted in FUSWT and FUSP525L cells, respectively, from three independent biological replicates. Statistical significance was assessed with two-tailed, unpaired T-test. (H) Representative confocal images of smFISH for MBNL1 transcript (red), combined with immunofluorescence for G3BP1 (green) in FUSWT and FUSP525L-expressing SK-N-BE cells subjected to sodium arsenite stress. Nuclei were counterstained with DAPI. Scale bar = 10 μm. Right panels show digital magnifications of the G3BP1 granules highlighted by squares. (I) Boxplot depicting the distribution of the percentage of MBNL1 RNA localization within G3BP1-marked SG in FUSWT and FUSP525L-expressing SK-N-BE cells, derived from confocal images analysis. 591 and 618 cells were counted in FUSWT and FUSP525L cells, respectively, from three independent biological replicates. Statistical significance was assessed with two-tailed, unpaired T-test.
Figure 4.
Figure 4.
(A) Heatmap depicting for FUSP525L, FUSWT and no DOXY conditions the median SG enrichment score (log2FC SG/INP) of the depleted, neither and enriched transcripts. Red color scale reports positive SG enrichment scores while blue color scale describes negative values. Heatmap density plot annotation reports the distribution of RNA GC content (ratio of GC nucleotides over the transcript length) for each transcript group. Red color scale describes high-density of values while blue color scale describes low-density. Heatmap boxplot annotation reports global transcripts length (nt), 5′ UTR, CDS and 3′UTR length (nt) for the specified RNA groups. Light-blue/light-red/yellow boxplot color refers to the FUSP525L, FUSWT and no DOXY conditions, respectively. Heatmap barplot annotation reports transcript biotypes fractions in each specified RNA group. Dark-gray color describe the fraction of mRNAs, while light-gray color the fraction of ncRNAs. (B) Sequence logo of the top 50 7mers over-represented in SG-enriched RNAs compared to SG depleted in no DOXY, FUSWT and FUSP525L conditions. (C) Heatmap showing the log2FC of 7mers frequency in SG enriched over neither RNAs in no DOXY, FUSWT and FUSP525L conditions. Only the union of the top 50 over-represented and 50 under-represented 7mers in each condition is depicted. Cluster number is reported on the left. Pie charts represent the percentage of AU or GC nucleotides in the 7mers enriched (cluster 1) and depleted (cluster 5) in FUSP525L SG. (D) Boxplot depicting the distribution of RNA structuration degree predicted using RNAfold algorithm between FUSP525L GAIN and LOSS groups. The differences between groups were calculated using Mann–Whitney U test. The first sampling was reported. Size of sampling = 200 RNAs per group. (E) Representative heatmap showing the fold between average accessibility of FUSP525L GAIN over LOSS groups. The differences between groups were calculated using Mann–Whitney U test. Only significant differences were depicted (P value < 0.05). The first sampling was reported. Size of sampling = 200 RNAs per group. (F, G) Boxplot depicting the distribution of RNA structuration score predicted by CROSS algorithm (F) and RNA average accessibility calculated using DMS-MapSeq data (G) between FUSP525L GAIN and LOSS groups. The differences between groups were calculated using Mann–Whitney U test. The first sampling was reported. Size of sampling = 200 RNAs per group for CROSS (F) and 50 RNAs per group for DMS-MapSeq (G).
Figure 5.
Figure 5.
(A) Barplot depicting the fraction of FUSP525L HITS-CLIP interactors in the FUSP525L GAIN, COMMON, FUSP525L LOSS, NEITHER or DEPLETED transcript groups. X-axis reports the analyzed groups, while Y-axis reports the frequency of RNAs per group. Red color bars describe the FUSP525L interactors, while white ones the not FUSP525L interactors. For NEITHER and DEPLETED groups a common set of RNAs defined as neither or depleted in all the three datasets (no DOXY, FUSP525L or FUSWT) was taken in consideration for this analysis. (B) Meta-region profiles of FUSP525L HITS-CLIP binding sites. Line plot in the top describes the frequency of windows in each position that contains AU-rich 7mers (black) or GC-rich 7mers (red). X-axis represents each analyzed position relative to the peak summit from -200nt to +200nt, while Y-axis reports the frequency of windows with 7mers. Heatmap in the bottom reports for each position the CLIP normalized signal of each biological replicate. Red color scale reports the intensity of the normalized signal. (C) Venn diagram depicting the overlap among SG proteomes in FUSWT and FUSP525L conditions and FUS protein interactors. Arrows indicate the fraction of proteins defined as "SG proteins AND FUS interactors" or "SG proteins NOT FUS interactors". (D) Boxplot depicting the distribution of the fluorescence intensity of DHX36 (left panel) and ELAVL1 (right panel) within TIAR and G3BP1-marked SG, derived from immunofluorescence analysis. For DHX36, 741 and 668 cells were counted for FUSWT and FUSP525L, respectively, from three independent biological replicates. For ELAVL1, 650 and 607 were counted for FUSWT and FUSP525L, respectively, from three independent biological replicates. Statistical significance was assessed with two-tailed, unpaired T-test. (E) Representative immunofluorescence for G3BP1 (green) and ELAVL1 (red) performed in SK-N-BE cells expressing FUSWT and FUSP525L under doxycycline control, subjected to 1 h of 0.5 mM sodium arsenite stress. Nuclei were counterstained with DAPI. Scale bar = 10 μm. Bottom panels show digital magnifications of the G3BP1 granules highlighted by squares. (F) Barplot depicting the average binding affinity (Z-score) for AU-rich 7mers in each RNAcompete experiment retrieved from CISBP-RNA database (Homo sapiens). X-axis reports the ID referred to each RNA compete experiment, while Y-axis reports the average Z-score for AU-7mers in the experiment. Red bars refer to experiments with positive average Z-scores, while blue bars refer to experiments with negative ones. A gray arrow indicates the RNAcompete experiment with the highest average Z-score for AU-rich 7mers, and the associated RBPs (ELAVL1/3). (G) Barplot depicting the enrichment of protein–protein physical interactions (PPI) in the "SG proteins AND FUS interactors" compared to the three samplings performed from the "SG protein NOT FUS interactors" group.

References

    1. Banani S.F., Lee H.O., Hyman A.A., Rosen M.K.. Biomolecular condensates: organizers of cellular biochemistry. Nat. Rev. Mol. Cell Biol. 2017; 18:285–298. - PMC - PubMed
    1. Das S., Vera M., Gandin V., Singer R.H., Tutucci E.. Intracellular mRNA transport and localized translation. Nat. Rev. Mol. Cell Biol. 2021; 22:483–504. - PMC - PubMed
    1. Hirose T., Ninomiya K., Nakagawa S., Yamazaki T.. A guide to membraneless organelles and their various roles in gene regulation. Nat. Rev. Mol. Cell Biol. 2023; 24:288–304. - PubMed
    1. Brangwynne C.P., Eckmann C.R., Courson D.S., Rybarska A., Hoege C., Gharakhani J., Jülicher F., Hyman A.A. Germline P granules are liquid droplets that localize by controlled dissolution/condensation. Science. 2009; 324:1729–1732. - PubMed
    1. Hyman A.A., Weber C.A., Jülicher F.. Liquid–liquid phase separation in biology. Annu. Rev. Cell Dev. Biol. 2014; 30:39–58. - PubMed