. 2024 Dec;11(48):e2407706.
doi: 10.1002/advs.202407706. Epub 2024 Nov 4.

Adenosine-Dependent Arousal Induced by Astrocytes in a Brainstem Circuit

Affiliations

Adenosine-Dependent Arousal Induced by Astrocytes in a Brainstem Circuit

Yuwei Zhu et al. Adv Sci (Weinh). 2024 Dec.

Abstract

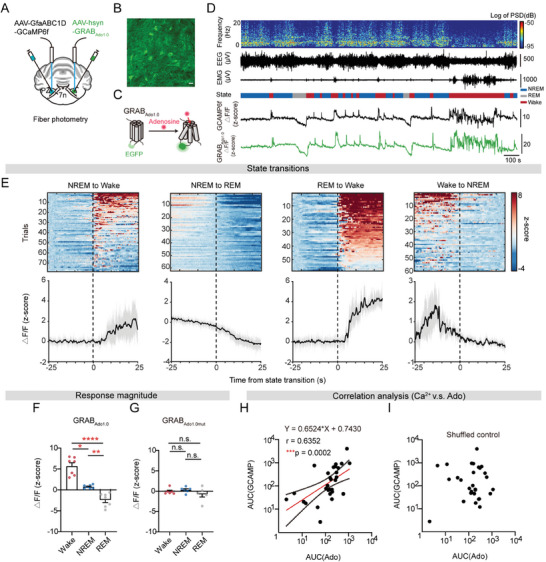
Astrocytes play a crucial role in regulating sleep-wake behavior. However, how astrocytes govern a specific sleep-arousal circuit remains unknown. Here, the authors show that parafacial zone (PZ) astrocytes responded to sleep-wake cycles with state-differential Ca2+ activity, peaking during transitions from sleep to wakefulness. Using chemogenetic and optogenetic approaches, they find that activating PZ astrocytes elicited and sustained wakefulness by prolonging arousal episodes while impeding transitions from wakefulness to non-rapid eye movement (NREM) sleep. Activation of PZ astrocytes specially induced the elevation of extracellular adenosine through the ATP hydrolysis pathway but not equilibrative nucleoside transporter (ENT) mediated transportation. Strikingly, the rise in adenosine levels induced arousal by activating A1 receptors, suggesting a distinct role for adenosine in the PZ beyond its conventional sleep homeostasis modulation observed in the basal forebrain (BF) and cortex. Moreover, at the circuit level, PZ astrocyte activation induced arousal by suppressing the GABA release from the PZGABA neurons, which promote NREM sleep and project to the parabrachial nucleus (PB). Thus, their study unveils a distinctive arousal-promoting effect of astrocytes within the PZ through extracellular adenosine and elucidates the underlying mechanism at the neural circuit level.

Keywords: adenosine; arousal; astrocyte; neural circuit; parafacial zone.


Conflict of interest statement

Authors declare that they have no competing interests.

Figures

Figure 1
Figure 1
Elevated astrocytic Ca2+ activity in the PZ during wakefulness. A) Setup for fiber photometric recording in the PZ astrocytes during sleep‐wake cycles in combination with EEG/EMG recordings. B) Representative images of AAV‐GfaABC1D‐GCaMP6f‐EYFP expression in the PZ (position of coronal section) co‐localized with GFAP, while not with NeuN. Scale bar, 50 µm; green, GCaMP6f ‐EYFP; red, GFAP; blue, NeuN. C) Top to bottom, EEG power spectrogram (0–20 Hz), EEG traces, EMG traces, vigilant states (blue, NREM sleep; grey, REM sleep; red, wakefulness), and astrocytic Ca2+ activity (z‐score). D) Mean ΔF/F (z‐score) of GCaMP6f during wakefulness, NREM sleep, and REM sleep. n = 14 mice, a Kruskal–Wallis test, Dunn's multiple comparisons test; Wake versus NREM *p = 0.0242, Wake versus REM **** p < 0.0001, NREM versus REM ** p = 0.0076. E) Mean ΔF/F (z‐score) of EGFP during wakefulness, NREM sleep, and REM sleep. n = 10 mice, a one‐way ANOVA test, Tukey's multiple comparisons test, n.s. indicates not statistically significant. F) Heatmaps of Ca2+ fluorescence traces during the 25 s before and after state transitions between NREM sleep, REM sleep, and wakefulness (top). Line plots are mean ΔF/F (±s.e.m.) during state transitions under baseline conditions (bottom). Vertical dashed lines indicate time of state transitions. n = 14 mice.
Figure 2
Figure 2
Chemogenetic and optogenetic activation of PZ astrocytes induces wakefulness. A) Setup for chemogenetic activation of astrocytes within the PZ via bilateral injection of AAV‐GfaABC1D‐hM3Dq‐mCherry virus. B) Representative images of AAV‐GfaABC1D‐hM3Dq‐mCherry expression within the PZ (position of coronal section indicated by dashed line in schematic) co‐localized with GFAP, while not with NeuN. Scale bar, 50 µm; red, hM3Dq‐mCherry; green, GFAP; blue, NeuN. C) Setup for bilateral fiber photometric recording of astrocytic Ca2+ activity within the PZ by mixed injection of GCaMP6f with hM3Dq virus (upper left). Representative Ca2+ fluorescent traces (z‐score) during the pre‐ and post‐injection of CNO (1 mg kg−1) or saline intraperitoneally (bottom). D) Area under curve (AUC) of astrocytic Ca2+ activity (z‐score) between CNO and saline group. n = 9 trials recorded from 3 mice, an unpaired two‐tailed t‐test, ** p = 0.0093. E–G) Hourly percentages (±s.e.m.) of wakefulness (E), NREM sleep (F), and REM sleep (G) of saline (n = 6 mice) and CNO group (n = 6 mice) during ZT0‐ZT24. Two‐way ANOVA test, Sidak's multiple comparisons test, Wake: * p = 0.0122 (ZT7), **** p < 0.0001 (ZT8), * p = 0.0107 (ZT9); NREM: ** p = 0.0088 (ZT7), *** p = 0.0001 (ZT8), ** p = 0.0090 (ZT9); REM: ** p = 0.0053 (ZT8), * p = 0.0203 (ZT9), ** p = 0.0041 (ZT10), * p = 0.0160 (ZT11). H,I) Representative graph of state changes in 5 h after saline (H) or CNO (I) injection. Top to bottom, EMG traces, vigilant states (color coded), EEG power spectrogram (0‐30 Hz), and delta wave power (µV2). J) Total time spent in each state during ZT7‐ZT10 between saline (n = 6 mice) and CNO group (n = 6 mice). Two‐way ANOVA test, Sidak's multiple comparisons test, **** p < 0.0001 (Wake), *** p = 0.0004 (REM), **** p < 0.0001 (NREM). K) Mean episode duration of each state in 3 h after CNO or saline injection (ZT7‐ZT10). Each pair of dots, data from one mouse (saline, n = 6 mice; CNO, n = 6 mice). Wake: a two‐tailed Wilcoxon rank test, * p = 0.0313; NREM: a two‐tailed paired t test, *** p = 0.0003; REM: a two‐tailed Wilcoxon rank test, * p = 0.0313.L) Episode number of each state in 3 h after CNO or saline injection (ZT7‐ZT10). Saline, n = 6 mice; CNO, n = 6 mice. Wake: a two‐tailed paired t test, *** p = 0.0003; NREM: a two‐tailed paired t test, *** p = 0.0003; REM: a two‐tailed Wilcoxon rank test, * p = 0.0313. M) Setup for optogenetic activation of astrocytes by embedding optical fiber on top of PZ in GFAP‐ChR2‐EYFP rats. N) Representative images of ChR2‐EYFP expression in the PZ (position of coronal section indicated by dashed line in schematic) co‐localized with GFAP, while not with NeuN. Scale bar, 100 µm; green, ChR2‐EYFP; red, GFAP; blue, NeuN. O–Q) Left, example graphs of optogenetic activation of PZ astrocytes respectively in NREM sleep (O), REM sleep (P), and wakefulness (Q). Top to bottom, brain states (color coded), EEG power spectrogram (0–30 Hz), EEG, and EMG traces. Light blue shading indicates 15 s blue laser stimulation. Right, comparison of relative EEG power (±s.e.m.) of 0–30 Hz between 15 s pre‐ and during stimulation. Red line indicates statistically significant. Two‐way ANOVA test, Bonferroni's multiple comparisons test. R–T) Probability of state transitions with and without optogenetic activation of astrocytes. n = 5 rats. Two‐way ANOVA test, Sidak's multiple comparisons test, IP: *** p = 0.0006 (REM to Wake), *** p = 0.0006 (REM to REM); AP: *** p = 0.0005 (REM to Wake), *** p = 0.0005 (REM to REM), **** p < 0.0001.
Figure 3
Figure 3
Inhibition of astrocytic Ca2+ activities in the PZ with hPMCA2w/b reduced wakefulness. A) hPMCA2w/b bilateral injection to attenuate astrocytic Ca2+ activity in the PZ mediated by continuous calcium pumping. B) Representative images of AAV‐GfaABC1D‐hPMCA2w/b‐mCherry expression in the PZ labeling with GFAP (upper) and NeuN (down). Scale bar, 20 µm; red, hPMCA2w/b; green, GFAP or NeuN. C, D) Mean (±s.e.m.) ΔF/F (z‐score) of astrocytic Ca2+ activity during the 50 s before and after the transition from REM sleep (C) or NREM sleep (D) to wakefulness between hPMCA2w/b and mCherry group. n = 5 mice. E) Mean ΔF/F (z‐score) of astrocytic Ca2+ activity between hPMCA2w/b and mCherry group during wakefulness. n = 5 mice, paired two‐tailed t‐test, * p = 0.0363. F–H) Hourly percentages (±s.e.m.) of time spent in wakefulness (F), NREM sleep (G), and REM sleep (H) of mice that received mCherry virus injections into PZ (control, n = 8 mice), and littermates that received hPMCA2w/b virus injections (hPMCA2w/b, n = 10 mice). Two‐way ANOVA test, Sidak's multiple comparisons test, * p = 0.0238 (NREM), * p = 0.0287 (wake). I) Percentages of total time spent in each state during IP and AP. (control, n = 9 mice; hPMCA2w/b, n = 11 mice). Two‐way ANOVA test, Sidak's multiple comparisons test, * p = 0.0418 (wake), * p = 0.0347 (NREM). J–L) Mean episode duration spent in wakefulness (J), NREM sleep (K), and REM sleep (L) between control and hPMCA2w/b group during IP, AP, and 24h. (control, n = 8 mice; hPMCA2w/b, n = 10 mice) Two‐way ANOVA test, Sidak's multiple comparisons test, **** p < 0.0001. M–O) Episode number of wakefulness (M), NREM sleep (N), and REM sleep (O) between control and hPMCA2w/b group during IP, AP, and 24h. (control, n = 8 mice; hPMCA2w/b, n = 10 mice) Two‐way ANOVA test, Sidak's multiple comparisons test, Wake, ** p = 0.0015, *** p = 0.0004; NREM, ** p = 0.0016, *** p = 0.0004. P,Q) Number of state transitions including NREM sleep to REM sleep (N‐R), REM sleep to wakefulness (R‐W), NREM sleep to wakefulness (N‐W), and wakefulness to NREM sleep (W‐N) between control and hPMCA2w/b group during IP (P) and AP (Q). (control, n = 6 mice; hPMCA2w/b, n = 8 mice) Two‐way ANOVA test, Sidak's multiple comparisons test, *** p = 0.0005, **** p < 0.0001.
Figure 4
Figure 4
Adenosine dances with astrocytic Ca2+ activity in the PZ during sleep‐wake cycles. A) Setup for bilateral fiber photometric recording of adenosine with GRABAdo1.0 and astrocytic Ca2+ activity within the PZ during sleep‐wake cycles. B) Representative image of GRABAdo1.0 expression within the PZ. Scale bar, 100 µm; green, GRABAdo1.0. C) Schematic illustrating the principle of GRABAdo1.0 sensors: adenosine binding induces a conformational change thereby elevating EGFP fluorescence. D) Top to bottom, EEG power spectrogram (0‐20 Hz), EEG traces, EMG traces, vigilant states (color coded), and representative astrocytic Ca2+ activity and GRABAdo1.0 fluorescence traces (z‐score) during sleep‐wake cycles. E) Heatmaps of GRABAdo1.0 fluorescence traces during the 25 s before and after transitions between NREM sleep, REM sleep, and wakefulness (top). Line plots are mean ΔF/F (±s.e.m.) during state transitions under baseline conditions (bottom). Vertical, dashed lines indicate time of state transition. n = 7 mice. F, G) Mean (±s.e.m.) ΔF/F (z‐score) of GRABAdo1.0 (F) and GRABAdo1.0mut (G) during each state. GRABAdo1.0, n = 8 mice; GRABAdo1.0mut, n = 6 mice. F, a one‐way ANOVA test, Tukey's multiple comparisons test, * p = 0.0259, ** p = 0.0018, **** p < 0.0001. G, Kruskal‐Wallis test, Dunn's multiple comparisons test. n.s. indicates not statistically significant. H, I) Correlation analysis of GCaMP6f and GRABAdo1.0 signals (H) and the shuffled control (I). n = 29 trials, recorded from 7 individuals. Pearson correlation analysis, *** p = 0.0002, r = 0.6352, red line shows linear regression line (Y = 0.6524*X + 0.7430), dot line indicates 95% regression range.
Figure 5
Figure 5
Adenosine generated through ATP hydrolysis exerts its wakefulness‐promoting effects by binding to A1 receptors. A) Setup for local drug delivery through bilateral canula on top of PZ in C57BL/6J mice (top). Representative image of canula location (bottom). Scale bar, 100 µm. B) Hourly percentage of time spent in wakefulness, REM sleep and NREM sleep in 5 h after the administration of NECA (n = 6 mice) or vehicle (n = 6 mice). Two‐way ANOVA test, Sidak's multiple comparisons test. Wake: * p = 0.0496, **** p < 0.0001; REM: * p = 0.0433; NREM: **** p < 0.0001. C) Relative EEG power (0‐30 Hz) during wakefulness after the administration of NECA (n = 4 mice) or vehicle (n = 4 mice). Two‐way ANOVA test, Sidak's multiple comparisons test. n.s., p = 0.4756. D) Representative image of A1 receptor expression in the PZ by immunohistochemistry staining of A1 receptors (red) and DAPI (blue) and a zoom‐in graph (right). Scale bar, 100 µm. E) Setup for optogenetic activation of astrocytes in the PZ following the administration of CPT (A1 receptor inhibitor). F) Probability of state transitions during optogenetic activation of PZ astrocytes following the administration of CPT or vehicle. From NREM to: vehicle group (n = 8 rats), CPT group (n = 5 rats); From REM or Wake to: vehicle group (n = 6 rats), CPT group (n = 4 rats). Two‐way ANOVA test, Sidak's multiple comparisons test, **** p < 0.0001. G) Setup for simultaneous bilateral fiber photometry recordings of ATP and adenosine in the PZ throughout sleep‐wake cycles by recording GRABATP1.0 and GRABAdo1.0 signals. H) Top to bottom, EEG power spectrogram (0–20 Hz), EEG traces, EMG traces, representative GRABATP1.0 (ATP) and GRABAdo1.0 (Ado) fluorescence traces (z‐score) during sleep‐wake cycles; color code indicates NREM sleep, REM sleep, and wakefulness. I) Mean (±s.e.m.) ΔF/F (z‐score) of GRABATP1.0 (ATP) signals during each state. n = 3 mice. A one‐way ANOVA test, Tukey's multiple comparisons test, ** p = 0.0080 (Wake vs REM), * p = 0.0390 (NREM vs REM). J) Correlation analysis of GRABATP1.0 and GRABAdo1.0 signals (left) and the shuffled control (right). n = 31 trials, recorded from 3 individuals. Pearson correlation analysis, * p = 0.0152, r = 0.4323, red line shows linear regression line (Y = 0.2824*X+1.788), dot line indicates 95% regression range. K) Setup for optogenetic activation of astrocytes in the PZ following the administration of ARL67156 (CD73 inhibitor), NBTI (ENT inhibitor), or vehicle. L) Representative image of the expression of AAV‐GfaABC1D‐ChrimsonR‐mCherry in the PZ and the location of bilateral canula. Scale bar, 100 µm; red, ChrimsonR; blue, DAPI. M‐N) Probability of state transitions during optogenetic activation of PZ astrocytes following the administration of ARL67156 (n = 5 mice), NBTI (n = 5 mice), or vehicle (n = 5 mice). Two‐way ANOVA test, Tukey's multiple comparisons test. From NREM to Wake: ** p = 0.0029 (Vehicle+OPTO vs ARL67156+OPTO), ** p = 0.0044 (ARL67156+OPTO vs NBTI+OPTO); From NREM to NREM, ** p = 0.0029 (Vehicle + OPTO vs ARL67156+OPTO), ** p = 0.0026 (ARL67156+OPTO vs NBTI+OPTO). **** p < 0.0001.
Figure 6
Figure 6
Astrocytes located in the PZ significantly contribute to the elevation of adenosine levels during wakefulness. A) Setup for fiber photometric recording of adenosine in the PZ while activating astrocytes optogenetically through a combined injection of GRABAdo1.0 with ChrimsonR virus. B‐J) Heatmaps show GRABAdo1.0 fluorescence traces during the 15 s before and 30 s after optogenetic stimulation in NREM sleep (B), REM sleep (E), and wakefulness (H). Line plots are mean ΔF/F (±s.e.m.) under optogenetic stimulation in NREM sleep (C), REM sleep (F), and wakefulness (I). Area under curve (AUC) of GRABAdo1.0 signals in 15 s of pre‐, during, and post‐stimulation periods. D, NREM: n = 14 trials from 13 mice, Friedman test, Dunn's multiple comparisons test * p = 0.0245, **** p < 0.0001; G, REM: n = 10 trials from 9 mice, a one‐way ANOVA test, Tukey's multiple comparisons test, ** p = 0.0013 (pre‐stim vs stim), *** p = 0.0002 (pre‐stim vs post‐stim), ** p = 0.0012 (stim vs post‐stim); J, Wake: n = 10 trials from 10 mice, a one‐way ANOVA test, Tukey's multiple comparisons test, ** p = 0.0018, * p = 0.0120. K) Setup for bilateral fiber photometry recording of GRABAdo1.0 signals in the PZ, while inhibiting unilateral astrocytic Ca2+ activity through hPMCA2w/b expression and mCherry labeling contralaterally as control. L) Heatmaps show GRABAdo1.0 fluorescence traces during the 10 s before and 20 s after transitions to wakefulness between hPMCA2w/b and mCherry group. M) Mean ΔF/F (±s.e.m.) during the 10 s before and 20 s after transitions to wakefulness of hPMCA2w/b (n = 10 mice) and mCherry group (n = 6 mice). N) Mean ΔF/F (±s.e.m.) of GRABAdo1.0 signals between hPMCA2w/b (n = 10 mice) and mCherry group (n = 6 mice) during wakefulness. A two‐tailed Mann–Whitney test, * p = 0.0160.
Figure 7
Figure 7
Astrocyte activation inhibits NREM‐promoting and PB‐projecting GABAergic neurons in the PZ. A) Setup for optogenetic activation of terminals from PZGABA neurons projecting to the PB in combination with EEG/EMG recordings during sleep‐wake cycles. B) Top to bottom, EEG power spectrogram (0–20 Hz), EEG traces, and EMG traces throughout sleep‐wake cycles; color code indicates NREM sleep and wakefulness. Red shade indicates optogenetic activation (635 nm, 1 mW, 30 s, 40 Hz, 5 ms). C) Comparison of the probability of state transitions between the baseline condition and optogenetic activation. Two‐way ANOVA test, Sidak's multiple comparisons test, *** p = 0.0002. D) Relative EEG power (0–30 Hz) during natural NREM sleep (n = 5 mice) and optogenetic activation (n = 5 mice). Two‐way ANOVA test, Bonferroni's multiple comparisons test. E) Setup for fiber photometric recording of the terminal Ca2+ activity from PZGABA neurons projecting to the PB in response to the optogenetic activation of PZ astrocytes. F) Representative image of the terminal CCaMP6 m expression from PZGABA neurons projecting to the PB (position of coronal section). Scale bar, 50 µm; green, CCaMP6 m; blue, DAPI. G) Heatmap shows CCaMP6 m fluorescence traces during the 50 s before and 100 s after optogenetic activation of PZ astrocytes. n = 3 mice. H) Mean (±s.e.m.) ΔF/F (z‐score) during the 50 s before and 100 s after optogenetic activation (red shade) of PZ astrocytes. n = 3 mice. I) Area under curve (AUC) of CCaMP6 m signals in 30 s of pre‐, during, and post‐stimulation periods. n = 3 mice, a one‐way ANOVA test, Tukey's multiple comparisons test, *p = 0.0326 (pre‐stim vs stim). J) Setup for fiber photometric recording of the terminal EYFP fluorescence from PZGABA neurons projecting to the PB in response to the optogenetic activation of PZ astrocytes. K) Heatmap shows EYFP fluorescence traces during the 50 s before and 100 s after optogenetic activation of PZ astrocytes. n = 3 mice. L) Mean (±s.e.m.) ΔF/F (z‐score) during the 50 s before and 100 s after optogenetic activation (red shade) of PZ astrocytes. n = 3 mice. M) AUC of EYFP fluorescence in 30 s of pre‐, during, and post‐stimulation periods. n = 3 mice, a one‐way ANOVA test, Tukey's multiple comparisons test. N) Setup for fiber photometric recording of extracellular GABA in the PB by recording iGABASnFR.st signals in combination with EEG/EMG recordings during sleep‐wake cycles. O) Representative image of iGABASnFR.st expression in the PB (position of coronal section). Scale bar, 100 µm; green, iGABASnFR.st; blue, DAPI. P) Top to bottom, EEG power spectrogram (0‐20 Hz), EEG traces, EMG traces, and representative iGABASnFR.st fluorescence traces (z‐score) during sleep‐wake cycles; color code indicates vigilant states. Q) Mean ΔF/F (z‐score) of iGABASnFR.st signals during NREM sleep, REM sleep, and wakefulness. n = 3 mice, a one‐way ANOVA test, Tukey's multiple comparisons test, * p = 0.0357 (NREM vs Wake), * p = 0.0147 (NREM vs REM). R) Setup for fiber photometric recording of extracellular GABA in the PB in response to the optogenetic activation of terminals from PZGABA neurons projecting to the PB. S) Heatmap shows iGABASnFR.st fluorescence traces during the 50 s before and 100 s after optogenetic activation of terminals from PZGABA neurons projecting to the PB. n = 3 mice. T) Mean (±s.e.m.) ΔF/F (z‐score) during the 50 s before and 100 s after optogenetic activation (red shade) of terminals from PZGABA neurons projecting to the PB. n = 3 mice. U) AUC of iGABASnFR.st signals in 30 s of pre‐, during and post‐stimulation periods. n = 3 mice, a one‐way ANOVA test, Tukey's multiple comparisons test, * p = 0.0193 (pre‐stim vs stim), * p = 0.0201 (pre‐stim vs post‐stim). V) Setup for fiber photometric recording of extracellular GABA in the PB in response to the optogenetic activation of astrocytes in the PZ. W) Heatmap shows iGABASnFR.st fluorescence traces during the 50 s before and 100 s after optogenetic activation of astrocytes in the PZ. n = 3 mice. X) Mean (±s.e.m.) ΔF/F (z‐score) during the 50 s before and 100 s after optogenetic activation (red shade) of astrocytes in the PZ. n = 3 mice. Y) AUC of iGABASnFR.st signals in 30 s of pre‐, during and post‐stimulation periods. n = 4 mice, a one‐way ANOVA test, Tukey's multiple comparisons test, ** p = 0.0021 (pre‐stim vs stim), * p = 0.0340 (stim vs post‐stim).

References

    1. Liu D., Dan Y., Annu. Rev. Neurosci. 2019, 42, 27. - PubMed
    1. Nagai J., Yu X., Papouin T., Cheong E., Freeman M. R., Monk K. R., Hastings M. H., Haydon P. G., Rowitch D., Shaham S., Khakh B. S., Neuron 2021, 109, 576. - PMC - PubMed
    1. Srinivasan R., Huang B. S., Venugopal S., Johnston A. D., Chai H., Zeng H., Golshani P., Khakh B. S., Nat. Neurosci. 2015, 18, 708. - PMC - PubMed
    1. Haydon P. G., Curr. Opin. Neurobiol. 2017, 44, 28. - PMC - PubMed
    1. Plog B. A., Nedergaard M., Annu Rev Pathol 2018, 13, 379. - PMC - PubMed

LinkOut - more resources