. 2024 Nov 15;151(22):dev204222.
doi: 10.1242/dev.204222. Epub 2024 Nov 18.

A genome-engineered tool set for Drosophila TGF-β/BMP signaling studies

Affiliations

A genome-engineered tool set for Drosophila TGF-β/BMP signaling studies

Clara-Maria Ell et al. Development. .

Abstract

Ligands of the TGF-β/BMP superfamily are crucially involved in the regulation of growth, patterning and organogenesis and can act as long-range morphogens. Essential for understanding TGF-β/BMP signaling dynamics and regulation are tools that allow monitoring and manipulating pathway components at physiological expression levels and endogenous spatiotemporal patterns. We used genome engineering to generate a comprehensive library of endogenously epitope- or fluorescent-tagged versions of receptors, co-receptors, transcription factors and key feedback regulators of the Drosophila BMP and Activin signaling pathways. We demonstrate that the generated alleles are biologically active and can be used for assessing tissue and subcellular distribution of the corresponding proteins. Furthermore, we show that the genomic platforms can be used for in locus structure-function and cis-regulatory analyses. Finally, we present a complementary set of protein binder-based tools, which allow visualization as well as manipulation of the stability and subcellular localization of epitope-tagged proteins, providing new tools for the analysis of BMP signaling and beyond.

Keywords: Drosophila development; Endogenous protein tagging; Functionalized protein binder tools; Oogenesis; TGF-β/BMP signaling; Wing imaginal disc.


Conflict of interest statement

Competing interests The authors declare no competing or financial interests.

Figures
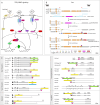
Fig. 1.
Fig. 1.
Genome engineering Drosophila TGF-β/BMP signaling. (A) Overview of the TGF-β/BMP signaling pathway, with an emphasis on components that have been modified in this study (shown in color). (B) Two-step genome-engineering strategy exemplified with Sax. CRISPR/Cas9-mediated homology-directed repair was used to replace the target sequence with an attP-containing cassette. After removal of the dsRed selection marker, the genomic locus was restored with tagged versions of the gene by standard ФC31 transgenesis. The mini-white selection marker was excised by Cre recombinase. Exact strategies for the other TGF-β/BMP components are depicted in Fig. S1. Note that, in the case of Dally, Pent, Tkv and Put, homologous recombination as described in Baena-Lopez et al. (2013) was used to generate the attP,KO lines. bp, base pairs; CDS, coding sequence; UTR, untranslated region. (C) In-scale overview of tagged TGF-β/BMP components to visualize the position of the tag (shown in color) in relation to protein domains. At least one but up to five tagged variants are available for all components. For simplicity, all components tagged with 3×HA are termed HA-X or X-HA. Note the exception of Tkv, for which the 3×HA-tagged version is termed Tkv-3×HA, a single HA-tagged version is termed Tkv-HA, and versions tagged with a single copy of HA and eGFP are termed Tkv-HAeGFP and Tkv-eGFPHA. Variants marked by an asterisk are not viable in homozygosity. Grey rectangles at the glypicans indicate the position of the glycosylphosphatidylinositol (GPI) attachment site. aa, amino acids; GPI, GPI anchor; GS, GS domain; Homeo, homeodomain; Kazal, Kazal domain; Kinase, kinase domain; LBD, ligand-binding domain; MH1, MH1 domain; MH2, MH2 domain; SPARC, Secreted Protein Acidic and Rich in Cysteine domain; SP, signal peptide; TM, transmembrane domain; TY, thyroglobulin type 1 domain; ZF, zinc finger domain.
Fig. 2.
Fig. 2.
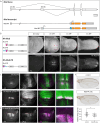
Tissue and cellular distribution of tagged TGF-β/BMP receptors and glypicans. (A) Schematic depiction of the larval wing imaginal disc showing the dpp expression domain in the anterior compartment in red. Red dashed box indicates area used to generate intensity plots shown in C-G. (B) Anti-pMad staining shows the BMP signaling activity gradient in the wing imaginal disc. (C-I) Anti-GFP or anti-HA staining visualizes the distribution of receptors (C-G) and glypicans (H,I) in wing imaginal discs. Insets show intensity plots along the anterior-posterior disc axis. (G′) Subcellular localization of Sax-YFP in the disc in relation to the septate junction marker Discs large (Dlg) (magenta). (J) Schematic depiction of selected stages of oogenesis. Cells expressing dpp (niche cells in the germarium, stretched follicle cells in S10) are shown in red. The orange dashed box indicates area of the germarium shown in panels L,N and in Fig. S5. S, stage. (K,Kʹ,L) Anti-pMad staining visualizes BMP signaling activity during oogenesis. During egg chamber development, pMad is present in anterior most follicle cells and, at S10, in both nurse cell-associated stretched follicle cells (red arrowheads, K′) and a band of anterior oocyte-associated follicle cells (yellow brackets, K′). In the germarium, pMad levels are high in germline stem cells (L). Nuclei are stained by Hoechst (blue) and anti-Dlg staining is shown in magenta. (M,Mʹ,N) Anti-GFP staining of Sax-YFP shows its distribution during oogenesis. Nuclei are visualized by Hoechst (blue) and spectrosomes by anti-Hu li tai shao (Hts) staining (magenta). Images are representative of at least five wing discs or ovaries. Scale bars: 50 μm (B-I,K,M); 10 μm (Gʹ,L,N).
Fig. 3.
Fig. 3.
Tissue distribution of intracellular TGF-β/BMP components. (A-E) Anti-GFP or anti-HA staining visualizes the distribution of tagged Smad proteins (A-C) and transcription factors (D,E) in wing imaginal discs. (A′,B′) RNAi-mediated depletion of Med (A′) and Dad (B′) in the dorsal wing disc compartment using ap-Gal4 verified the specificity of the observed staining. The red dashed line indicates the dorsoventral compartment boundary. (D′-E‴) Anti-GFP and HA-staining of YFP-Brk (D′-D‴) and Shn-HA (E′-E‴), respectively, show their distribution during oogenesis. Nuclei are visualized by Hoechst (blue) and anti-DE-Cadherin (DCad) staining is shown in magenta. Images are representative of at least five wing discs or ovaries. Scale bars: 50 μm (A-E″); 10 μm (D‴,E‴).
Fig. 4.
Fig. 4.
Mad isoform analysis. (A) Mad genomic locus and the predicted Mad transcript isoforms. Mad-RB contains an N-terminal extension (highlighted in blue). Orange boxes mark coding sequences and grey boxes mark untranslated regions. bp, base pairs; TSS, transcriptional start site. (B) Anti-HA staining of endogenously tagged Mad versions visualized in third instar wing discs and early prepupal wings. HA-Mad tags both isoforms, whereas HA-Mad-PB exclusively tags Mad-PB. Discs are oriented with the anterior up and posterior down. Red arrowheads indicate patches of elevated protein levels, possibly corresponding to HA-Mad-PB in addition to the uniform HA-Mad-PA expression. White dashed lines indicate disc outlines. APF, after puparium formation. Images are representative of at least five larval or prepupal wings. (C-E) Anti-HA and anti-pMad immunostaining in late larval wild-type wing discs (C) and discs expressing TkvQD (D) or Tkv-RNAi (E) in the dorsal compartment using ap-Gal4. Discs are oriented with the anterior to the left and posterior to the right. White dashed lines indicate disc outlines, and red dashed lines indicate the dorsoventral compartment boundary. Panels on the right are magnifications of the areas indicated by the blue dashed boxes. Images are representative of at least five wing discs. (F) Adult wings of control flies (carrying a reintegration of the wild-type genomic Mad sequence in mad[attP, KO]) and flies that only contain Mad-PA. The graph shows relative wing size (as a percentage) of the indicated genotypes, shown as mean±s.d. Dots represent the measured size of individual wings isolated from male flies (control, n=30; Mad-PA only, n=40). Statistical significance was analyzed by a two-tailed unpaired t-test with Welch's correction assuming unequal variances. **P≤0.01. Scale bars: 50 μm (B-E); 250 μm (F).
Fig. 5.
Fig. 5.
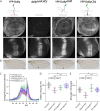
In locus structure-function analysis of Dally. (A) Schematic illustration of the analyzed versions of Dally: YFP-Dally, dally[attp,KO], YFP-DallyΔGPI and YFP-DallyCD2. Anti-GFP and anti-pMad staining of wing discs of larvae carrying the modified Dally alleles in homozygosity. Scale bars: 50 μm. (B) Adult wings of the Dally versions shown in A. All flies carried the respective modified Dally allele over the dallyMH32 null allele. Wings were collected from male flies. Black arrowheads indicate truncation of longitudinal vein 5. Scale bar: 250 μm. (C) Average pMad fluorescence intensity of wing discs homozygous for the Dally versions indicated in A, shown as mean±s.d. (D,E) Relative wing size (as a percentage) (D) and anterior-posterior (AP) length/proximal-distal (PD) length (E) of the indicated genotypes, shown as mean±s.d. Dots represent the measured values of individual wings isolated from male flies (YFP-Dally, n=56; dally[attp,KO], n=32; YFP-DallyΔGPI, n=33; YFP-DallyCD2, n=76). All flies carried the respective modified Dally allele over the dallyMH32 null allele. Statistical significance was analyzed by a two-tailed unpaired t-test with Welch's correction assuming unequal variances. ns, not significant, P>0.05; **P≤0.01; ****P≤0.0001.
Fig. 6.
Fig. 6.
The HA toolbox. (A) Overview of the HA tools comprising FB-GFP, deGradHA, GrabHAExt, GrabHAInt and GrabHA-ECM. aa, amino acids; CDS, coding sequence; NSlmb, N-terminal part of Slmb; SP, signal peptide; TM, transmembrane domain. (B) Anti-pMad and anti-Brk staining of wing discs expressing HA-Dpp, GrabHAExt in dpp producing cells or a combination of both. The anterior-posterior compartment boundary is marked by red dashed lines. Scale bars: 50 μm. (C) Anti-Brk and anti-BrdU staining of wing discs expressing HA- or YFP-tagged versions of Brk either alone or in combination with the indicated tool in the dorsal compartment using ap-Gal4. Red dashed lines mark the dorsoventral compartment boundary. Adult wings of males carrying HA- or YFP-tagged versions of Brk either alone or in combination with overexpression of GrabHAInt or iGFPi throughout the wing pouch using nub-Gal4 are shown below. Scale bars: 50 μm (wing discs); 250 μm (adult wings). Images are representative of at least five wing discs or 15 adult wings.

References

    1. Affolter, M. and Basler, K. (2007). The Decapentaplegic morphogen gradient: from pattern formation to growth regulation. Nat. Rev. Genet. 8, 663-674. 10.1038/nrg2166 - DOI - PubMed
    1. Akiyama, T., Kamimura, K., Firkus, C., Takeo, S., Shimmi, O. and Nakato, H. (2008). Dally regulates Dpp morphogen gradient formation by stabilizing Dpp on the cell surface. Dev. Biol. 313, 408-419. 10.1016/j.ydbio.2007.10.035 - DOI - PMC - PubMed
    1. Akiyama, T., Raftery, L. A. and Wharton, K. A. (2024). Bone morphogenetic protein signaling: the pathway and its regulation. Genetics 226, iyad200. 10.1093/genetics/iyad200 - DOI - PMC - PubMed
    1. Ashe, H. L. and Briscoe, J. (2006). The interpretation of morphogen gradients. Development 133, 385-394. 10.1242/dev.02238 - DOI - PubMed
    1. Baeg, G. H., Lin, X., Khare, N., Baumgartner, S. and Perrimon, N. (2001). Heparan sulfate proteoglycans are critical for the organization of the extracellular distribution of Wingless. Development 128, 87-94. 10.1242/dev.128.1.87 - DOI - PubMed

MeSH terms

Substances

LinkOut - more resources