

Retinal Function in Advanced Multiple Sclerosis
- PMID: 39495184
- PMCID: PMC11539974
- DOI: 10.1167/iovs.65.13.2
Retinal Function in Advanced Multiple Sclerosis
Abstract
Purpose: People with multiple sclerosis (pwMS) experience autoimmunity-mediated inflammation and neurodegeneration throughout the central nervous system. There remains a need for clinically accessible, reliable functional markers of neurodegeneration in MS. Previous research has described changes to electroretinography (ERG)-derived measures of retinal bipolar cell function in pwMS early in the disease course. We, therefore, investigated ERG as a potential outcome measure in individuals with more advanced disease.
Methods: This cross-sectional observational study included pwMS with Expanded Disability Status Scale (EDSS) scores of ≥3.0 and healthy control (HC) participants who underwent ERG, optical coherence tomography, high- and low-contrast visual acuity measurement, and an ophthalmological examination. ERG findings in MS eyes with and without previous optic neuritis (MS +ON; MS -ON) were compared with those in HC eyes. Effects of EDSS, disease duration, ON, and treatment status on selected ERG outcomes were measured. Additional exploratory analyses assessed potential influences of MS phenotype and disease status (clinically active, radiologically active, and disease progression).
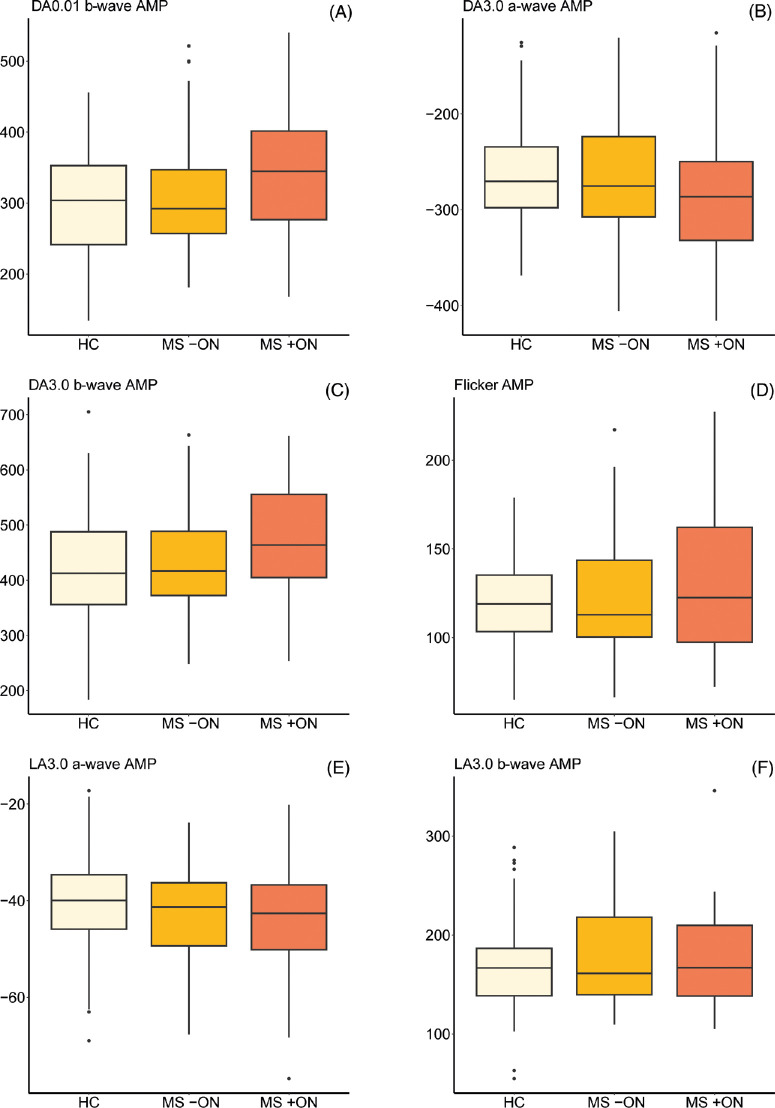
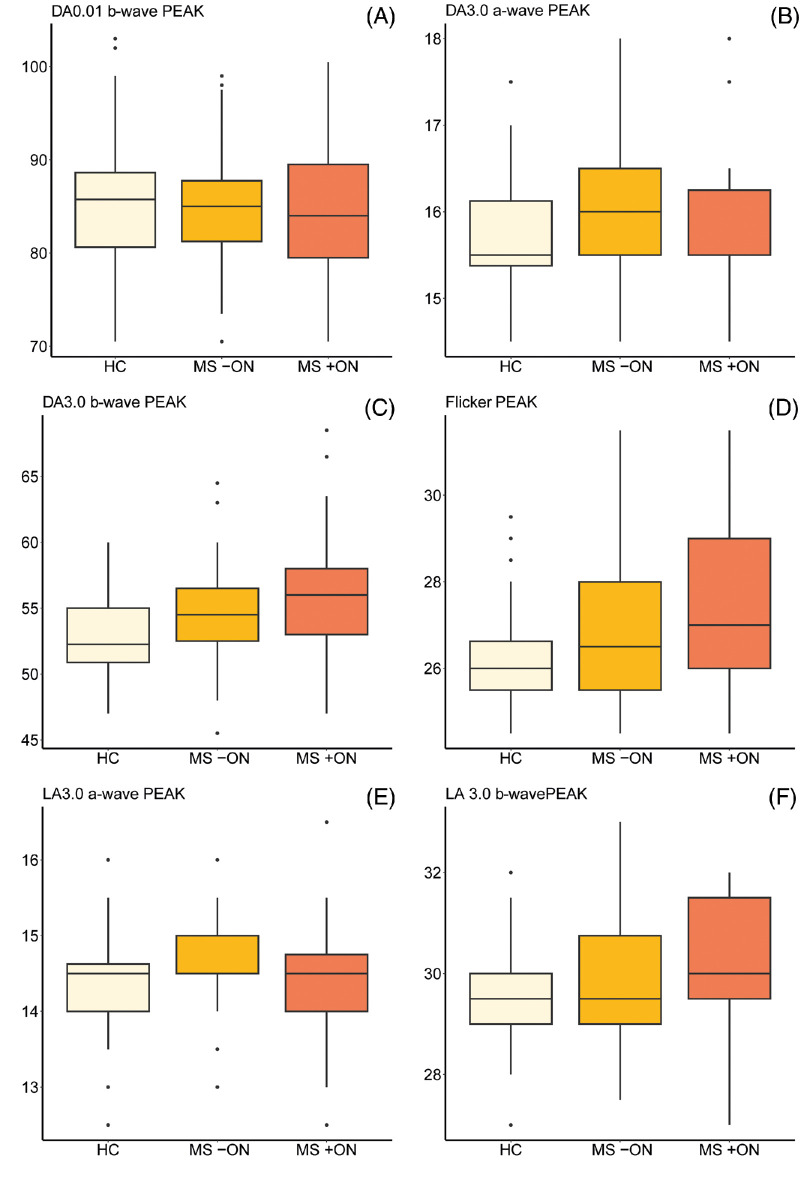
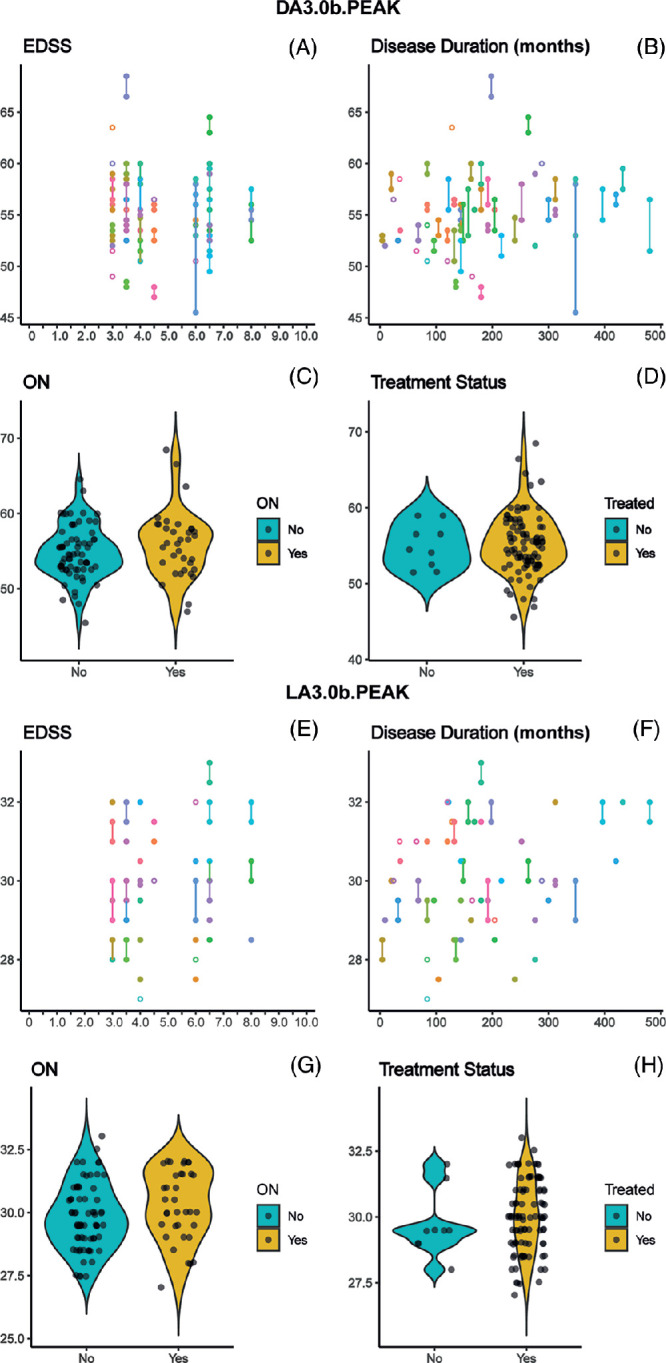
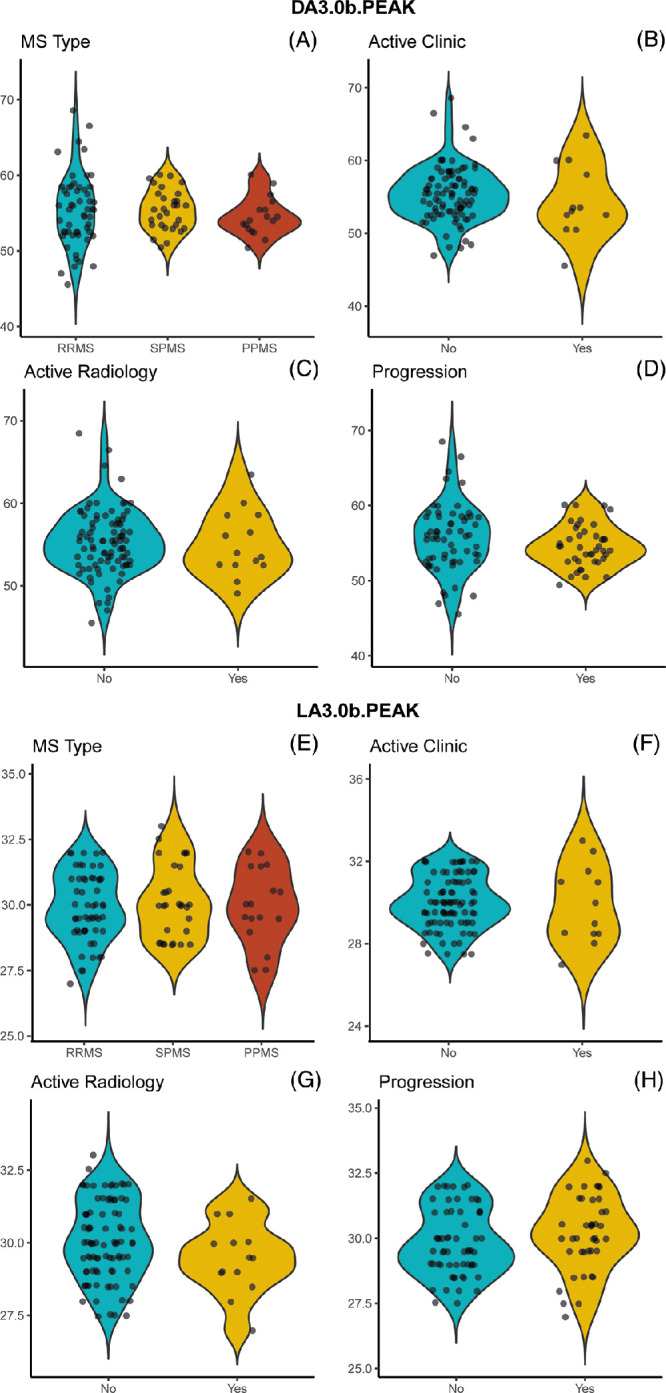
Results: Delays to two ERG peak times (dark-adapted 3.0 b-wave; light-adapted flicker) were recorded in MS +ON and MS -ON eyes. No influences of EDSS score, disease duration, previous ON, or treatment status were observed. Exploratory analyses were consistent with no effects of MS phenotype or disease status.
Conclusions: ERG findings are abnormal in individuals with moderate-severe disability caused by MS; however, these findings are not distinct from those observed earlier in the disease course. Although bipolar dysfunction appears to be common in pwMS throughout the disease course, ERG is likely not useful in monitoring or prognostication of MS.
Conflict of interest statement
Disclosure:
Figures
References
-
- Jakimovski D, Bittner S, Zivadinov R, et al. .. Multiple sclerosis. Lancet. 2024; 403: 183–202. Accessed Nov 07, 2023. - PubMed
-
- Thompson AJ, Banwell BL, Barkhof F, et al. .. Diagnosis of multiple sclerosis: 2017 revisions of the McDonald criteria. Lancet Neurol. 2018; 17: 162–173. Accessed 26 Dec, 2017. - PubMed
-
- Lublin FD, Reingold SC, National Multiple Sclerosis Society (USA) Advisory Committee on Clinical Trials of New Agents in Multiple Sclerosis. Defining the clinical course of multiple sclerosis. Results of an international survey. Neurology. 1996; 46: 907–911. - PubMed
Publication types
MeSH terms
LinkOut - more resources
Full Text Sources
Medical
Miscellaneous
