. 2025 Jan 15;85(2):231-250.
doi: 10.1158/0008-5472.CAN-24-2248.

FOXR2 Targets LHX6+/DLX+ Neural Lineages to Drive Central Nervous System Neuroblastoma

Affiliations

FOXR2 Targets LHX6+/DLX+ Neural Lineages to Drive Central Nervous System Neuroblastoma

Selin Jessa et al. Cancer Res. .

Abstract

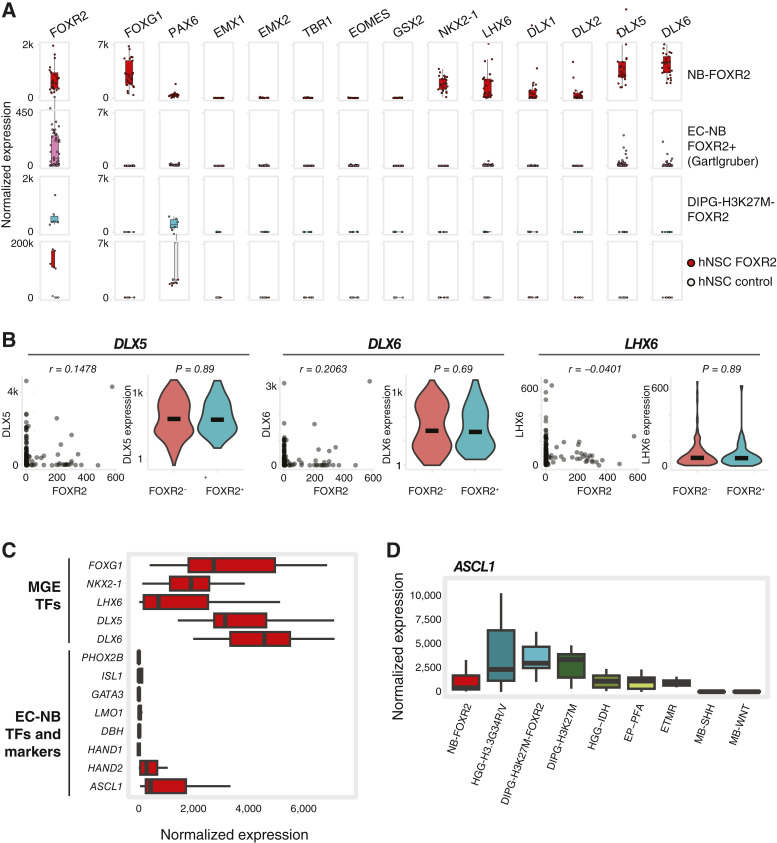
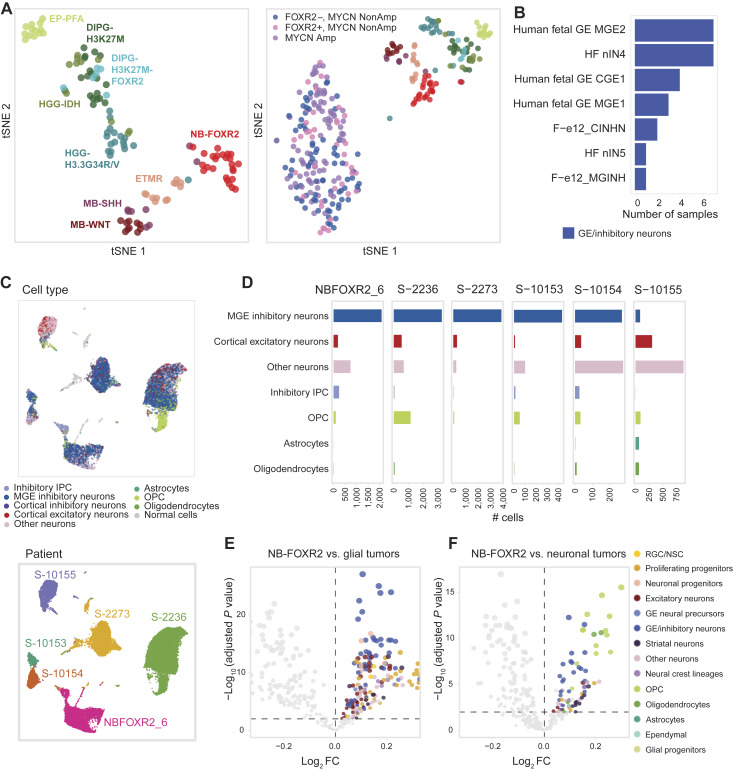
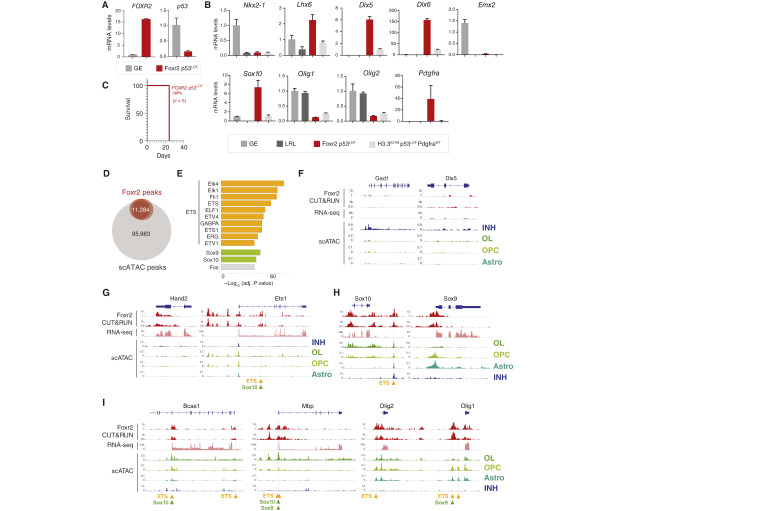
Central nervous system neuroblastoma with forkhead box R2 (FOXR2) activation (NB-FOXR2) is a high-grade tumor of the brain hemispheres and a newly identified molecular entity. Tumors express dual neuronal and glial markers, leading to frequent misdiagnoses, and limited information exists on the role of FOXR2 in their genesis. To identify their cellular origins, we profiled the transcriptomes of NB-FOXR2 tumors at the bulk and single-cell levels and integrated these profiles with large single-cell references of the normal brain. NB-FOXR2 tumors mapped to LHX6+/DLX+ lineages derived from the medial ganglionic eminence, a progenitor domain in the ventral telencephalon. In vivo prenatal Foxr2 targeting to the ganglionic eminences in mice induced postnatal cortical tumors recapitulating human NB-FOXR2-specific molecular signatures. Profiling of FOXR2 binding on chromatin in murine models revealed an association with ETS transcriptional networks, as well as direct binding of FOXR2 at key transcription factors that coordinate initiation of gliogenesis. These data indicate that NB-FOXR2 tumors originate from LHX6+/DLX+ interneuron lineages, a lineage of origin distinct from that of other FOXR2-driven brain tumors, highlight the susceptibility of ventral telencephalon-derived interneurons to FOXR2-driven oncogenesis, and suggest that FOXR2-induced activation of glial programs may explain the mixed neuronal and oligodendroglial features in these tumors. More broadly, this work underscores systematic profiling of brain development as an efficient approach to orient oncogenic targeting for in vivo modeling, critical for the study of rare tumors and development of therapeutics. Significance: Profiling the developing brain enabled rationally guided modeling of FOXR2-activated CNS neuroblastoma, providing a strategy to overcome the heterogeneous origins of pediatric brain tumors that hamper tumor modeling and therapy development. See related commentary by Orr, p. 195.


Conflict of interest statement

P. Bandopadhayay reports grants from the Novartis Institute of Biomedical Research and personal fees from Day One Biopharmaceuticals outside the submitted work. No disclosures were reported by the other authors.

Figures

Figure 1.
Figure 1.
A cohort of CNS neuroblastoma with FOXR2 activation (NB-FOXR2). A, Oncoprint of assembled cohort of NB-FOXR2 and other brain tumor entities, profiled by bulk and/or scRNA-seq. B, Expression of FOXR2 by bulk RNA-seq across brain tumor subtypes. DIPG-H3K27M-FOXR2, DIPG, H3K27M altered, and FOXR2 activated; DIPG-H3K27M, DIPG, H3K27M altered; EP-PFA, posterior fossa group A ependymoma; ETMR, embryonal tumors with multilayered rosettes; HGG-IDH, HGG, IDH-mutant; HGG-H3.3G34R/V, HGG, H3.3G34R/V altered; MB-SHH, SHH medulloblastoma; MB-WNT, WNT medulloblastoma.
Figure 2.
Figure 2.
NB-FOXR2 expresses a TF fingerprint of the MGE. A, Expression of telencephalon-patterning TFs in the embryonal mouse brain. Top, stereo-seq in situ RNA expression of telencephalon-patterning TFs in E14 mouse (Chen and colleagues, ref. ; https://db.cngb.org/stomics/mosta/spatial/). Middle, RNA in situ hybridization in E13 mouse (Allen Brain Atlas, https://developingmouse.brain-map.org/). Bottom, schematic of the mouse brain (sagittal section) at E13, and schematized expression of each TF in the telencephalon. B, Evaluation of SVM-based classification of neuron clusters from normal fetal and adult brain scRNA-seq datasets based on expression levels of telencephalon-patterning TFs in each cluster. Precision and recall metrics are calculated across clusters in each class in each dataset and are shown for each fold of a four-fold cross-validation experiment (one point per fold) for the adult datasets. Top, adult human dataset; bottom, adult mouse dataset. C, Expression of telencephalon TF fingerprint across normal brain and tumor datasets. Left, expression in clusters of single cells from reference datasets of the human and mouse fetal and adult brains aggregated by class (dorsal, CGE/LGE, and MGE). Scaling was performed within each dataset. Human 1, data from Yu and colleagues (38). Human 2, data from Shi and colleagues (39). Middle, expression in NB-FOXR2 tumors profiled by bulk RNA-seq and in malignant cells of NB-FOXR2 tumors profiled by scRNA-seq. For single-cell tumors, scaling was performed between malignant and normal cells of the same sample (normal cells not shown). For bulk RNA-seq, bubble size encodes log10-transformed median normalized expression across samples in each brain tumor subtype. Right, expression in other brain tumors profiled by bulk RNA-seq. DIPG-H3K27M-FOXR2, DIPG, H3K27M altered, and FOXR2 activated; DIPG-H3K27M, DIPG, H3K27M altered; EP-PFA, posterior fossa group A ependymoma; ETMR, embryonal tumors with multilayered rosettes; HGG-IDH, HGG, IDH-mutant; HGG-H3.3G34R/V, HGG, H3.3G34R/V altered; MB-SHH, SHH medulloblastoma; MB-WNT, WNT medulloblastoma.
Figure 3.
Figure 3.
FOXR2 does not induce expression of MGE or EC-NB TFs. A, Bulk RNA-seq expression of telencephalon patterning TFs. Top and third rows, tumor samples from this study cohort. Second row, EC-NB samples (Gartlgruber and colleagues, ref. 21) subset to high risk, stage 4 samples with FOXR2 expression (normalized expression >2). Bottom row, H9 human NSCs transduced with HA-FOXR2 or controls transduced with HcRed (Tsai and colleagues, ref. 7). All expression box plots except FOXR2 have a y-axis maximum value of 7,000. B, Comparison of TF expression with FOXR2 status in EC-NB (Gartlgruber and colleagues, ref. 21) subset to high risk, stage 4 samples (n = 229). Left, correspondence between FOXR2 expression and TF expression, annotated with Pearson correlation. Right, TF expression in samples split by FOXR2 positivity, annotated with P value (Wilcoxon test). FOXR2+ tumors, normalized expression >2. Y-axis for DLX5 and DLX6 violin plots are log10-scaled. C, Bulk RNA-seq expression in NB-FOXR2 of MGE and EC-NB TFs and markers. D, Bulk RNA-seq expression of ASCL1 across pediatric brain tumor types. DIPG-H3K27M-FOXR2, DIPG, H3K27M altered, and FOXR2 activated; DIPG-H3K27M, DIPG, H3K27M altered; EP-PFA, posterior fossa group A ependymoma; ETMR, embryonal tumors with multilayered rosettes; HGG-IDH, HGG, IDH-mutant; HGG-H3.3G34R/V, HGG, H3.3G34R/V-altered; MB-SHH, SHH medulloblastoma; MB-WNT, WNT medulloblastoma.
Figure 4.
Figure 4.
NB-FOXR2 tumors transcriptionally resemble interneurons and OPC cells. A,t-Distributed stochastic neighbor embedding (t-SNE) of bulk RNA-seq profiles of pediatric brain tumors (left) and pediatric brain tumors with stage 4 high-risk EC-NBs from Gartlgruber and colleagues (ref. ; right) using ssGSEA scores for N = 374 cell type–specific gene signatures from reference scRNA-seq datasets. t-Distributed stochastic neighbor embedding perplexity = 10 for left and perplexity = 30 for right. Color legend for pediatric brain tumors in the right panel matches labels in the left panel. FOXR2+ tumors, normalized expression >2. B, Tally of the top-scoring signatures across NB-FOXR2 bulk tumors (N = 25). The X-axis indicates the number of samples in which each signature is the top match by ssGSEA (Supplementary Table S10). HF nIN4/HF nIN5, human fetal interneuron 4 and 5; F-e12 CINHN, forebrain E12 cortical inhibitory neurons; F-e12 MGINH, forebrain E12 MGE inhibitory neurons; human fetal GE MGE/CGE, human fetal GE progenitors. C, Uniform Manifold Approximation and Projection joint representation of NB-FOXR2 tumors (N = 6) profiled by snRNA-seq. Top, points colored by consensus cell type annotation based on a reference dataset of the developing mouse brain. Gray, nonmalignant cells. Bottom, points colored by sample. Samples are joined without integration or batch correction. D, Number of malignant cells per consensus projected cell type across NB-FOXR2 tumors profiled by snRNA-seq (N = 6). Cell classes comprising >2% cells per sample are shown. E, Volcano plot for differential ssGSEA enrichment of cell type–specific signatures in bulk NB-FOXR2 compared with other tumor entities. Point size reflects −log10(adjusted P value). Differential testing was performed with t tests between NB-FOXR2 tumors and glial tumors (HGGs, DIPGs, posterior fossa group A ependymoma), followed by multiple testing correction using the Benjamini–Hochberg procedure. A positive FC represents enrichment in NB-FOXR2. Each point represents one signature, and signatures with positive log FCs and adjusted P value < 0.01 are colored. Color legend as in F. F, Differential ssGSEA enrichment as in E, comparing NB-FOXR2 tumors with neuronal tumors (ETMR, MB-SHH, and MB-WNT). Amp, amplified; EP-PFA, posterior fossa group A ependymoma; IPC, intermediate progenitor cell; NonAmp, nonamplified; RGC, radial glial cells.
Figure 5.
Figure 5.
Foxr2 is oncogenic in the ventral telencephalon in mice. A, Schematic describing the IUE-based strategy to model FOXR2-driven brain tumors. PiggyBac and CRISPR vectors are delivered into neural stem cells in the GEs at E12.5. After birth, mice develop tumors and are euthanized when neurologic symptoms become apparent. B, Representative brightfield (BF) and fluorescence (GFP) images of a GFP+ Foxr2-driven tumor (top, whole brain; bottom, coronal section). C, Kaplan–Meier survival curves of tumor-bearing mice carrying Foxr2 overexpression alone (Foxr2 alone, n = 6) or in combination with p53 LOF (Foxr2 p53LOF, n = 6). Statistical comparisons using the log-rank Mantel–Cox test are described in Supplementary Table S1. D, Immunofluorescence of Foxr2 alone tissue in coronal sections from the striatum. Lesions driven by Foxr2 overexpression alone are GFP+ and colocalize with V5. Cells harboring Foxr2 overexpression alone possess low levels of Ki67 and Olig2. However, cells in these lesions are positive for NeuN, DCX, and GFAP. Scale bar, 50 μm. E, IHC detection of hematoxylin and eosin (H&E), GFP, and Ki67 in coronal forebrain sections from Foxr2 p53LOF tumor-bearing symptomatic mice. Tumor cells are GFP+. Scale bars, 1 mm in the low-magnification panels and 100 μm in the high-magnification panels. F, Immunofluorescence for GFP, Foxr2-V5, Ki67, Olig2, NeuN, DCX, and GFAP in coronal forebrain sections from Foxr2 p53LOF tumor-bearing symptomatic mice. Cells within the tumor in the striatum are GFP+, colocalize with V5, and many are actively proliferating, as indicated by the presence of Ki67. Individual tumor cells are also positive for Olig2, NeuN, DCX, and GFAP. Scale bar, 50 μm.
Figure 6.
Figure 6.
Mouse models transcriptomically recapitulate human NB-FOXR2. A, Heatmap showing CNVs in Foxr2 p53LOF and Foxr2 alone models, computed with inferCNV. B, Top, Uniform Manifold Approximation and Projection (UMAP) joint representation of mouse model single-cell datasets (n = 3) without integration or batch correction. Cells colored by broad cell class derived from automated cell type annotation, with nonmalignant cells colored in gray. Bottom, bar plot quantification of number of cells per group in UMAP. C, Volcano plots of differentially expressed genes between bulk RNA-seq tumors in NB-FOXR2 compared with MB-WNT, DIPG-H3K27M, and embryonal tumors with multilayered rosettes (ETMR) groups. Points colored in red are the top 100 differentially expressed genes in common across comparisons, used as a tumor signature of NB-FOXR2. D, Validation of tumor signature expression specificity in each tumor type. Heatmap showing bulk RNA expression of tumor signature genes (rows) in each tumor sample (columns). Row values are Z-scored. E, UMAP joint representation of mouse models as in B, with malignant neuron-like cells colored by the ssGSEA score of each tumor signature. F, Distribution of tumor signature ssGSEA scores in malignant neuron-like cells of murine models. Each row is one sample. Adj, adjusted; chr, chromosome; DIPG-H3K27M, DIPG, H3K27M altered; MB-WNT, WNT medulloblastoma.
Figure 7.
Figure 7.
Foxr2 chromatin binding sites in Foxr2 p53LOF neurosphere show enrichment in ETS and glial pathways. A, Validation of FOXR2 overexpression and p53 downregulation in ex vivoFoxr2 p53LOF neurospheres by qRT-PCR. B, Validation of Nkx2-1, Lhx6, Dlx5, Dlx6, Emx2, Sox10, Olig1, Olig2, and Pdgfra expression in Foxr2 p53LOF neurospheres by qRT-PCR. Foxr2 p53LOF cell lines are positive for MGE markers and mirror the transcriptomic profile observed in patients. C, Kaplan–Meier curves depicting survival following orthotopic (striatal) injection of 150,000 Foxr2 p53LOF cells (n = 5). D, Intersection of Foxr2 CUT&RUN peaks (n = 2 replicates) with ATAC peaks from single-cell multiome profiling of the murine Foxr2 p53LOF model, used for filtering peaks. E, Top enriched TF motifs in filtered Foxr2 CUT&RUN peaks by adjusted P value. For visualization, the figure includes the top 13 motifs, colored and grouped by TF types. F, Tracks at Gad1 and Dlx5 genomic regions showing Foxr2 CUT&RUN and bulk RNA-seq in Foxr2 p53LOF murine cell lines and pseudobulk ATAC tracks of malignant cells by cell type from single-cell multiome profiling of Foxr2 p53LOF mouse model tissue. G, Tracks as in F at genomic regions for Hand2 and Ets1. H, Tracks as in F at genomic regions for Sox family glial TFs. I, Tracks as in F at genomic regions for key oligodendrocyte lineage genes. Adj, adjusted; Astro, astrocytes; INH, inhibitory neurons; LRL, lower rhombic lip; OL, oligodendrocytes.

References

    1. Sturm D, Orr BA, Toprak UH, Hovestadt V, Jones DTW, Capper D, et al. . New brain tumor entities emerge from molecular classification of CNS-PNETs. Cell 2016;164:1060–72. - PMC - PubMed
    1. Louis DN, Perry A, Wesseling P, Brat DJ, Cree IA, Figarella-Branger D, et al. . The 2021 WHO classification of tumors of the central nervous system: a summary. Neuro Oncol 2021;23:1231–51. - PMC - PubMed
    1. Korshunov A, Okonechnikov K, Schmitt-Hoffner F, Ryzhova M, Sahm F, Stichel D, et al. . Molecular analysis of pediatric CNS-PNET revealed nosologic heterogeneity and potent diagnostic markers for CNS neuroblastoma with FOXR2-activation. Acta Neuropathol Commun 2021;9:20. - PMC - PubMed
    1. Tauziède-Espariat A, Figarella-Branger D, Métais A, Uro-Coste E, Maurage C-A, Lhermitte B, et al. . CNS neuroblastoma, FOXR2-activated and its mimics: a relevant panel approach for work-up and accurate diagnosis of this rare neoplasm. Acta Neuropathol Commun 2023;11:43. - PMC - PubMed
    1. Capper D, Jones DTW, Sill M, Hovestadt V, Schrimpf D, Sturm D, et al. . DNA methylation-based classification of central nervous system tumours. Nature 2018;555:469–74. - PMC - PubMed

MeSH terms