. 2024 Nov 4;38(1):13.
doi: 10.1007/s13577-024-01139-x.

Establishment and drug resistance characterization of paired organoids using human primary colorectal cancer and matched tumor deposit specimens

Affiliations

Establishment and drug resistance characterization of paired organoids using human primary colorectal cancer and matched tumor deposit specimens

Jiao Deng et al. Hum Cell. .

Abstract

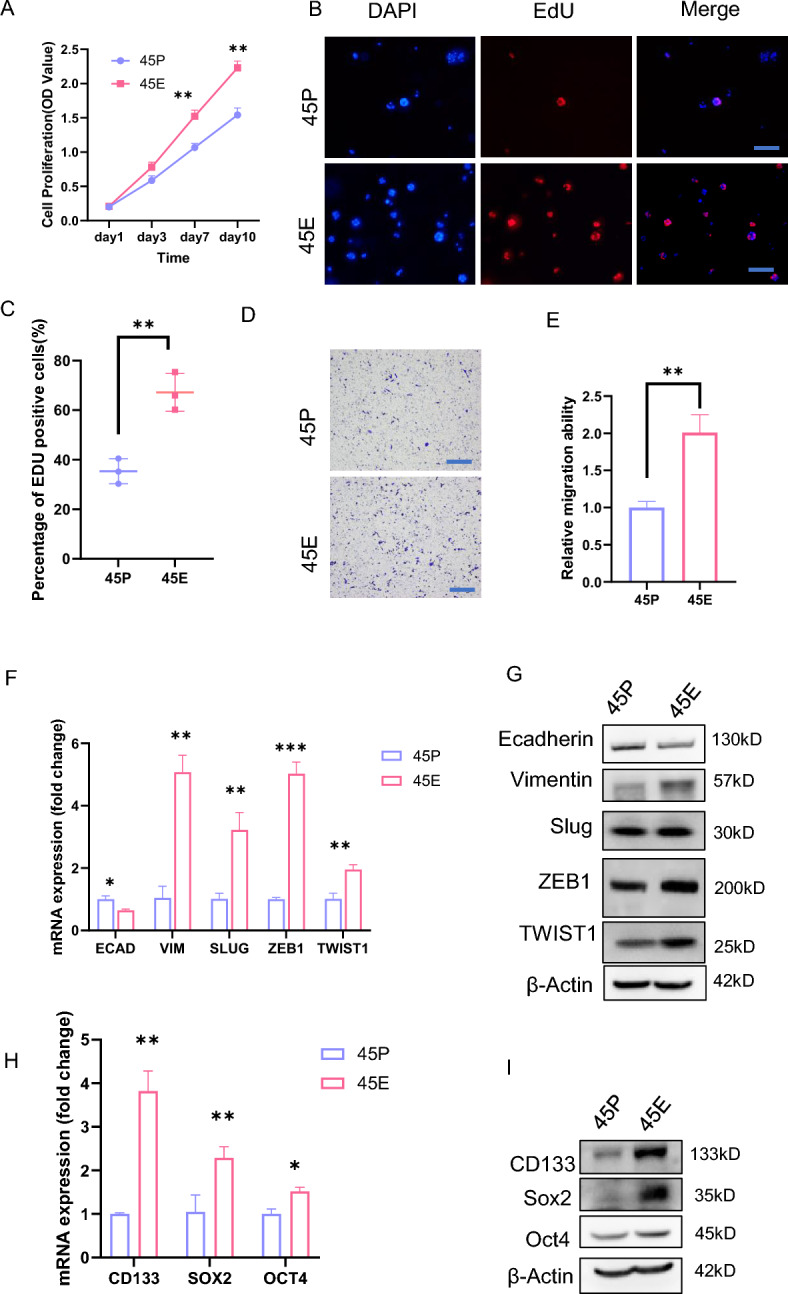
Tumor deposits (TDs) represent a specific form tumor metastasis observed in colorectal cancer (CRC). The lack of successfully established cell lines for TDs, as well as the molecular mechanisms by which TDs occur remain largely unknown. Here, we established paired CRC organoids, including a human primary cancer organoid and its TD organoid, from a 46-year-old male patient with CRC. Further analysis revealed that, compared with primary tumor-derived cells, TD-derived cells exhibited enhanced proliferative, invasive and metastatic capabilities, and increased expression of stemness-related proteins. Furthermore, the present findings also demonstrated that TD-derived cells were more resistant to oxaliplatin or 5-FU. Transcriptomic profiling and qPCR revealed that TD-derived cells exhibited more alterations in fatty acid metabolism signaling and enhanced lipid synthesis ability compared to primary tumor-derived cells. Inhibition of lipid synthesis markedly decreased resistance to oxaliplatin in TD-derived cells. Taken together, the paired organoids established using CRC primary tumor and its TD specimens will provide valuable tools to study tumorigenicity, metastasis and chemoresistance in CRC. Notably, these models will provide novel insights to study tumor heterogeneity and lipid metabolism in CRC.

Keywords: Colorectal cancer; Drug resistance; Organoid; Primary tumor; TD.


Conflict of interest statement

All authors declare no competing interests

Figures

Fig. 1
Fig. 1
Organoids reproduce the tumor heterogeneity of CRC tumors in vitro.A Hematoxylin and eosin staining of the primary CRC tumor and its TD, and their corresponding xenograft and organoid. Primary and Xenograft scale bars, 100 µm; Organoid scale bars, 10 µm. B Immunofluorescence staining of Pan-CK in the primary CRC tumor, and the xenograft and organoid. Primary and Xenograft scale bars, 100 µm; Organoid scale bars, 10 µm. Pan-CK, pan-cytokeratin; C Representative images of paired organoids from primary CRC tumor cells (45P) and matched TD cells (45E) in organoid culture at different days. Left scale bars,200 µm; Right scale bars, 10 µm. D Representative images of clones derived from primary CRC tumor cell-generated organoids (45P) and matched TD cell-generated organoids (45E) in clonal culture at different days. The colonies were manually enumerated, and the cell area was calculated in Image J to ascertain the colony formation efficiency and mean colony area. Quantified analysis was shown. Scale bar, 200 μm. Data are presented as the mean ± SD. **P < 0.05
Fig. 2
Fig. 2
45E possesses distinct biological properties from 45P. A Growth curves of 45P- and 45E-derived cells based on the CCK8 assay. The experiments were repeated three times, and data are presented as the mean ± SD. **P < 0.01. B and C EdU staining of 45P and 45E in EdU incorporation assays. Scale bar, 200 μm. Data are presented as the mean ± SD. Representative images were shown in B. Quantified analysis was shown in C. **P < 0.01. Scale bar, 200 μm. D and E 45P- and 45E-derived cells were assessed in Transwell migration assays. Data are presented as the mean ± SD. Representative images were shown in D. Quantified analysis was shown in E. **P < 0.01. Scale bar, 200 μm. F RT-qPCR analysis of the molecules indicated in 45P- and 45E-derived cells. Data are presented as the mean ± SD. ***P < 0.001, **P < 0.01, *P < 0.05. G Western blot analysis of the molecules indicated in 45P- and 45E-derived cells. (H) RT-qPCR analysis of the molecules indicated in 45P- and 45E-derived cells. Data are presented as the mean ± SD. **P < 0.05, *P < 0.05. I Western blot analysis of the molecules indicated in 45P- and 45E-derived cells
Fig. 3
Fig. 3
Transcriptomic profiling of 45P and 45E. A Heatmap presentation of hierarchical cluster analysis of DEGs. B Volcano plot showing DEGs. The two dashed vertical lines indicate a log2 fold-change of -1 (left) and 1 (right). The dashed horizontal line indicates an adjusted P-value of 0.05. C GO enrichment analysis results (up genes). The vertical coordinate indicates the GO term and the horizontal coordinate indicates the rich factor. The top 20 enriched biological processes were plotted in a bubble map. D GO enrichment analysis results (down genes). The vertical coordinate indicates the GO term and the horizontal coordinate indicates the rich factor. The top 20 enriched biological processes were plotted in a bubble map. EKEGG enrichment analysis results (up genes) were sorted by padjust in descending order, and the top 20 enriched pathways were plotted in a bubble map. F KEGG enrichment analysis results (down genes) were sorted by padjust in descending order, and the top 20 enriched pathways were plotted in a bubble map. G GSEA was performed and revealed the association between the gene expression of 45E-derived cells and activation of epithelial-mesenchymal transition. H GSEA was performed and revealed the association between the gene expression of 45E-derived cells and activation of fatty acid metabolism. I GSEA was performed and revealed the association between the gene expression of 45E-derived cells and activation of wnt signaling pathway. DEGs, differentially expressed genes; KEGG, Kyoto Encyclopedia of Genes and Genomes; GO, Gene Ontology; GSEA, gene set enrichment analysis; padjust, adjusted P-value
Fig. 4
Fig. 4
45E exhibits enhanced drug resistance compared with 45P. A TD gene (the top 100 up-regulated genes) signature scores are associated with chemotherapy resistance. B 45P- and 45E-derived cells were treated with 1 μM oxaliplatin or 1 μM 5-fluorouracil for 5 days in organoid culture. Quantified analysis was shown. Data are presented as the mean ± SD.**P < 0.01, *P < 0.05. (C and D) 45P- and 45E-derived cells were treated with 10 μM oxaliplatin or 10 μM 5-fluorouracil in organoid culture for 24 h and then assessed by apoptosis analysis using flow cytometry. Data are presented as the mean ± SD. Representative images were shown in C. Quantified analysis was shown in D. **P < 0.01. (E and F) 45P- and 45E-derived cells were treated with 1 μM oxaliplatin or 1 μM 5-fluorouracil in clonal culture for 1 week. Representative images were shown in E. Quantified analysis was shown in(F). Data are presented as the mean ± SD.**P < 0.01, *P < 0.05. G 45P- and 45E-derived cells were subcutaneously injected into the mice (5 × 105 cells per injection). At 12 days after transplantation, oxaliplatin was intraperitoneally injected into tumor-bearing mice at a dosage of 10 mg/kg once per week. Tumor volumes were calculated every 5 days and the growth curve was drawn. Tumor volumes are present as mean ± SD (n = 5);*P < 0.05, **P < 0.01. (H and I) Four weeks after tumor implantation the mice from G were sacrificed, and the tumor weight of the subcutaneous xenografts were measured. Representative images were shown in H. Quantified analysis was shown in I Tumor weights are presented as the mean ± SD (n = 5); *P < 0.05, **P < 0.01
Fig. 5
Fig. 5
Lipid metabolism may be reprogrammed in 45E. A Oil red O staining of 45P- and 45E-derived cells. Representative images from experiments repeated three times Scale bar, 50 μm. B Representative images of BODIPY staining in 45P- and 45E-derived cells. Scale bar, 100 μm. C Free fatty acid levels were detected in 45P- and 45E-derived cells. Data are presented as the mean ± SD. **P < 0.01. D Triglyceride levels were examined in 45P- and 45E-derived cells. Data are presented as the mean ± SD. *P < 0.05. E Cholesterol levels were examined in 45P- and 45E-derived cells. Data are presented as the mean ± SD. **P < 0.01. F Reverse transcription-quantitative PCR analysis of the molecules indicated in 45P- and 45E-derived cells. Data are presented as the mean ± SD. ***P < 0.001, **P < 0.01, *P < 0.05. G ATP levels were examined within 45P- and 45E-derived cells. Data are presented as the mean ± SD; ns, no significance. H Western blot analysis of the molecules indicated in 45P- and 45E-derived cells
Fig. 6
Fig. 6
Lipid synthesis inhibitors enhance the chemosensitivity of 45E in vitro and in vivo. A Viability was assessed using a CCK8 assay in 45E-derived cells treated with DMSO, A939572 (10 nM), oxaliplatin (10 μM) and oxaliplatin in combination with A939572 in organoid culture for 24 h. Data are presented as the mean ± SD. ***P < 0.001, **P < 0.01, *P < 0.05. B Viability was assessed using a CCK8 assay in 45E-derived cells treated with DMSO, A922500 (10 μM), oxaliplatin (10 μM) and oxaliplatin in combination with A922500 in organoid culture for 24 h. Data are presented as the mean ± SD. ***P < 0.001, **P < 0.01, *P < 0.05. C and D 45E-derived cells were treated with DMSO, A939572 (10 nM) or A922500 (10 μM), oxaliplatin (1 μM) and oxaliplatin plus A939572 or A922500 in clonal culture for 1 week. Representative images were shown in (C). Quantified analysis was shown in(D). Data are presented as the mean ± SD. **P < 0.01, *P < 0.05. E 45E-derived cells were treated with DMSO, A939572 (10 nM) or A922500 (10 μM), oxaliplatin (10 μM) and oxaliplatin plus A939572 or A922500 in organoid culture for 24 h. Representative images are from triple experiments. Scale bar, 100 μm. F and G 45E-derived cells were treated with DMSO, A939572 (10 nM), oxaliplatin (10 μM) and oxaliplatin plus A939572 in organoid culture for 24 h and then assessed by apoptosis analysis using flow cytometry. Representative images were shown in F. Quantified analysis was shown in G. Data are presented as the mean ± SD. ***P < 0.001, **P < 0.01, *P < 0.05. H 45E-derived cells were subcutaneously injected into the mice (5 × 105 cells per injection). At 12 days after transplantation, oxaliplatin was intraperitoneally injected into tumor-bearing mice at a dosage of 10 mg/kg once per week. Mice were orally fed A939572(30 mg/kg) by using a syringe to administer the 50μL dose once daily/mouse. Tumor volumes were calculated every 5 days and the growth curve was drawn. Tumor volumes are present as mean ± SD (n = 5), ***P < 0.001, **P < 0.01, *P < 0.05. I and J Five weeks after tumor implantation the mice from (H) were sacrificed, and the tumor weight of the subcutaneous xenografts were measured. Representative images were shown in I. Quantified analysis was shown in J. Tumor weights are presented as the mean ± SD (n = 5); ***P < 0.001, **P < 0.01, *P < 0.05

References

    1. Siegel RL, et al. Colorectal cancer statistics, 2023. CA Cancer J Clin. 2023;73(3):233–54. - PubMed
    1. Bhattacharya R, et al. An insight into metastasis: random or evolving paradigms? Pathol Res Pract. 2018;214(8):1064–73. - PubMed
    1. Chen L, et al. Migrastatin analogues target fascin to block tumour metastasis. Nature. 2010;464(7291):1062–6. - PMC - PubMed
    1. Bray F, et al. Global cancer statistics 2018: GLOBOCAN estimates of incidence and mortality worldwide for 36 cancers in 185 countries. CA Cancer J Clin. 2018;68(6):394–424. - PubMed
    1. Dekker E, et al. Colorectal cancer. Lancet. 2019;394(10207):1467–80. - PubMed

LinkOut - more resources