

US Cancer Mortality Trends Among Asian and Pacific Islander Populations
- PMID: 39495513
- PMCID: PMC11581537
- DOI: 10.1001/jamanetworkopen.2024.42451
US Cancer Mortality Trends Among Asian and Pacific Islander Populations
Abstract
Importance: Cancer is the leading cause of death among Asian American individuals and the second leading cause of death among Native Hawaiian and Pacific Islander people.
Objective: To evaluate longitudinal cancer mortality trends from 1999 to 2020 among Asian American and Pacific Islander populations in the US by demographic characteristics.
Design, setting, and participants: This cross-sectional study used the Centers for Disease Control and Prevention Wide-Ranging Online Data for Epidemiologic Research database to obtain age-adjusted cancer death rates among Asian American and Pacific Islander individuals of all ages between January 1, 1999, and December 31, 2020. Data were analyzed from January 12 to March 19, 2024.
Exposures: Age, sex, cancer type, and US census regions.
Main outcomes and measures: Trends and average annual percent changes (AAPCs) in age-adjusted cancer-specific mortality (CSM) rates for non-Hispanic Asian American and Pacific Islander populations were estimated by cancer type, age, sex, and region using Joinpoint regression.
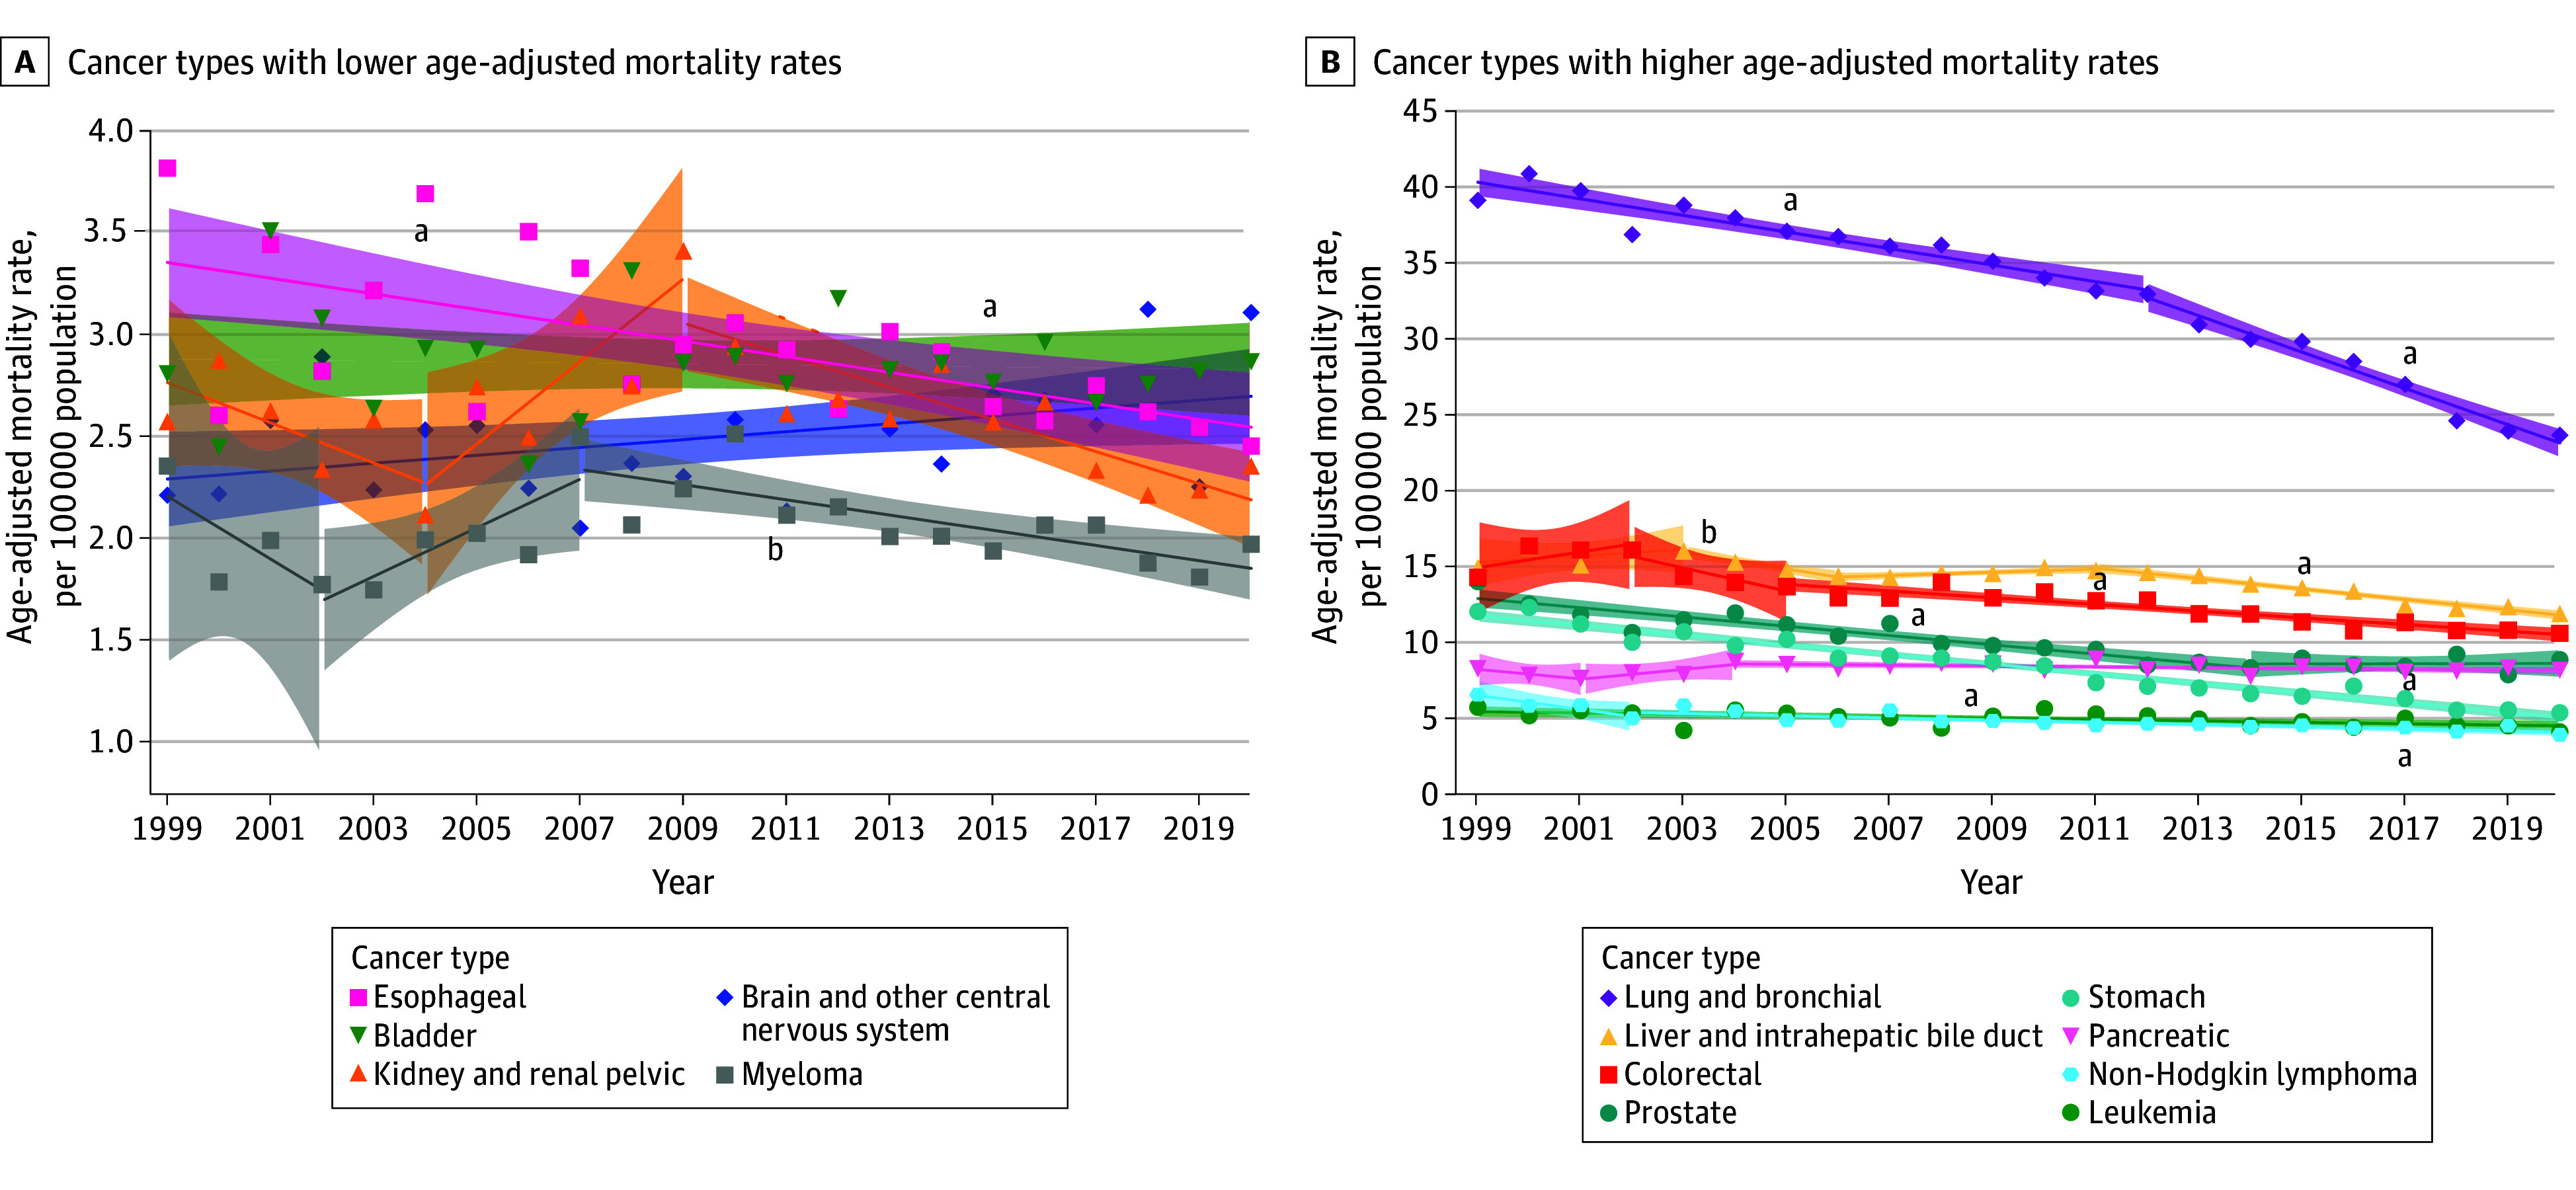
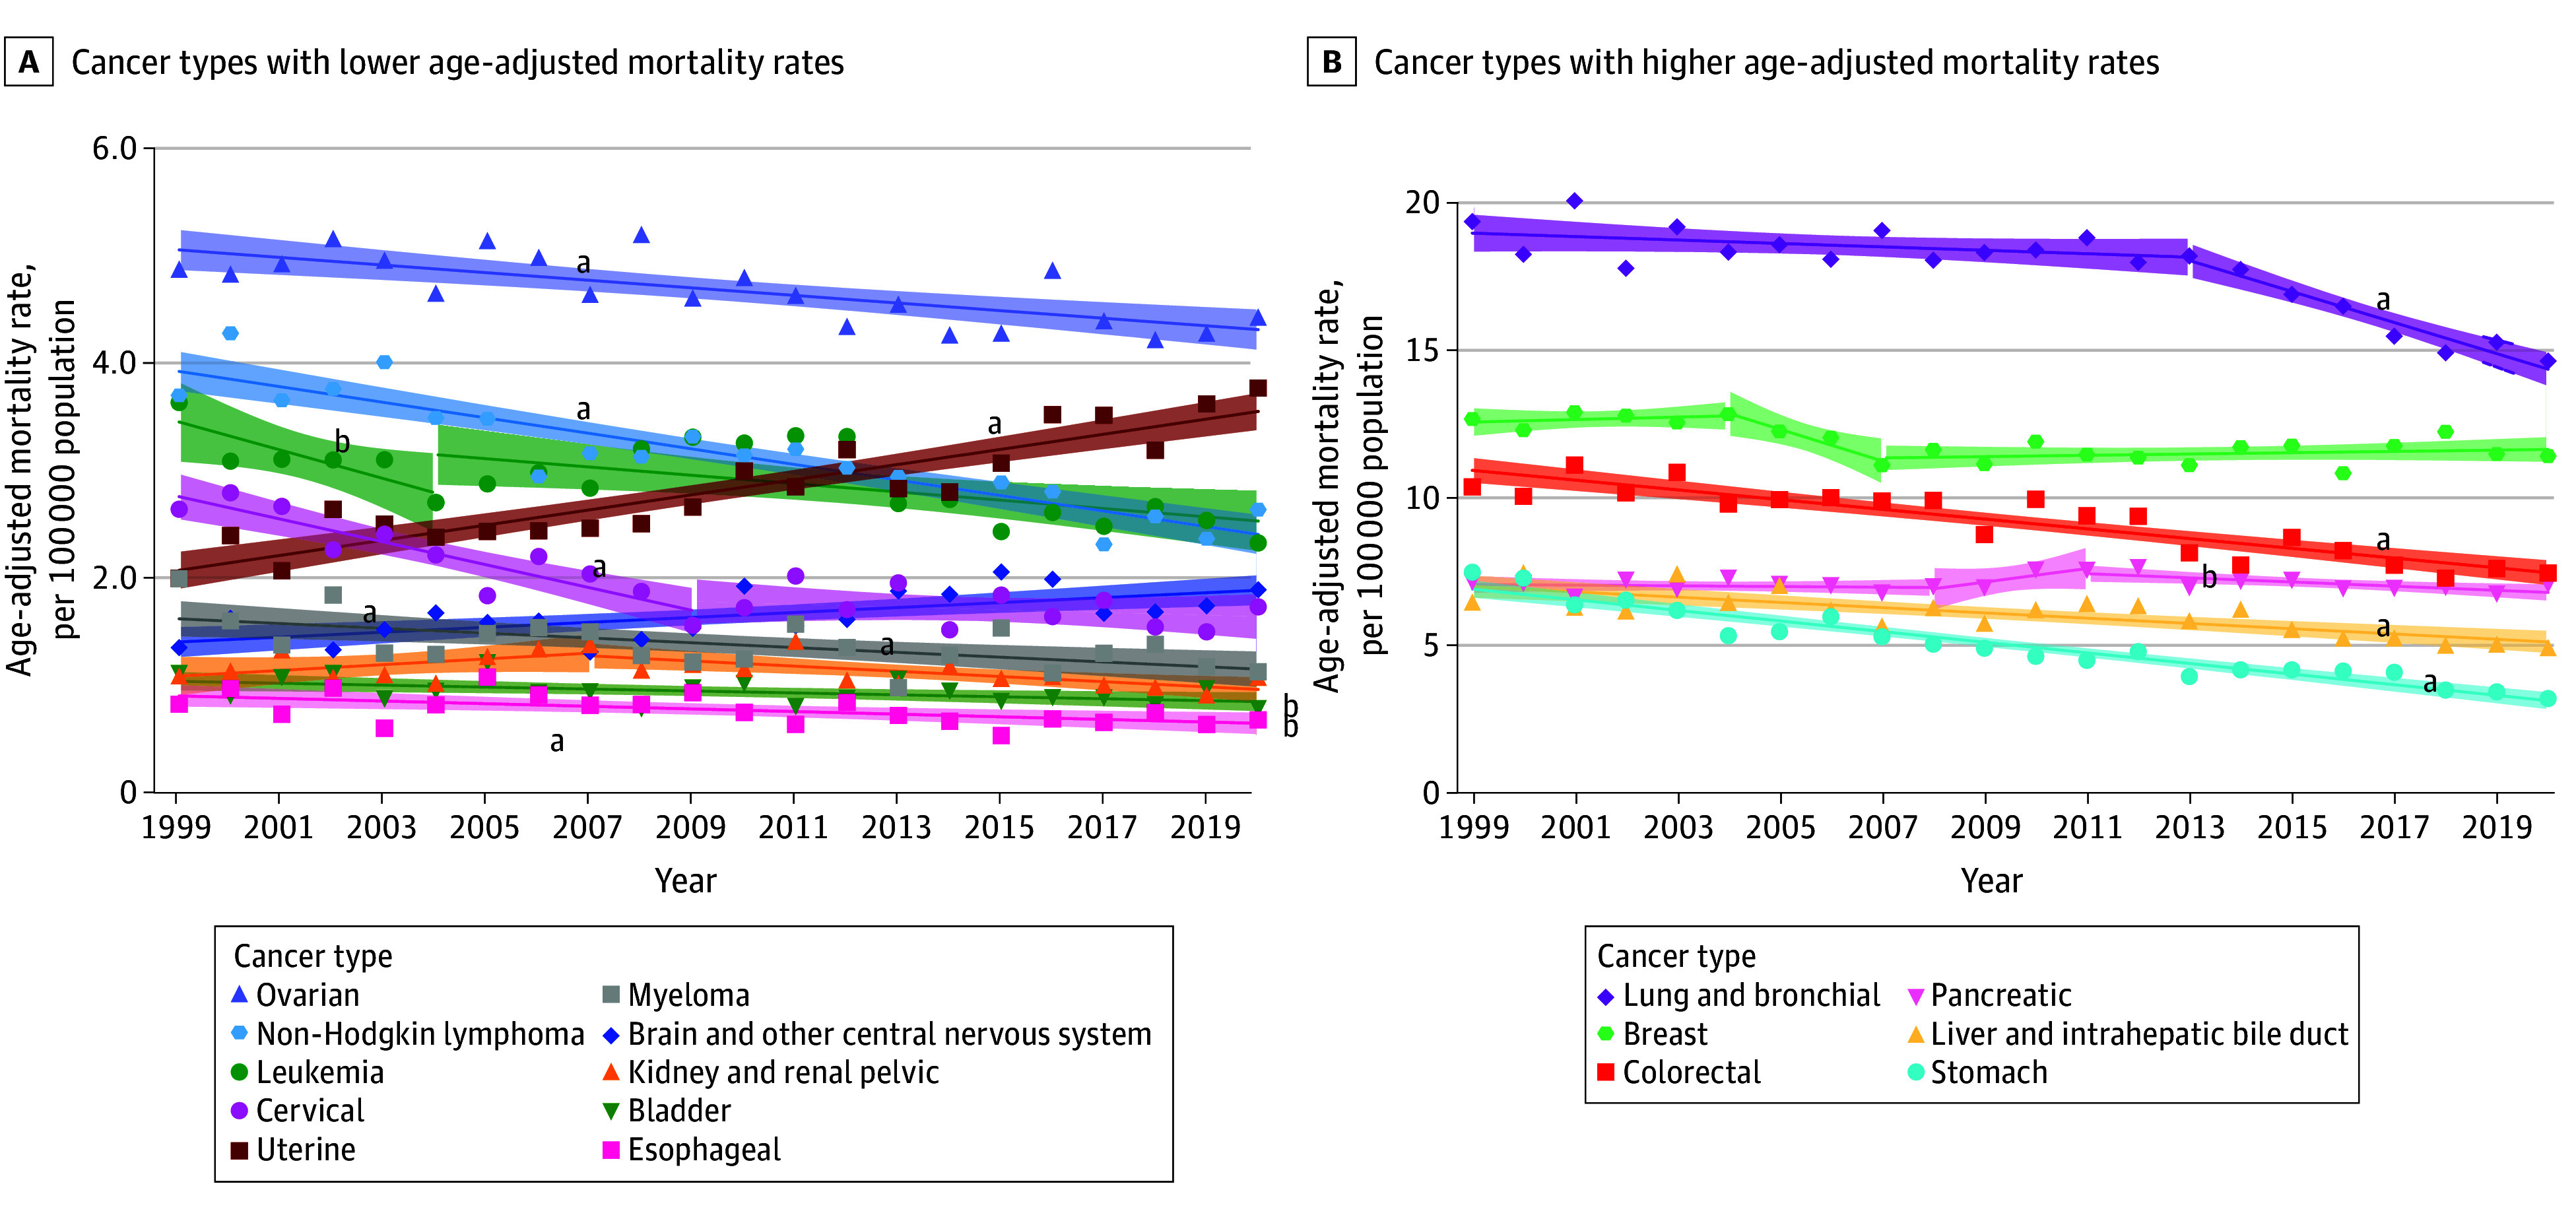
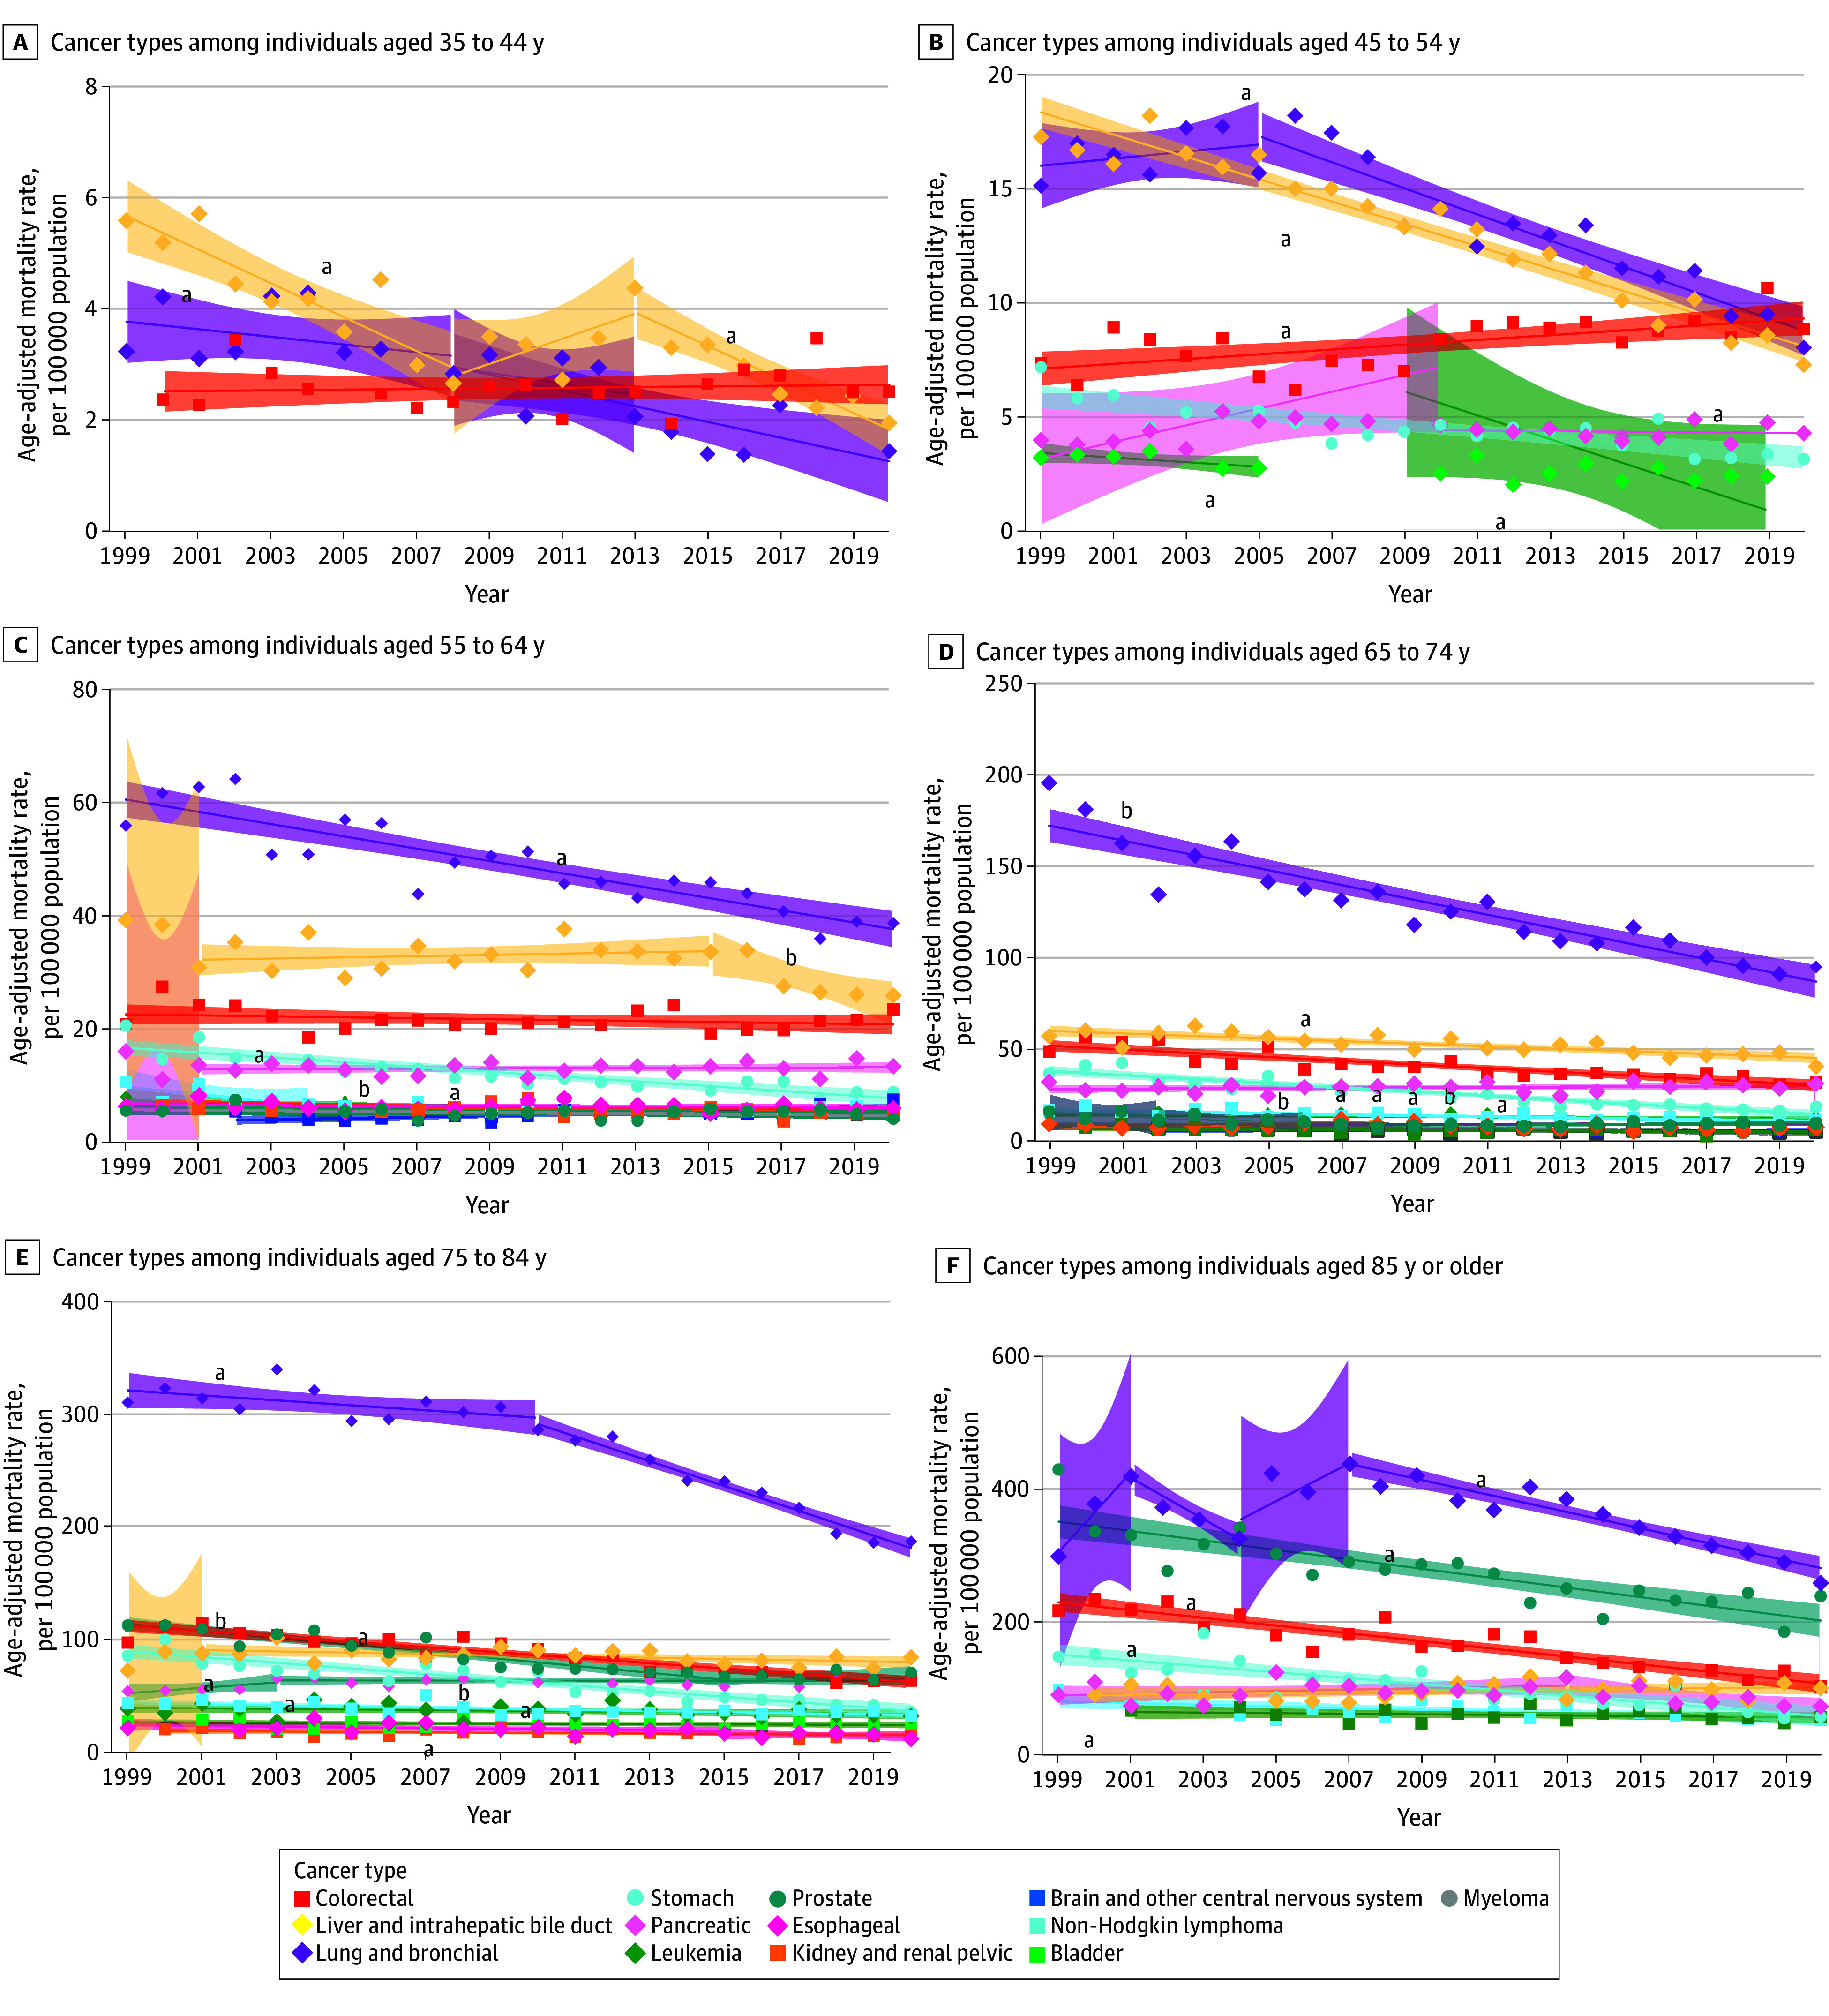
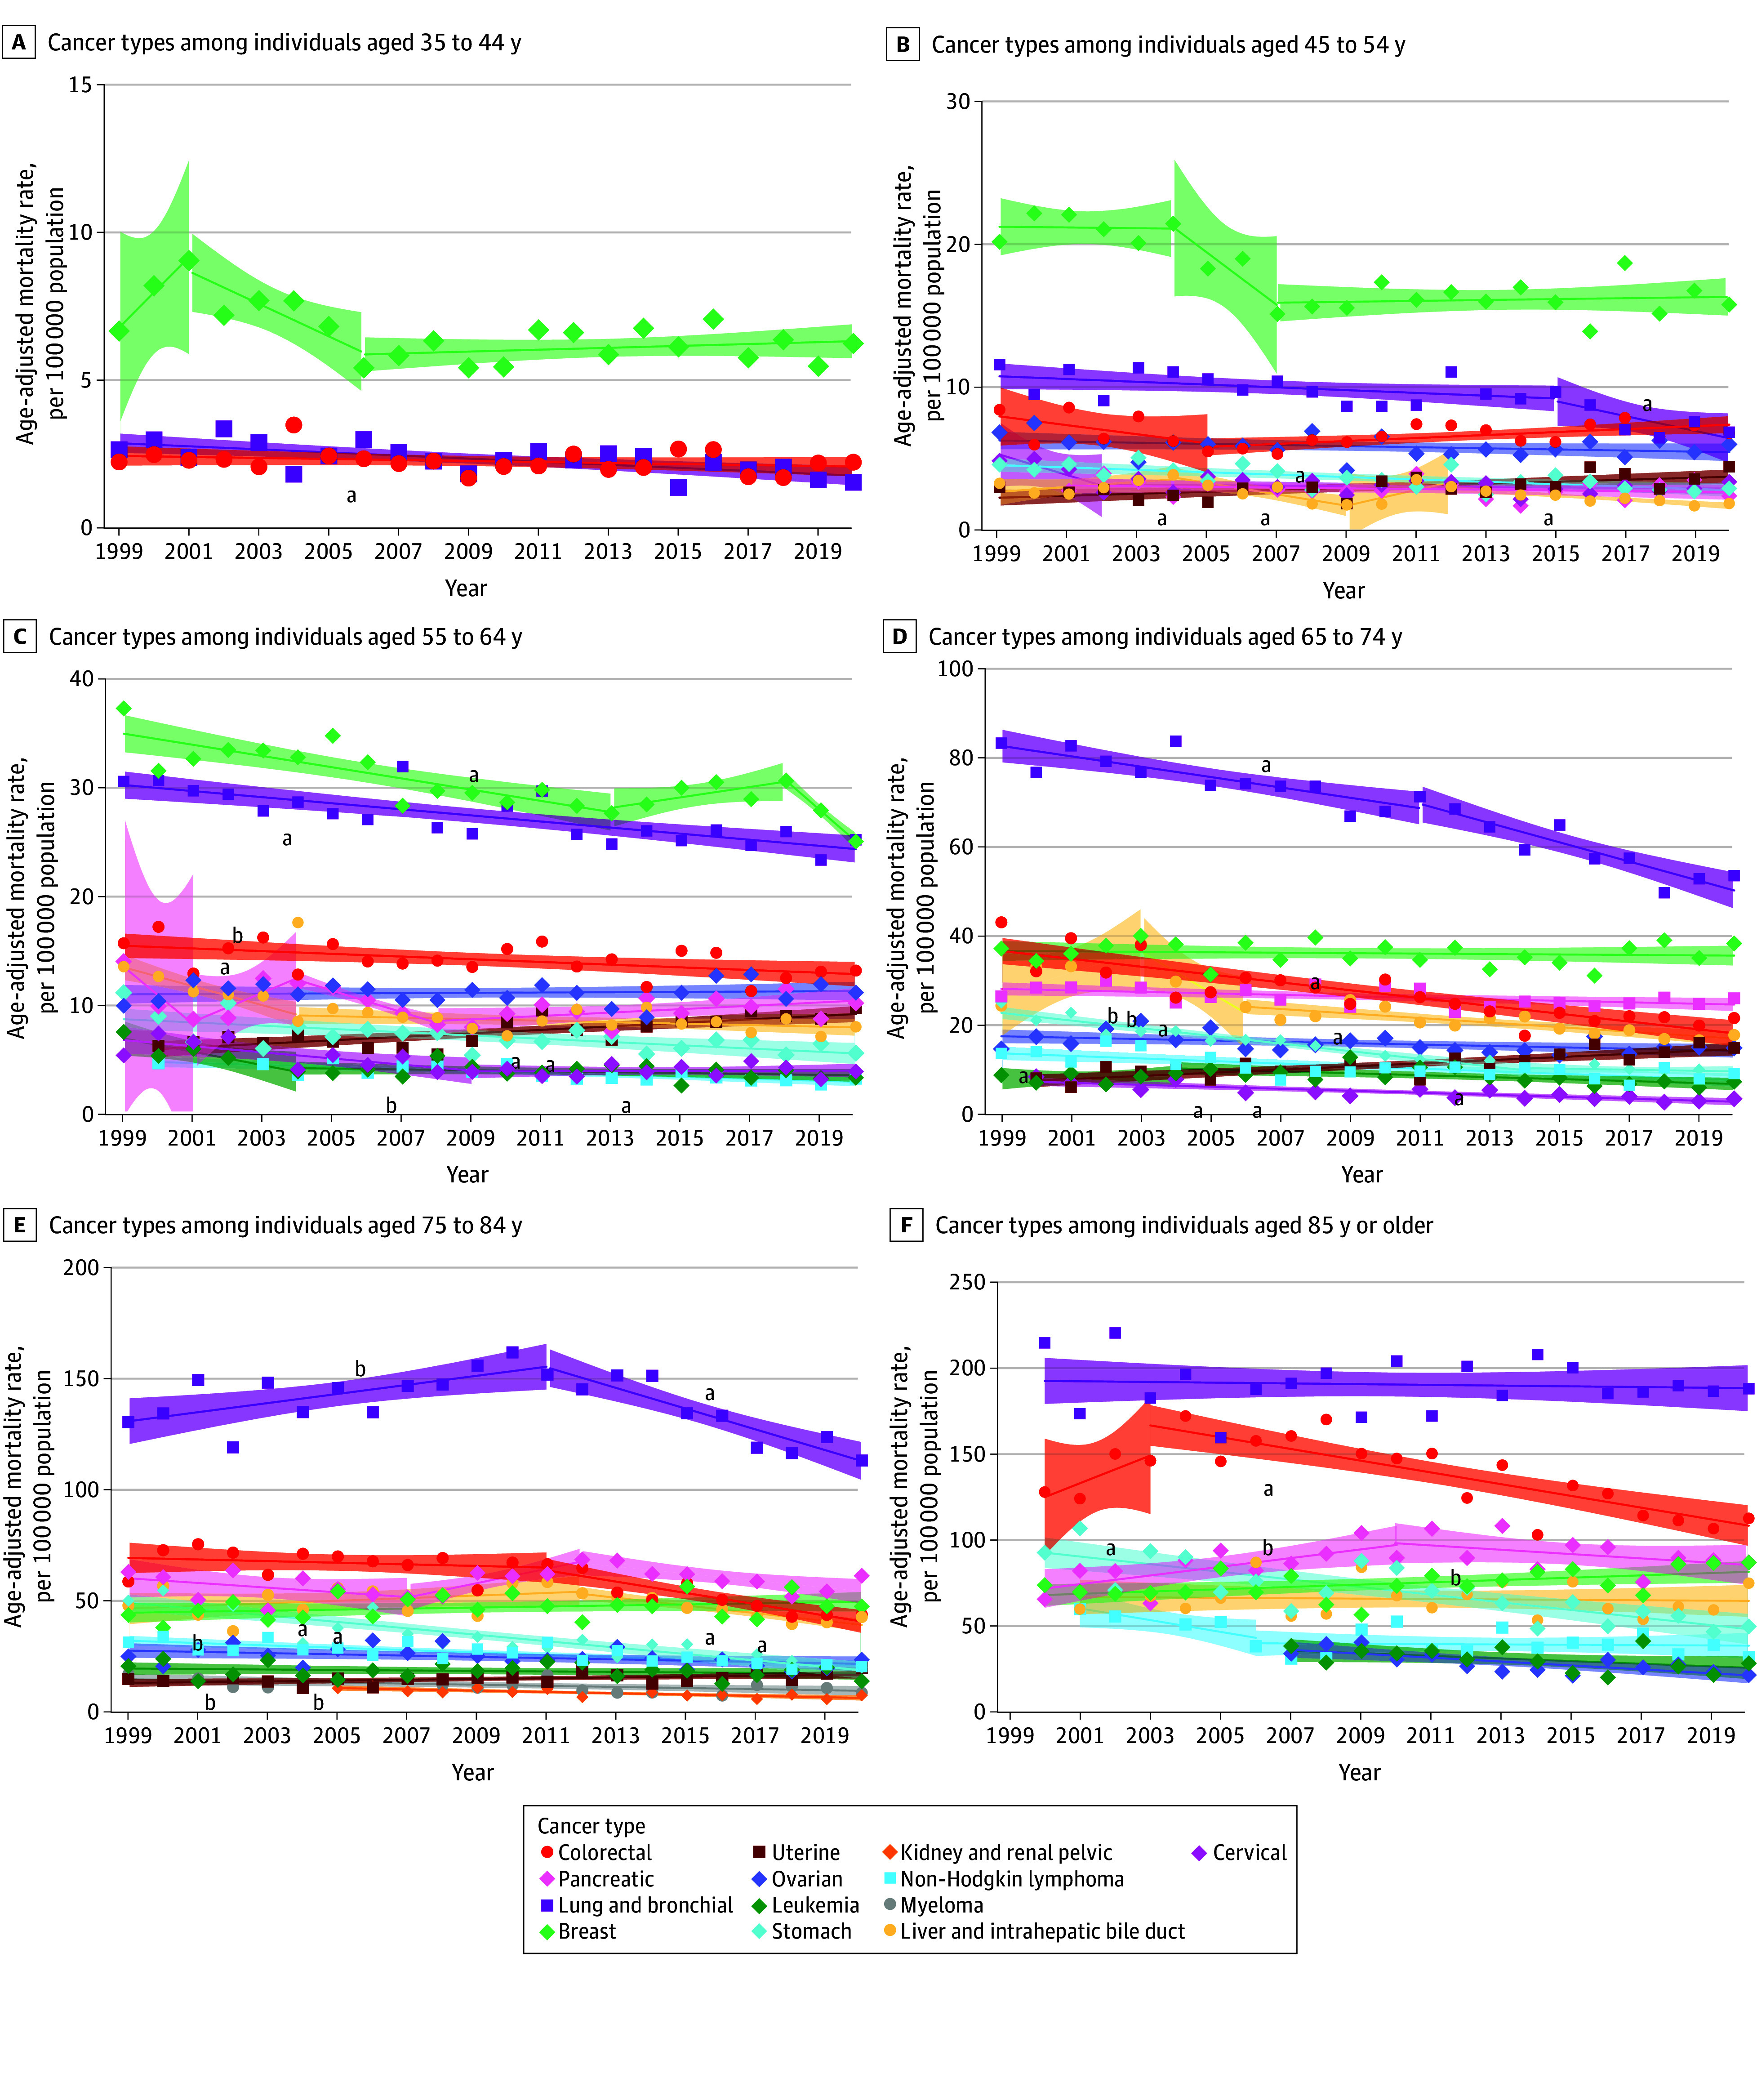
Results: Between 1999 and 2020, 305 386 Asian American and Pacific Islander individuals (median [IQR] age, 69.5 [58.5-79.2] years; 51.1% male) died of cancer in the US. Overall, the CSM rate decreased by 1.5% annually. Men experienced a greater CSM rate decrease (AAPC, -1.8%; 95% CI, -2.2% to -1.3%) compared with women (AAPC, -1.1%; 95% CI: -1.2% to -1.0%). For women, death rates decreased for most cancer types but increased for uterine (AAPC, 2.5%; 95% CI, 2.0%-3.0%) and brain and central nervous system (AAPC, 1.4%; 95% CI: 0.7%-2.1%) cancers. Colorectal cancer mortality rates increased among men aged 45 to 54 years (AAPC, 1.3%; 95% CI, 0.5%-2.1%). Liver and intrahepatic bile duct cancer mortality increased for both men and women in all US census regions, uterine cancer mortality increased in all regions for women, and pancreatic cancer mortality increased in the Midwest for both men and women.
Conclusions and relevance: Although these findings show an overall decrease in CSM among Asian American and Pacific Islander populations, specific cancer types exhibited increased mortality rates, with further disparities by sex and age. Targeted, culturally adapted clinical and public health interventions are needed to narrow disparities in cancer mortality.
Conflict of interest statement
Figures
Comment in
- doi: 10.1001/jamanetworkopen.2024.42419
Similar articles
-
Unmasking Suicidal Ideation for Asian American, Native Hawaiian, and Pacific Islander Youths Via Data Disaggregation.JAMA Netw Open. 2024 Nov 4;7(11):e2446832. doi: 10.1001/jamanetworkopen.2024.46832. JAMA Netw Open. 2024. PMID: 39576641 Free PMC article.
-
Breast Cancer Incidence Trends in Older US Women by Race, Ethnicity, Geography, and Stage.JAMA Netw Open. 2025 Jun 2;8(6):e2516947. doi: 10.1001/jamanetworkopen.2025.16947. JAMA Netw Open. 2025. PMID: 40553473 Free PMC article.
-
Trends in State-Level Maternal Mortality by Racial and Ethnic Group in the United States.JAMA. 2023 Jul 3;330(1):52-61. doi: 10.1001/jama.2023.9043. JAMA. 2023. PMID: 37395772 Free PMC article.
-
Behavioral interventions to reduce risk for sexual transmission of HIV among men who have sex with men.Cochrane Database Syst Rev. 2008 Jul 16;(3):CD001230. doi: 10.1002/14651858.CD001230.pub2. Cochrane Database Syst Rev. 2008. PMID: 18646068
-
Impact of residual disease as a prognostic factor for survival in women with advanced epithelial ovarian cancer after primary surgery.Cochrane Database Syst Rev. 2022 Sep 26;9(9):CD015048. doi: 10.1002/14651858.CD015048.pub2. Cochrane Database Syst Rev. 2022. PMID: 36161421 Free PMC article.
References
-
- Cancer facts & figures 2023. American Cancer Society. 2024. Accessed April 23, 2024. https://www.cancer.org/research/cancer-facts-statistics/all-cancer-facts...
-
- National Center for Health Statistics mortality data on CDC WONDER. Centers for Disease Control and Prevention . Accessed February 5, 2024. https://wonder.cdc.gov/Deaths-by-Underlying-Cause.html
Publication types
MeSH terms
LinkOut - more resources
Full Text Sources
Medical
