. 2024 Nov 27;38(21-24):998-1019.
doi: 10.1101/gad.351978.124.

DNA-directed termination of mammalian RNA polymerase II

Affiliations

DNA-directed termination of mammalian RNA polymerase II

Lee Davidson et al. Genes Dev. .

Abstract

The best-studied mechanism of eukaryotic RNA polymerase II (RNAPII) transcriptional termination involves polyadenylation site-directed cleavage of the nascent RNA. The RNAPII-associated cleavage product is then degraded by XRN2, dislodging RNAPII from the DNA template. In contrast, prokaryotic RNAP and eukaryotic RNAPIII often terminate directly at T-tracts in the coding DNA strand. Here, we demonstrate a similar and omnipresent capability for mammalian RNAPII. Importantly, this termination mechanism does not require upstream RNA cleavage. Accordingly, T-tract-dependent termination can take place when XRN2 cannot be engaged. We show that T-tracts can terminate snRNA transcription independently of RNA cleavage by the Integrator complex. Importantly, we found genome-wide termination at T-tracts in promoter-proximal regions but not within protein-coding gene bodies. XRN2-dependent termination dominates downstream from protein-coding genes, but the T-tract process is sometimes used. Overall, we demonstrate global DNA-directed attrition of RNAPII transcription, suggesting that RNAPs retain the potential to terminate over T-rich sequences throughout evolution.

Keywords: Integrator; RNA polymerase II; Xrn2; exosome; histone; snRNA; transcription termination.


Figures

Figure 1.
Figure 1.
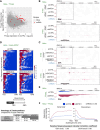
INTS11 is required for snRNA processing but not transcription termination. (A) Scatter plot showing the TSS-proximal log2 TT-seq signal ratio (siINTS11/siCTRL; y-axis) as a function of transcript expression levels (x-axis). snRNAs are highlighted in red. The data are from GSE151919 (Lykke-Andersen et al. 2021). (B) Genome browser view across and downstream from the RNVU1-6 TU, displaying RNA 3′ end sequencing (3′-seq) data from siCTRL- and siINTS11-treated HeLa cells (GSE151919) (Lykke-Andersen et al. 2021). Both −EPAP and +EPAP samples are shown. The top panel encompasses 2 kb downstream from the RNVU1-6 body, and the bottom panel shows a zoomed-in (dashed box) view of the snRNA-proximal region, with the INTS11 cleavage site indicated by an asterisk. Y-axes display reads per kilobase per million mapped reads (RPKM). (C) Genome browser view as in B but displaying samples from siCTRL-, siINTS11-, siEXOSC3-, or siINTS11 × EXOSC3-treated HeLa cells (GSE151919) (Lykke-Andersen et al. 2021). (D) Heat maps of 3′-seq signal coverage downstream from the transcription end sites (TESs) of 18 snRNAs expressed in HeLa cells. Samples were derived from siCTRL, siINTS11, siEXOSC3, or siINTS11 × siEXOSC3 cells (GSE151919) (Lykke-Andersen et al. 2021), and RNA was EPAP-treated. The heat scale represents log2 sequencing signal intensity from each depletion condition versus the siCTRL. It highlights similar 3′ end positions between conditions, not the signal intensity differences. The transcription “end” of this region represents the last position of TT-seq read detection following siEXOSC3 depletion (see the Materials and Methods). The accompanying table at the bottom displays the percentage homology of the 3′ end positions between each condition. (E) Genome browser view as in B but displaying TT-seq data from siCTRL- and siINTS11-treated HeLa cells (GSE151919) (Lykke-Andersen et al. 2021). (F) Metaplot of TT-seq data from siCTRL- or siINTS11-treated HeLa cells (GSE151919) (Lykke-Andersen et al. 2021) over 18 snRNA loci. The left plot shows snRNA gene body signals from the TSS to the TES, and the right plot shows signals downstream from the TES. The sequencing signal intensity correlation coefficient demonstrates equivalent increases in read coverage over gene body and downstream regions (see the Materials and Methods).
Figure 2.
Figure 2.
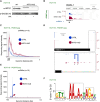
3′ end processing of snRNA precursors occurs cotranscriptionally. (A) Western blotting analysis of protein extracts from unmodified (WT) HCT116 cells and INTS1-AID HCT116 cells treated (+) or untreated (−) with auxin for 3 h. Note that degron tagging increases the INTS1 molecular weight as expected. EXOSC10 was probed as a loading control. (B) Genome browser view across and downstream from the RNU5A-1 TU, displaying POINT-seq data from INTS1-AID HCT116 cells untreated (CTRL) or treated (INTS-AID) with auxin. The y-axis sequence signal intensity units are bins per million mapped reads (BPM). (C) Metaplot of POINT-seq data of RNA from INTS1-AID HCT116 cells untreated (CTRL) or treated (INTS-AID) with auxin. The plot represents 15 snRNAs separated from their neighboring TUs by at least 5 kb. The x-axis shows from 0.2 kb upstream of to 5 kb downstream from the annotated snRNA (TSS to TES). The y-axis sequence signal intensity units are BPM. (D) Genome browser view as in B but displaying POINT5-seq data across and downstream from the RNU4-1 TU. The top panel shows the major TSS peak and the minor downstream INT processing site (dashed box). The bottom panel displays increased signal resolution around the TES downstream region. The sites of significantly downregulated POINT5 coverage upon INTS1 depletion are marked by asterisks. (E) Metaplot as in C but displaying POINT5-seq data from snRNA TESs to a region 100 bp downstream. The y-axis sequence signal intensity units are BPM. Arrows indicate the major INTS1-sensitive site downstream from the annotated snRNA 3′ end. (F) 3′ box consensus element derived from POINT5-seq. INT cleavage occurs immediately upstream of this sequence. The E-value represents the probability of encountering the same sequence by chance. See also Supplemental Figure S2B.
Figure 3.
Figure 3.
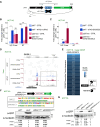
Termination of snRNA transcription is 3′ box-independent. (A) Schematic representation of the pWT and pΔ3′ box reporter plasmids. The U7 snRNA sequence is followed by its 3′ box (or its deletion) and a GFP gene with a mutated PAS. Arrow pairs denote the two amplicons (“UC 3′ box” and “RT”) used for qRT-PCR analysis. (B) qRT-PCR analysis of pWT or pΔ3′ box reporter expression from INTS11-dTAG HCT116 cells untreated (CTRL) or treated (INTS11-dTAG) for 4 h with dTAGv-1. RNA spanning the 3′ box or from the downstream region was measured by “UC 3′ box” and “RT” amplicons, respectively. Measured RNA quantities were normalized to levels of GAPDH RNA. Mean fold change values were calculated by comparative quantitation versus pWT CTRL. n = 4. Error bars indicate standard error of the mean (SEM). (*) P ≤ 0.05, (**) P ≤ 0.01, (***) P ≤ 0.001. (C) As in B but performed in dTAG-EXOSC3 HCT116 cells. n = 4. Error bars indicate SEM. (*) P ≤ 0.05, (***) P ≤ 0.001. (D) Genome browser view of RNA 3′-seq signal over the RNU5B-1 locus and deriving from ±EPAP-treated RNA from HCT116 (CTRL), dTAG-EXOSC3, or XRN2-dTAG cells treated with dTAGv-1 for 4 h. The dashed box highlights a region with EXOSC3-sensitive 3′ ends. (E) Sequence composition of the most common hexameric motifs at the 3′ terminus of 3′-seq reads (+EPAP) found ≤4 kb downstream from snRNA TESs and stabilized by log2 change ≥1 following EXOSC3 depletion from dTAG-EXOSC3 cells versus HCT116 CTRL cells (see schematic). Motifs are shown as the coding DNA strand equivalent. The heat scale shows the motif count. (F, top panel) Schematic representation of used reporter constructs and the sequences of the inserted RNU11 and SNORD13 downstream elements. (Bottom panel) Western blotting analysis of GFP expression following transfection of HCT116 cells with the pWT-, pΔ3′ box-, pRNU11term-, or pSNORD13term-containing reporter constructs. Quantifications below the Western membrane show relative GFP expression levels relative to those of the pΔ3′ box reporter. n = 3 (±values = SEM) following normalization to nucleolin protein levels. GFP mRNA levels are displayed as determined by qRT-PCR. n = 3. (*) P < 0.05, (**) P < 0.01. (G) Western blotting and qRT-PCR analysis as in F but of the pRNU11term and pSNORD13term constructs and their mutated derivatives, in which all Ts were substituted for As.
Figure 4.
Figure 4.
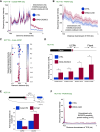
Global transcriptional termination at T-rich elements. (A) Heat maps showing TT-seq data from siCTRL- and siEXOSC3-treated HeLa cell RNA samples (GSE151919) (Lykke-Andersen et al. 2021). The left heat map shows the log2 change in sequencing signal intensity (siEXOSC3 vs. siCTRL) over the gene body region (TSS to TES) of all TUs (n = 10,559), and the right heat map shows the same analysis but for the area downstream from the TES. (B) Heat maps as in A but showing the gene body and TES downstream regions of monoexonic (left two maps) and multiexonic (right two maps) TUs. (C) Sequence composition of the most common hexameric motifs at the 3′ end of 3′-seq (+EPAP) reads over regions within 3 kb sense or antisense of TSSs and stabilized by log2 change ≥1 following siEXOSC3 versus siCTRL treatment of HeLa cells. Note that motifs are shown as the coding DNA strand sequence. The heat scale shows motif counts. Analyses were derived from GSE151919 (Lykke-Andersen et al. 2021). (D) Analysis as in C but in dTAG-treated dTAG-EXOSC3 HCT116 cells versus CTRL HCT116 cells. (E) Meta-analysis of +EPAP 3′-seq coverage over motifs of T6 or greater within 0–1, 1–2, 2–3, or 3–4 kb from multiexonic TU TSSs. The x-axis shows this region (start–end), including 10 nt upstream and downstream. The y-axis displays the log2 change in signal sequence intensity in dTAG-treated dTAG-EXOSC3 or XRN2-dTAG HCT116 cells versus HCT116 CTRL cells.
Figure 5.
Figure 5.
Exosome and XRN2 activities denote separate use of DNA-directed and torpedo termination. (A) Heat map analysis as in Figure 4A but showing the log2 fold change in nuclear RNA-seq signal intensity between samples obtained after the rapid loss of XRN2 from XRN2-mAID HCT116 cells (XRN2 data from GSE109003) (Eaton et al. 2018) or EXOSC3 from dTAG-EXOSC3 HCT116 cells (EXOSC3) versus their respective controls. The left four heat maps show gene body and downstream regions of monoexonic TUs, and the equivalents at the right display the same regions from multiexonic TUs. (B) Heat map analysis as in A but showing log2 change in nuclear RNA-seq signal intensity between −dTAG-EXOSC3 and CTRL samples over the gene body and downstream regions of TUs with predicted strong (left two heat maps) or weak (right two heat maps) PASs. (C) As in B but for XRN2-mAID HCT116 cells depleted of XRN2 (Eaton et al. 2018). (D) Sequence composition analysis as in Figure 3E but of 3′ ends derived from downstream from multiexonic TU TESs and stabilized by log2 change ≥1 following dTAG depletion of EXOSC3 or XRN2 versus their HCT116 cell CTRL. (E) Sequence composition analysis as in D but of 3′ ends of mNET-seq reads stabilized by log2 change ≥1 following XRN2-mAID depletion versus untreated CTRL HCT116 cells. The data are from GSE109003 (Eaton et al. 2018).
Figure 6.
Figure 6.
Mutually exclusive use of DNA-directed and torpedo termination downstream from some short protein-coding genes. (A) Metaplot of nuclear RNA-seq signal from dTAG-EXOSC3 HCT116 cells treated or not for 4 h with dTAGv-1. The plot displays signals over 43 protein-coding TUs with a log2 change ≥1.5 increase in signal intensity downstream from the TES following EXOSC3 depletion. The x-axis shows the gene body region (TSS–TES) and 3 kb of the downstream region. The y-axis sequence signal intensity units are RPKM. (B) Metaplot as in A but for POINT-seq signal derived from XRN2-mAID cells treated or not for 4 h with auxin (GSE159326) (Sousa-Luis et al. 2021). The y-axis sequence signal intensity units are BPM. (C) Heat map showing the log2 change in sequencing signal intensity in −EPAP 3′-seq signal samples (dTAG-treated dTAG-EXOSC3 HCT116 cells vs. CTRL HCT116 cells). The x-axis is centered around the TESs of the 43 TUs analyzed in A and displays 0.1 kb of respective upstream and downstream regions. (D) qRT-PCR analysis of non-PAS cleaved (“UCPA” amplicon) and 3′ flanking (“flank” amplicon) RNAs from the PFDN6 and PPDPF genes. Samples were from dTAG-EXOSC3 cells treated or not with dTAGv-1 for 4 h (dTAG-EXOSC3 and CTRL, respectively). Measured RNA quantities were normalized to GAPDH RNA levels. Mean fold change values were calculated by comparative quantitation and plotted relative to those obtained in CTRL conditions. n = 3. Error bars indicate SEM. (*) P ≤ 0.05. (E) qRT-PCR analysis of RNA derived from human β-globin plasmids containing a hepatitis δ-ribozyme (“WT RZ”) or its inactive mutant (“mutant RZ”) inserted between the PAS and CoTC elements as indicated. Used amplicons were positioned between the PAS and the CoTC (“dsPAS”) and downstream from the CoTC (“dsCoTC”), respectively. Measured RNA quantities were normalized to GAPDH RNA levels. Mean fold change values were calculated by comparative quantitation and plotted relative to those obtained in CTRL conditions. Error bars indicate SEM. n = 4. (*) P ≤ 0.05, (***) P ≤ 0.001. (F) Metaplot of published POINT5-seq data from XRN2-AID versus CTRL cells (GSE159326) (Sousa-Luis et al. 2021). The 43 TUs from A are shown. The x-axis shows the TES and 3 kb of downstream sequence. The y-axis sequence signal intensity units are BPM. The only visible XRN2-sensitive 5′ end coincides with the TES (corresponding to PAS cleavage).
Figure 7.
Figure 7.
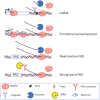
DNA-directed versus torpedo-mediated transcription termination mechanisms. (Top two schematics) At snRNA genes, cotranscriptional RNA 3′ box processing by the INT complex precedes but is not required for DNA-directed termination and subsequent exosome degradation. INT also attenuates snRNA transcription, explaining the apparent transcriptional readthrough seen upon its depletion. In promoter-proximal regions, termination can occur via multiple complexes, with INT and Restrictor being prominent examples. However, like for snRNAs, promoter-proximal termination can also occur by a DNA-directed process when RNAPII encounters T-rich elements in the coding strand of DNA. (Bottom two schematics) At the ends of multiexonic TUs (like protein-coding genes), efficient PAS cleavage leads to torpedo-directed transcription termination by XRN2 in most cases. Where PAS cleavage is inefficient or fails, DNA-directed termination provides a means of evicting RNAPII from the chromatin template. This might include cases where full elongation competence is not yet established (e.g., on some short protein-coding genes).

References

    1. Adelman K, Lis JT. 2012. Promoter-proximal pausing of RNA polymerase II: emerging roles in metazoans. Nat Rev Genet 13: 720–731. 10.1038/nrg3293 - DOI - PMC - PubMed
    1. Albrecht TR, Wagner EJ. 2012. snRNA 3′ end formation requires heterodimeric association of integrator subunits. Mol Cell Biol 32: 1112–1123. 10.1128/MCB.06511-11 - DOI - PMC - PubMed
    1. Albrecht TR, Shevtsov SP, Wu Y, Mascibroda LG, Peart NJ, Huang KL, Sawyer IA, Tong L, Dundr M, Wagner EJ. 2018. Integrator subunit 4 is a “Symplekin-like” scaffold that associates with INTS9/11 to form the Integrator cleavage module. Nucleic Acids Res 46: 4241–4255. 10.1093/nar/gky100 - DOI - PMC - PubMed
    1. Arimbasseri AG, Rijal K, Maraia RJ. 2013. Transcription termination by the eukaryotic RNA polymerase III. Biochim Biophys Acta 1829: 318–330. 10.1016/j.bbagrm.2012.10.006 - DOI - PMC - PubMed
    1. Arimbasseri AG, Rijal K, Maraia RJ. 2014. Comparative overview of RNA polymerase II and III transcription cycles, with focus on RNA polymerase III termination and reinitiation. Transcription 5: e27369. 10.4161/trns.27369 - DOI - PMC - PubMed