. 2024 Nov;30(11):e70081.
doi: 10.1111/cns.70081.

The Neuroprotective Mechanisms of PPAR-γ: Inhibition of Microglia-Mediated Neuroinflammation and Oxidative Stress in a Neonatal Mouse Model of Hypoxic-Ischemic White Matter Injury

Affiliations

The Neuroprotective Mechanisms of PPAR-γ: Inhibition of Microglia-Mediated Neuroinflammation and Oxidative Stress in a Neonatal Mouse Model of Hypoxic-Ischemic White Matter Injury

Mingchu Fang et al. CNS Neurosci Ther. 2024 Nov.

Abstract

Background: Neuroinflammation and oxidative stress, mediated by microglial activation, hinder the development of oligodendrocytes (OLs) and delay myelination in preterm infants, leading to white matter injury (WMI) and long-term neurodevelopmental sequelae. Peroxisome proliferator-activated receptor gamma (PPAR-γ) has been reported to inhibit inflammation and oxidative stress via modulating microglial polarization in various central nervous system diseases. However, the relationship between PPAR-γ and microglial polarization in neonatal WMI is not well understood. Therefore, this study aimed to elucidate the role and mechanisms of PPAR-γ in preterm infants affected by WMI.

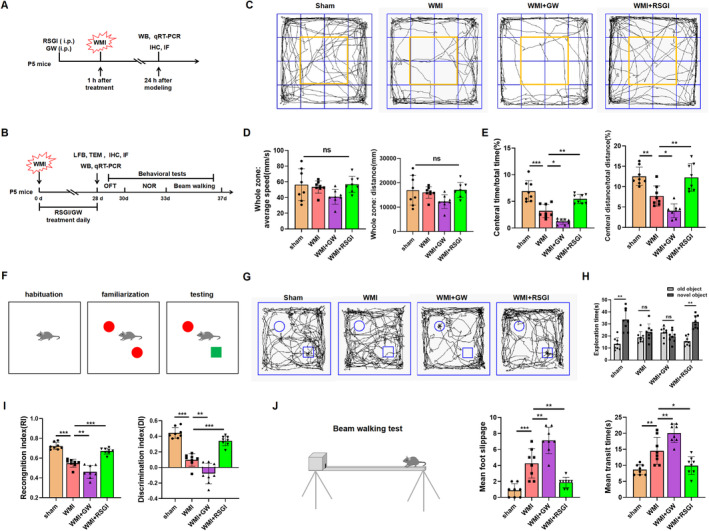
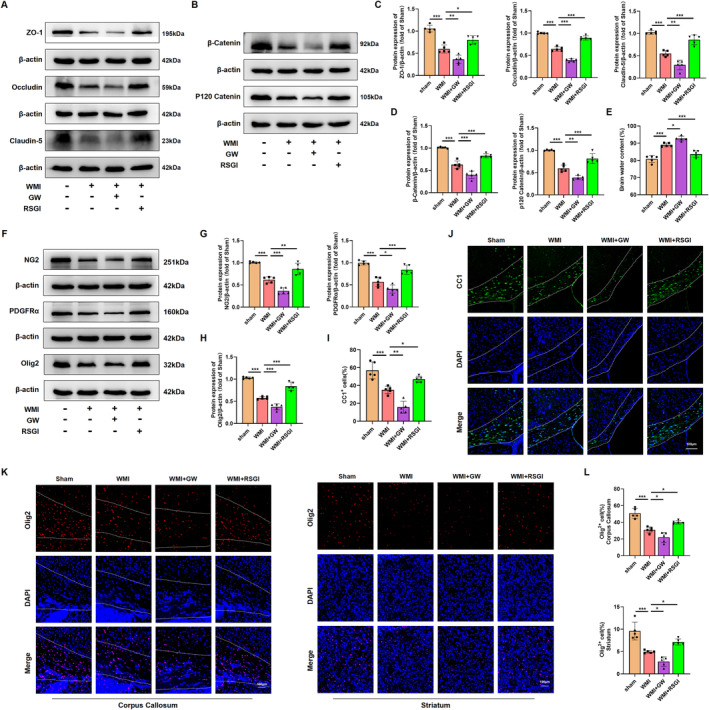
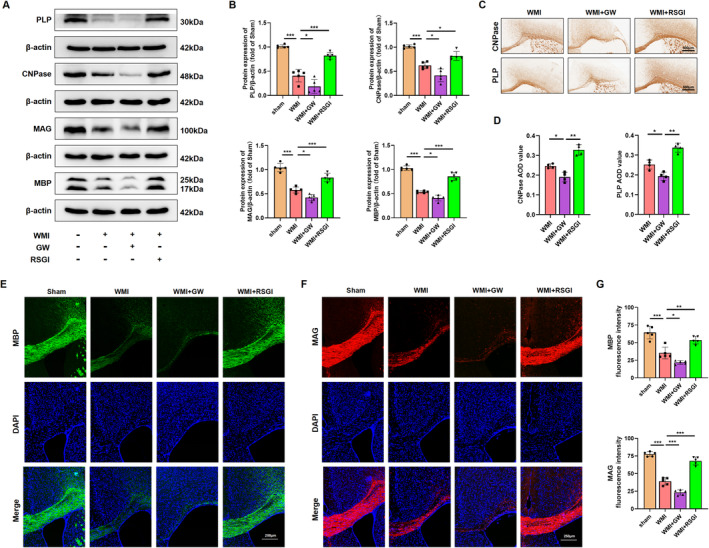
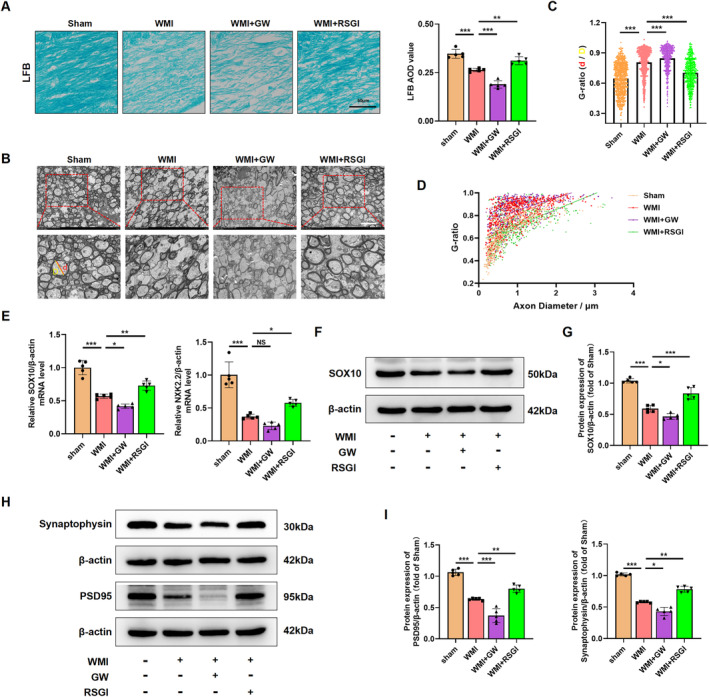
Methods: In this study, an in vivo hypoxia-ischemia (HI) induced brain WMI neonatal mouse model was established. The mice were administered intraperitoneally with either RSGI or GW9662 to activate or inhibit PPAR-γ, respectively. Additionally, an in vitro oxygen-glucose deprivation (OGD) cell model was established and pretreated with pcDNA 3.1-PPAR-γ or si-PPAR-γ to overexpress or silence PPAR-γ, respectively. The neuroprotective effects of PPAR-γ were investigated in vivo. Firstly, open field test, novel object recognization test, and beam-walking test were employed to assess the effects of PPAR-γ on neurobehavioral recovery. Furthermore, assessment of OLs loss and OL-maturation disorder, the number of myelinated axons, myelin thickness, synaptic deficit, activation of microglia and astrocyte, and blood-brain barrier (BBB) were used to evaluate the effects of PPAR-γ on pathological repair. The mechanisms of PPAR-γ were explored both in vivo and in vitro. Assessment of microglia polarization, inflammatory mediators, reactive oxygen species (ROS), MDA, and antioxidant enzymes was used to evaluate the anti-inflammatory and antioxidative effects of PPAR-γ activation. An assessment of HMGB1/NF-κB and NRF2/KEAP1 signaling pathway was conducted to clarify the mechanisms by which PPAR-γ influences HI-induced WMI in neonatal mice.

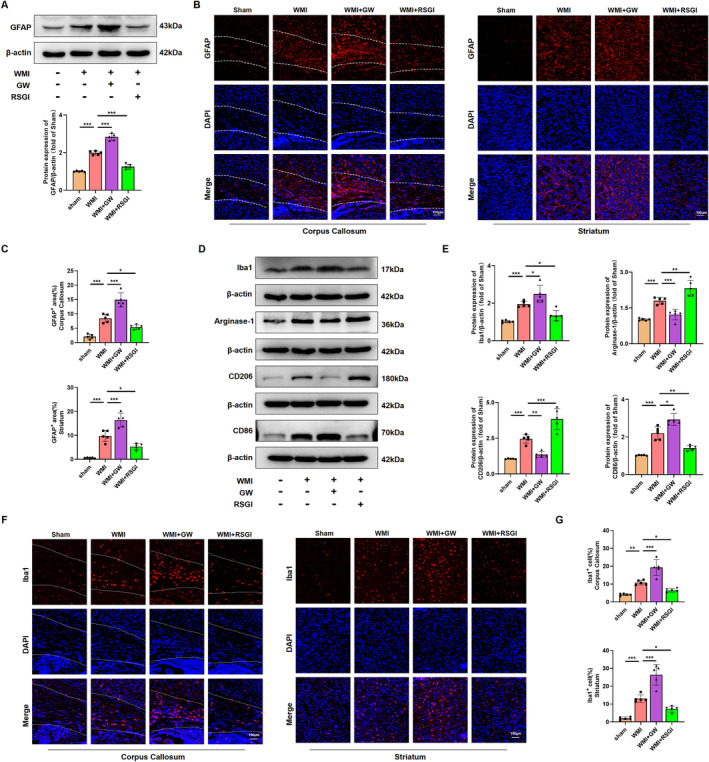
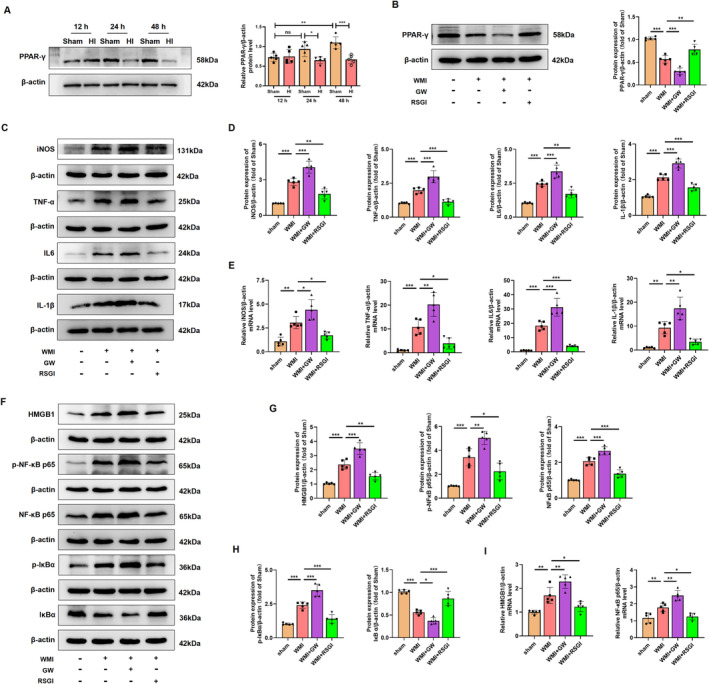
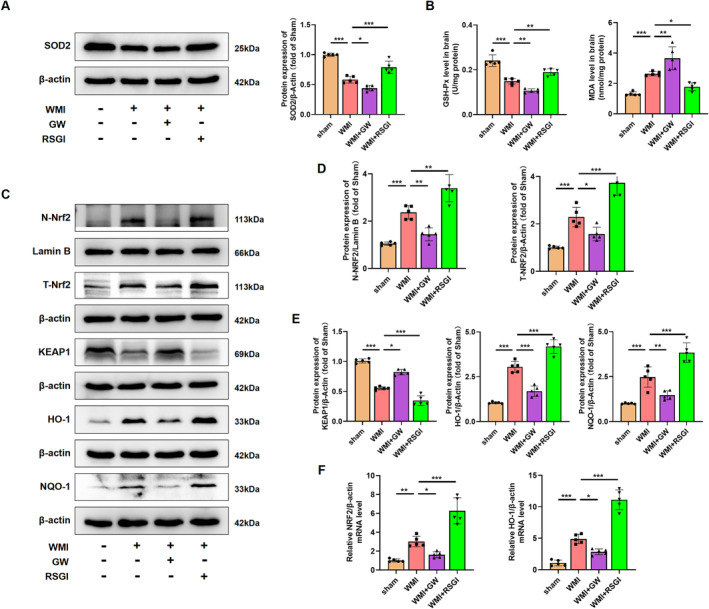
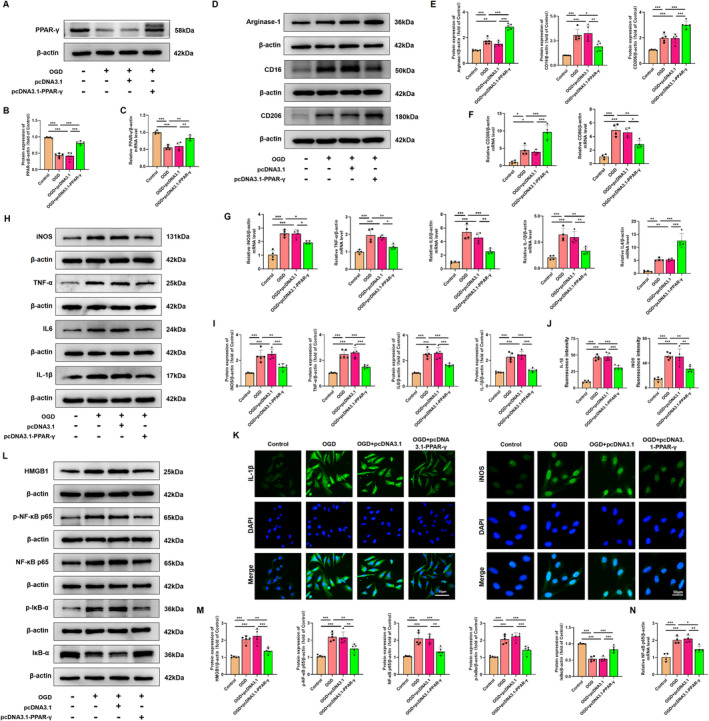
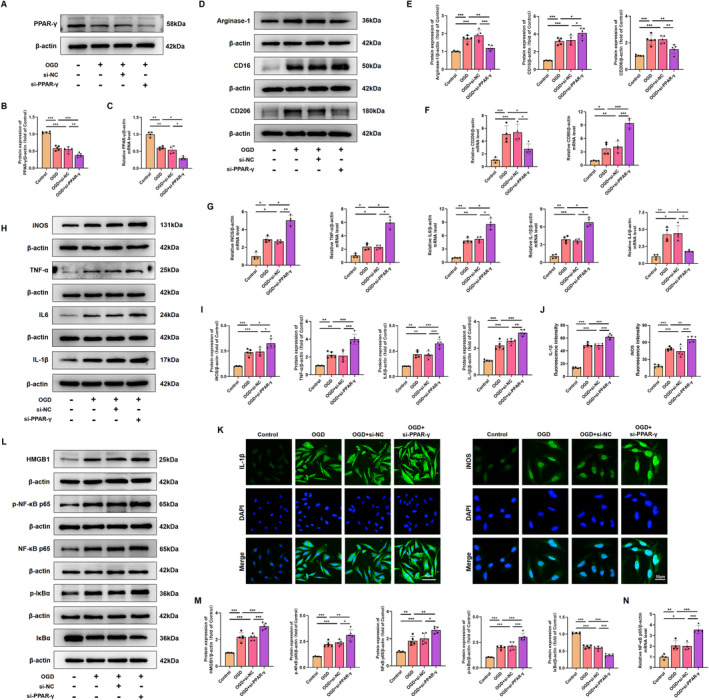
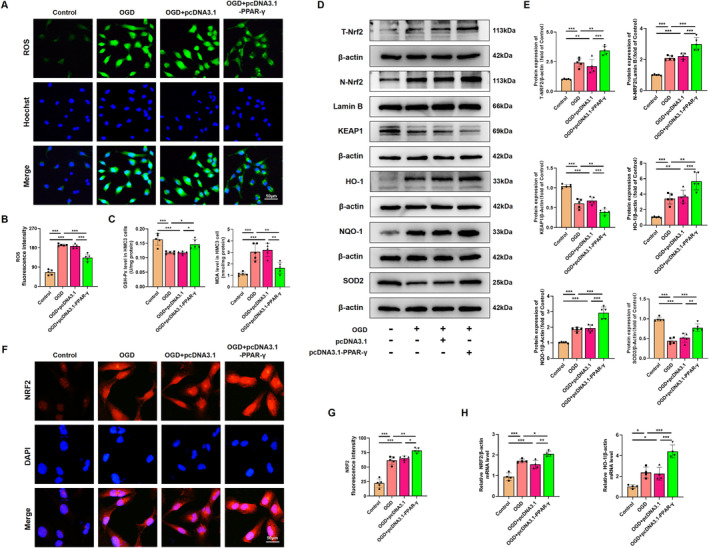
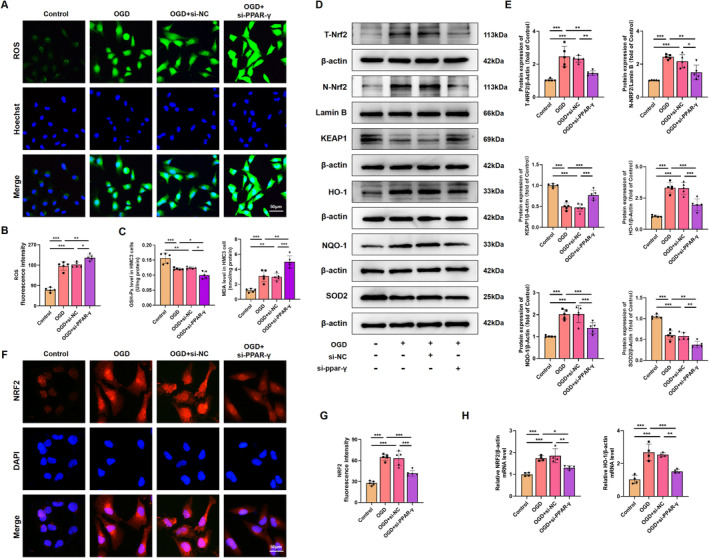
Results: Activation of PPAR-γ using RSGI significantly mitigated BBB disruption, promoted M2 polarization of microglia, inhibited activation of microglia and astrocytes, promoted OLs development, and enhanced myelination in HI-induced WMI. Conversely, inhibition of PPAR-γ using GW9662 further exacerbated the pathologic hallmark of WMI. Neurobehavioral tests revealed that neurological deficits were ameliorated by RSGI, while further aggravated by GW91662. In addition, activation of PPAR-γ significantly alleviated neuroinflammation and oxidative stress by suppressing HMGB1/NF-κB signaling pathway and activating NRF2 signaling pathway both in vivo and in vitro. Conversely, inhibition of PPAR-γ further exacerbated HI or OGD-induced neuroinflammation, oxidative stress via modulation of the same signaling pathway.

Conclusions: Our findings suggest that PPAR-γ regulates microglial activation/polarization as well as subsequent neuroinflammation/oxidative stress via the HMGB1/NF-κB and NRF2/KEAP1 signaling pathway, thereby contributing to neuroprotection and amelioration of HI-induced WMI in neonatal mice.

Keywords: PPAR‐γ; microglia; neuroinflammation; oxidative stress; white matter injury.


Conflict of interest statement

The authors declare no conflicts of interest.

Figures

FIGURE 1
FIGURE 1
Effects of PPAR‐γ on neurodeficits in the neonatal WMI model. (A, B) Diagram of the in vivo experimental design. (C) OFT was conducted to evaluate anxiety‐like behavior, with representative images of route traces displayed. (D, E) The behaviors of the mice, such as total distance traveled, time spent in the central area, and distance traveled in the central area, were recorded and analyzed. (F, G) NOR test was performed to assess cognitive performance, featuring a test diagram and representative trajectory images. (H, I) Exploration time of the novel object, DI, and RI during testing phase were recorded and analyzed. (J) Beam‐walking test was employed to evaluate motor coordination and balance, with hind limb slippage frequency and time to traverse beam recorded and analyzed. Graph displays mean ± SD values (n = 8 mice per group). *p < 0.05, **p < 0.01, and ***p < 0.001, significance based on one‐way ANOVA with Tukey's post hoc test.
FIGURE 2
FIGURE 2
Effects of PPAR‐γ on BBB disruption and OLs differentiation in the neonatal WMI model. (A, B) Western blots depicting the expression of tight junction proteins and adherens junction proteins in WM 24 h post‐HI injury. The molecular weight marker (in kDa) is shown on the right. (C, D) Quantification of the western blots illustrated in (A, B). (E) The ratio of wet and dry in each group. (F) Western blots showing the levels of Olig2, PDGFRα, and NG2 in WM 72 h post‐HI injury. The molecular weight marker (in kDa) is indicated on the right. (G, H) Quantification of the western blots presented in (F). (I) Quantification of the percentage of CC1 positive cells as shown in (J). (J) Representative immunofluorescence images showing CC1 (green) and DAPI (blue) in the corpus callosum (outlined in white) at 28 days after HI injury. Scale bar, 100 μm. (K) Representative immunofluorescence images showing Olig2 (red) and DAPI (blue) in the corpus callosum (outlined in white) and striatum at 72 h after HI injury. Scale bar, 100 μm. (L) Quantification of the percentage of Olig2 positive cells as shown in (K). Data are expressed as fold induction over the sham. Graph displays mean ± SD values (n = 5 brains per condition). *p < 0.05, **p < 0.01, and ***p < 0.001, significance based on one‐way ANOVA with Tukey's post hoc test.
FIGURE 3
FIGURE 3
Effects of PPAR‐γ on OLs maturation in the neonatal WMI model. (A) Representative western blots for myelin proteins PLP, CNPase, MAG, and MBP in WM at 28 days after HI injury. Molecular weight marker (in kDa) is indicated on the right. (B) Quantification of western blots depicted in (A), presented as fold induction relative to the sham group. (C) Representative immunohistochemistry images displaying CNPase and PLP at 28 days after HI injury. Scale bar, 500 μm. (D) Statistical evaluation of immunohistochemistry staining for CNPase and PLP. (E, F) Representative immunofluorescence images of MBP (green), MAG (red), and DAPI (blue) in the corpus callosum at 28 days after HI injury. Scale bar, 250 μm. (G) Quantitative analysis of fluorescence intensity for MBP and MAG. Graph displays mean ± SD values (n = 4–5 brains per condition). *p < 0.05, **p < 0.01, and ***p < 0.001, significance based on one‐way ANOVA with Tukey's post hoc test.
FIGURE 4
FIGURE 4
Effects of PPAR‐γ on myelin loss and synaptic deficits in the neonatal WMI model. (A) Representative images and quantitative analysis of LFB staining in WM at 28 days after HI injury. Scale bar, 500 μm. (B) Transmission electron micrographs revealing the ultrastructural characteristics of the corpus callosum at 28 days post‐HI insult. Scale bar, 5 μm. (C, D) Quantitative analysis of G‐ratios, with scatterplot depicting individual axonal g‐ratios relative to axonal diameters. n 100 axons counted per group, 4 mice per group. Statistical significance denoted by ***p < 0.001, determined by one‐way ANOVA followed by Tukey's post hoc test. Simple linear regression analysis of slopes in the scatterplot. (E) Representative qRT‐PCR analysis of SOX10 and NKX2.2 expression levels in WM at 28 days after HI injury, normalized to β‐actin levels. (F, G) Representative images and quantification of western blot analysis for SOX10 in WM at 28 day after HI injury. Molecular weight marker (in kDa) is indicated on the right. Results expressed as fold induction compared to the sham group. (H, I) Representative images and quantification of western blots for Synaptophysin and PSD95 in WM at 28 days after HI injury. Molecular weight marker (in kDa) is indicated on the right. Data are expressed as fold induction over the sham group. Graph represents mean ± SD values (n = 5 brains per condition). *p < 0.05, **p < 0.01, and ***p < 0.001, significance based on one‐way ANOVA with Tukey's post hoc test.
FIGURE 5
FIGURE 5
Effects of PPAR‐γ on the activation of microglia and astrocyte in the neonatal WMI model. (A) Representative images and quantitative analysis of western blot for GFAP in WM at 24 h after HI injury. Molecular weight marker (in kDa) is indicated on the right. Data are expressed as fold induction over the sham group. (B) Representative immunofluorescence images depicting GFAP (red), and DAPI (blue) in the corpus callosum (outlined in white) and striatum at 24 h after HI injury. Scale bar, 100 μm. (C) Quantification of GFAP‐positive area shown in (B). (D) Representative images of western blots for Iba1, CD86, CD206, and Arginase‐1 in WM at 24 h after HI injury. Molecular weight marker (in kDa) is indicated on the right. (E) Quantification of western blot results displayed in (D). Data are expressed as fold induction over the sham. (F) Representative immunofluorescence images illustrating Iba1 (red), and DAPI (blue) in the corpus callosum (outlined in white) and striatum at 24 h after HI injury. Scale bar, 100 μm. (G) Quantitative analysis of the percentage of Iba‐1‐positive cells shown in (F). Graph displays mean ± SD values (n = 5 brains per condition). *p < 0.05, **p < 0.01, and ***p < 0.001, significance based on one‐way ANOVA with Tukey's post hoc test.
FIGURE 6
FIGURE 6
Effects of PPAR‐γ on neuroinflammation in the neonatal WMI model. (A) Representative images and quantitation of western blots for PPAR‐γ at indicated time after HI injury. (B) Representative images and quantitative analysis of western blots for PPAR‐γ in different groups at 24 h after HI injury. Molecular weight marker (in kDa) is indicated on the right. Data are expressed as fold induction over the sham. (C) Representative images of western blots for iNOS, TNF‐α, IL6, and IL‐1β in WM at 24 h after HI injury. Molecular weight marker (in kDa) is indicated on the right. (D) Quantification of western blots shown in (C), expressed as fold induction over sham. (E) Representative qRT‐PCR analysis of iNOS, TNF‐α, IL6, and IL‐1β expression levels in WM at 24 h after HI injury, normalized to β‐actin. (F) Representative images of western blots for HMGB1, p‐NF‐κB p65, NF‐κB p65, p‐IκBα, and IκBα in WM at 24 h after HI injury, with molecular weight markers (kDa) on the right. (G, H) Quantification of western blots shown in (F), expressed as fold induction over sham. (I) Representative qRT‐PCR analysis of HMGB1 and NF‐κB p65 expression levels in WM at 24 h after HI injury, normalized to β‐actin. Graph displays mean ± SD values (n = 5 brains per condition). *p < 0.05, **p < 0.01, and ***p < 0.001, significance based on one‐way ANOVA with Tukey's post hoc test.
FIGURE 7
FIGURE 7
Effects of PPAR‐γ on excessive oxidative stress in the neonatal WMI model. (A) Representative images and quantification of western blots for SOD2 in WM at 24 h after HI injury. Molecular weight marker (in kDa) is indicated on the right. Data are expressed as fold induction over the sham group. (B)Measurement of MDA and GSH‐Px levels in WM at 24 h after HI injury. (C) Representative images of western blots for T‐NRF2, N‐NRF2, KEAP1, HO‐1, and NQO‐1 in WM at 24 h after HI injury. Molecular weight marker (in kDa) is indicated on the right. (D, E) Quantification of western blots for T‐NRF2, N‐NRF2 (D), KEAP1, HO‐1, and NQO‐1 (E). Data are expressed as fold induction over the sham. (F) Representative qRT‐PCR analysis of NRF2 and HO‐1 expression levels in WM at 24 h after HI injury. Expression levels normalized to β‐actin. Graph displays mean ± SD values (n = 5 brains per condition). *p < 0.05, **p < 0.01, and ***p < 0.001, significance based on one‐way ANOVA with Tukey's post hoc test.
FIGURE 8
FIGURE 8
Overexpressing PPAR‐γ shifts microglial polarization from M1 to M2 phenotype and alleviates inflammatory response in HMC3 cells after OGD. (A, B) Representative images and quantification of western blots for PPAR‐γ in HMC3 cells. Molecular weight marker (in kDa) is indicated on the right. Data are expressed as fold induction over the control. (C) Representative qRT‐PCR analysis of PPAR‐γin HMC3 cells. (D, E) Representative images and quantification of western blots for Arginase‐1, CD16, and CD206 in HMC3 cells. Data are expressed as fold induction over the control. (F, G) Representative qRT‐PCR analysis of CD206, CD86, TNF‐α, IL‐1β, iNOS, IL6, and IL4 expression levels in HMC3 cells. (H, I) Representative images and quantification of western blots for iNOS, TNF‐α, IL6, and IL‐1β in HMC3 cells. Data are expressed as fold induction over the control. (J) Statistical analysis of fluorescence intensity of IL‐1β and iNOS. (K) Representative immunofluorescence images displaying iNOS (green), IL‐1β (green) and DAPI (blue) in HMC3 cells. Scale bar, 50 μm. (L, M) Representative images and quantification of western blots for HMGB1, p‐NF‐κB p65, NF‐κB p65, p‐IκBα, and IκBα in HMC3 cells. Data are expressed as fold induction over the control. (N) Representative qRT‐PCR analysis of NF‐κB p65 expression levels in HMC3 cells. mRNA levels were normalized against those of β‐actin. Histograms show mean ± SD values (n = 4–5 cultures per condition). *p < 0.05, **p < 0.01, and ***p < 0.001, significance based on one‐way ANOVA with Tukey's post hoc test.
FIGURE 9
FIGURE 9
Silencing PPAR‐γ aggravates M1/M2‐polarization state of microglia and inflammatory response in HMC3 cells after OGD. (A, B) Representative images and quantification of western blots for PPAR‐γ in HMC3 cells. Molecular weight marker (in kDa) is indicated on the right. Data are expressed as fold induction over the control. (C) Representative qRT‐PCR analysis of PPAR‐γ in HMC3 cells. Levels were normalized against those of β‐actin. (D, E) Representative images and quantification of western blots for Arginase‐1, CD16, and CD206 in HMC3 cells. Data are expressed as fold induction over the control. (F, G) Representative qRT‐PCR analysis of CD206, CD86, TNF‐α, IL‐1β, iNOS, IL6, and IL4 expression levels in HMC3 cells. (H, I) Representative images and quantification of western blots for iNOS, TNF‐α, IL6, and IL‐1β in HMC3 cells. Data are expressed as fold induction over the control. (J) Statistical analysis of fluorescence intensity of IL‐1β and iNOS. (K) Representative immunofluorescence images displaying iNOS (green), IL‐1β (green) and DAPI (blue) in HMC3 cells. Scale bar, 50 μm. (L, M) Representative images and quantification of western blots for HMGB1, p‐NF‐κB p65, NF‐κB p65, p‐IκBα, and IκBα in HMC3 cells. Data are expressed as fold induction over the control. (N) Representative qRT‐PCR analysis of NF‐κB p65 expression levels in HMC3 cells. mRNA levels were normalized against those of β‐actin. Histograms show mean ± SD values (n = 4–5 cultures per condition). *p < 0.05, **p < 0.01, and ***p < 0.001, significance based on one‐way ANOVA with Tukey's post hoc test.
FIGURE 10
FIGURE 10
Overexpressing PPAR‐γ mitigates excessive oxidative stress in HMC3 cells after OGD. (A) Representative immunofluorescence images displaying ROS (green) and Hoechst (blue) in HMC3 cells. Scale bar, 50 μm. (B) Statistical analysis of fluorescence intensity of ROS. (C) Measurement of MDA and GSH‐Px levels in HMC3 cells after OGD injury. (D) Representative images of western blots for T‐NRF2, N‐NRF2, KEAP1, HO‐1, NQO‐1, and SOD2 in HMC3. Molecular weight marker (in kDa) is indicated on the right. (E) Quantification of the western blot results in (D) was performed, and data are presented as fold induction relative to the control. (F) Representative immunofluorescence displaying NRF2 (red) and DAPI (blue) in HMC3 cells. Scale bar, 50 μm. (G) Statistical analysis of fluorescence intensity of NRF2. (H) qRT‐PCR analysis revealed the expression levels of NRF2 and HO‐1 in HMC3 cells, normalized to β‐actin. Histograms show mean ± SD values (n = 4–5 cultures per condition). *p < 0.05, **p < 0.01, and ***p < 0.001, significance based on one‐way ANOVA with Tukey's post hoc test.
FIGURE 11
FIGURE 11
Silencing PPAR‐γ exacerbates oxidative stress in HMC3 cells after OGD. (A) Representative immunofluorescence images displaying ROS (green) and Hoechst (blue) in HMC3 cells. Scale bar, 50 μm. (B) Statistical analysis of fluorescence intensity of ROS. (C) Measurement of MDA and GSH‐Px levels in HMC3 cells after OGD injury. (D) Representative images of western blots for T‐NRF2, N‐NRF2, KEAP1, HO‐1, NQO‐1, and SOD2 in HMC3. Molecular weight marker (in kDa) is indicated on the right. (E) Quantification of the western blot results in (D) was performed, and data are presented as fold induction relative to the control. (F) Representative immunofluorescence displaying NRF2 (red) and DAPI (blue) in HMC3 cells. Scale bar, 50 μm. (G) Statistical analysis of fluorescence intensity of NRF2. (H) qRT‐PCR analysis revealed the expression levels of NRF2 and HO‐1 in HMC3 cells, normalized to β‐actin. Histograms show mean ± SD values (n = 4–5 cultures per condition). *p < 0.05, **p < 0.01, and ***p < 0.001, significance based on one‐way ANOVA with Tukey's post hoc test.

Similar articles

Cited by

References

    1. Benavente‐Fernandez I., Siddiqi A., and Miller S. P., “Socioeconomic Status and Brain Injury in Children Born Preterm: Modifying Neurodevelopmental Outcome,” Pediatric Research 87, no. 2 (2020): 391–398. - PubMed
    1. Pierrat V., Marchand‐Martin L., Marret S., et al., “Neurodevelopmental Outcomes at Age 5 Among Children Born Preterm: EPIPAGE‐2 Cohort Study,” BMJ 373 (2021): n741. - PMC - PubMed
    1. Back S. A. and Miller S. P., “Brain Injury in Premature Neonates: A Primary Cerebral Dysmaturation Disorder?,” Annals of Neurology 75, no. 4 (2014): 469–486. - PMC - PubMed
    1. Raju T. N. K., Buist A. S., Blaisdell C. J., Moxey‐Mims M., and Saigal S., “Adults Born Preterm: A Review of General Health and System‐Specific Outcomes,” Acta Paediatrica 106, no. 9 (2017): 1409–1437. - PubMed
    1. Back S. A. and Rosenberg P. A., “Pathophysiology of Glia in Perinatal White Matter Injury,” Glia 62, no. 11 (2014): 1790–1815. - PMC - PubMed

Publication types

MeSH terms

LinkOut - more resources