. 2024 Dec;46(2):2415519.
doi: 10.1080/0886022X.2024.2415519. Epub 2024 Nov 4.

Piezo1 facilitates the initiation and progression of renal fibrosis by mediating cell apoptosis and mitochondrial dysfunction

Affiliations

Piezo1 facilitates the initiation and progression of renal fibrosis by mediating cell apoptosis and mitochondrial dysfunction

Yanping Zhang et al. Ren Fail. 2024 Dec.

Abstract

Renal fibrosis is the major pathological changes of Chronic kidney disease (CKD). Piezo1, a mechanical sensitive ion channel, is implicated in organ fibrosis. However, the precise role of Piezo1 in CKD fibrosis is unknown. The aims of this study were to identify that the role of Piezo1 in CKD fibrosis and its potential involvement of mitochondrial dysfunction. We performed the study with the Piezo1 agonist Yoda1, Bax inhibitor BAI1, Piezo1 inhibitor GsMTx4 and detected the injury, fibrosis, apoptosis markers and mitochondrial dysfunction. The results showed that the levels of apoptosis, mitochondrial dysfunction, injury and fibrosis increased in TCMK-1 cells after treatment with Yoda1. However, these changes that induced by Yoda1 were relieved by BAI1. Similarly, inhibition Piezo1 with GsMTx4 also partly relieved the renal injury, renal fibrosis, apoptosis and mitochondrial dysfunction in vivo and vitro. In conclusion, we found Piezo1 promoted the initiation and development of renal fibrosis and inhibiting Piezo1 improved the fibrosis.

Keywords: Chronic kidney disease; Piezo1; apoptosis; mitochondrial dysfunction; renal fibrosis.


Conflict of interest statement

No potential conflict of interest was reported by the author(s).

Figures

None
Graphical abstract
Figure 1.
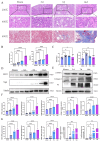
Figure 1.
Renal injury and renal fibrosis in UUO mice model. (A) The staining of H&E and Masson in UUO model. Scale bar =100µm. (B) The quantitative analysis of tubule injury and collagen deposition in UUO model (n = 5 mice per group). (C) The change of BUN and Creatinine in UUO model. (D) Western blot analysis of NGAL and KIM1 in UUO mice model (n = 5 mice per group). (E) Western blot analysis of α-SMA, Collagen I and Fn in UUO mice model (n = 5 mice per group). (F) The quantitative analysis result of NGAL, KIM1, α-SMA, Collagen I and Fn proteins (n = 5 mice per group). (G) The mRNA quantitative analysis results of NGAL, KIM1, α-SMA, Collagen I and Fn. Statistical analyses were analyzed by one-way ANOVA. *p ≤ 0.05, **p ≤ 0.01, ***p ≤ 0.001, ****p ≤ 0.0001.
Figure 2.
Figure 2.
Renal injury and renal fibrosis in human obstructed kidney specimens. (A) H&E and Masson of obstructed kidney specimen sections. Scale bar =100µm. (B) Quantification of the mean intensity of tubule injury and Masson staining. (n = 6 specimens per group, 6 random sights per specimens). (C) The level of creatinine and BUN in obstructed kidney patients (n = 10 per group). (D) Immunofluorescence staining of collagen I in human obstructed kidney specimen sections (6 random sights per specimens). (E) Western blot analysis of Kim1and NGAL in human obstructed kidney specimens (n = 6 specimens per group). (F) Western blot analysis of α-SMA, collagen I and Fn in human obstructed kidney specimens (n = 6 specimens per group). (G) Bar plot represents the quantification of relative protein expression levels. (H) Relative mRNA levels of KIM1, NGAL, α-SMA, collagen I and Fn in human obstructed kidney specimens. Statistical analyses were calculated using 2-tailed student’s t test for 2 groups. *p ≤ 0.05, **p ≤ 0.01, ***p ≤ 0.001, ****p ≤ 0.0001.
Figure 3.
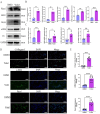
Figure 3.
The expression of Piezo1 in mice UUO model and human obstructed kidney specimens. (A) Immunofluorescence staining of Piezo1 in mice UUO model, red represent the expression of Piezo1, blue is the nucleus (n = 5 mice per group, 4 random sights per mice). (B) the immunofluorescence staining of Piezo1 (red) and AQP1 (green) colocalization in the proximal tubules of UUO mice and human obstruction kidney (n = 5 per group, 6 random sights per group). (C) the WB result and protein quantification of Piezo1 in mice UUO model and human obstructed kidney specimens (n = 5 per group, 6 random sights per group). (D) mRNA quantification of Piezo1 in mice UUO model and human obstructed kidney specimens. The data are represented as mean ± SD, statistical analyses were analyzed by one-way ANOVA or 2-tailed student’s t test. *p ≤ 0.05, **p ≤ 0.01, ***p ≤ 0.001, ****p ≤ 0.0001. Scale bar 100 μm.
Figure 4.
Figure 4.
Mitochondrial dysfunction and apoptosis in mice UUO and human obstructed renal specimens. (A) The mitochondrial electron microscope results of renal proximal tubule (2500X, 8.0kv) and distal tubule (8000X, 8.0kv) in mice UUO model (n = 3 mice per group, 3 random sights per mice). (B) Tunel staining in mice UUO model and human obstructed renal specimens, the green points represented the apoptosis cell, the blue points represented the nucleus, Scale bar 200 μm, 100 μm (n = 5 mice per group, 4 random sights per mice). (C) Western blot of Bax, Bcl2, Caspase3, Cleaved-caspase3 in mice UUO and human obstructed renal specimens (n = 5 mice per group). (D) The relative proteins expression levels of Bax, Bcl2, Caspase3 and Cleaved-caspase3 in mice UUO and human obstructed renal specimens. (E) The quantitative results of the mRNA expression levels of Bax, Caspase3 in mice UUO and human obstructed renal specimens. Statistical analyses were analyzed by one-way ANOVA or 2-tailed student’s t test. *p ≤ 0.05, **p ≤ 0.01, ***p ≤ 0.001, ****p ≤ 0.0001.
Figure 5.
Figure 5.
Yoda1 activatedPiezo1 channel to facilitate TCMK-1 cell injury and fibrosis. (A) The WB of Piezo1, Kim1, NGAL,α-SMA and Fn (n = 3 per group). (B) Bar plot represents the proteins quantification results of Piezo1, Kim1, NGAL, α-SMA and Fn. (C) Bar plot represents the mRNA quantification results of Piezo1, KIM1, α-SMA and Fn. (D) Immunostaining staining of Piezo1, α-SMA and Collagen I in TCMK-1 cell after Yoda1 treatment (n = 3 per group, 4 random sights per sample), Scale bar 100 μm. (E) The mean fluoresence intensity of Piezo1, α-SMA and collagen I. Statistical analyses were calculated using 2-tailed student’s t test for 2 groups. *p ≤ 0.05, **p ≤ 0.01, ***p ≤ 0.001, ****p ≤ 0.0001.
Figure 6.
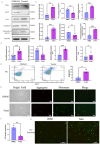
Figure 6.
Yoda1 facilitated renal injury and fibrosis by Bax mediated apoptosis and mitochondrial dysfunction. (A) The WB of Bax, Bcl2, Cytc, Caspase3 and Cleaved-caspase3 (n = 3 per group). (B) Bar plot represents the proteins quantification results of Bax, Bcl2, Cytc, Caspase3 and Cleaved-caspase3. (C) The mRNA expression level of Bax, Bcl2, Bax/Bcl2 and Caspase3 after Yoda1 treatment. (D) Flow cytometry scatter plot of AnnexinV-PI/7ADD staining in TCMK-1 cells after Yoda1 intervention (n = 3 per group). (E) the immunostaining of mitochondrial membrane potential after Yoda1 treatment (n = 3 per group, 3 random sights per sample), Scale bar 100 μm. (F) Detection of intracellular ATP content in TCMK-1 cells after Yoda1 intervention. (G) the intracellular calcium concentration was detected with fluorescence microscopy after Yoda1 intervention, Scale bar 100 μm. Statistical analyses were calculated using 2-tailed student’s t test for 2 groups. *p ≤ 0.05, **p ≤ 0.01, ***p ≤ 0.001, ****p ≤ 0.0001
Figure 7.
Figure 7.
The rescue experiments that activated Piezo1 and inhibited Bax. (A) The WB expression levels of Bax, Bcl2, Cytc, Caspase3, Cleaved-caspase3, KIM1, Collagen I and Fn (n = 3 per group). (B) Bar plot represents the proteins quantification results of Bax, Bcl2, Cytc, Caspase3, Cleaved-caspase3, KIM1, Collagen1 and Fn. (C) The mRNA expression levels of Bax, Bcl2, Bax/Bcl2, α-SMA, Collagen I and Fn. (D) Flow cytometry scatter plot of JC1 staining after Yoda1 or/and BAI1 co-treatment, the FITC+ cells present the decreased of mitochondrial membrane potential (n = 3 per group). (E) Detection of intracellular ATP content in TCMK-1 cells after Yoda1 and/or BAI1 intervention. Statistical analysis was calculated using one-way ANOVA, *p ≤ 0.05, **p ≤ 0.01, ***p ≤ 0.001, ****p ≤ 0.0001.
Figure 8.
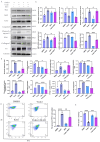
Figure 8.
Inhibition Piezo1 could relief renal injury and fibrosis. (A) The WB expression levels of Bax, Bcl2, Caspase3, Cleaved-caspase3, KIM1 and Fn (n = 3 per group). (B) The WB quantitative results of Bax, Bcl2, Caspase3, Cleaved-caspase3, Kim1 and Fn. (C) The mRNA level of Bax, Caspase3, KIM1 and Fn. (D) Flow cytometry scatter plot of AnnexinV-PI/7ADD staining in TCMK-1 cells after TGFβ1 and/or GsMTx4 intervention (n = 3 per group). (E) The immunostaining of mitochondrial membrane potential after TGFβ1 and/or GsMTx4 in intervention (n = 3 per group, 3 random sights per sample), JC1 aggregates (red), JC1 monomers (green), Scale bar 100 μm. (F) The WB expression levels of Kim1, α-SMA, Bax, Bcl2, Cytc, Caspase3 and Cleaved-caspase3 in UUO mice models intervened by GsMTx4. (G) The WB quantitative results of KIM1,α-SMA, Bax, Bcl2, Cytc, Caspase3 and Cleaved-caspase3 in UUO mice models intervened by GsMTx4. Statistical analyses were calculated using one-way ANOVA. *p ≤ 0.05, **p ≤ 0.01, ***p ≤ 0.001, ****p ≤ 0.0001.

Similar articles

Cited by

References

    1. Nørregaard R, Mutsaers HAM, Frøkiær J, et al. . Obstructive nephropathy and molecular pathophysiology of renal interstitial fibrosis. Physiol Rev. 2023;103(4):2847–2892. doi:10.1152/physrev.00027.2022. - DOI - PMC - PubMed
    1. Carriazo S, Ramos AM, Sanz AB, et al. . Chronodisruption: a poorly recognized feature of CKD. Toxins. 2020;12(3):151. doi:10.3390/toxins12030151. - DOI - PMC - PubMed
    1. Yan H, Xu J, Xu Z, et al. . Defining therapeutic targets for renal fibrosis: exploiting the biology of pathogenesis. Biomed Pharmacother. 2021;143:112115. doi:10.1016/j.biopha.2021.112115. - DOI - PubMed
    1. Webster AC, Nagler EV, Morton RL, et al. . Chronic kidney disease. Lancet. 2017;389(10075):1238–1252. doi:10.1016/S0140-6736(16)32064-5. - DOI - PubMed
    1. Chen A, Feng Y, Lai H, et al. . Soluble RARRES1 induces podocyte apoptosis to promote glomerular disease progression. J Clin Invest. 2020;130(10):5523–5535. doi:10.1172/JCI140155. - DOI - PMC - PubMed