. 2024 Nov 4;15(1):9507.
doi: 10.1038/s41467-024-53620-8.

A Catalogue of Structural Variation across Ancestrally Diverse Asian Genomes

Collaborators, Affiliations

A Catalogue of Structural Variation across Ancestrally Diverse Asian Genomes

Joanna Hui Juan Tan et al. Nat Commun. .

Abstract

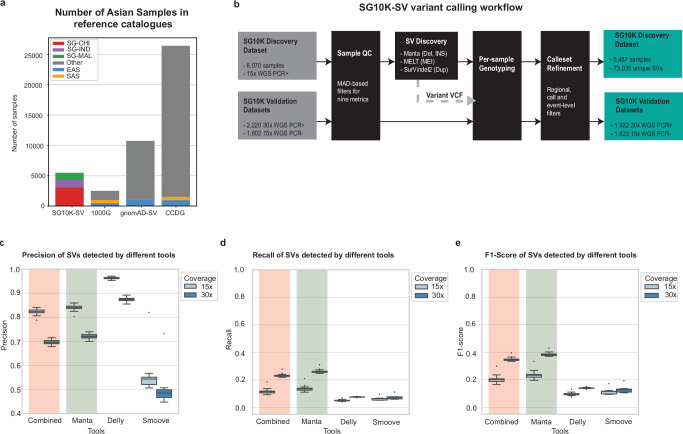
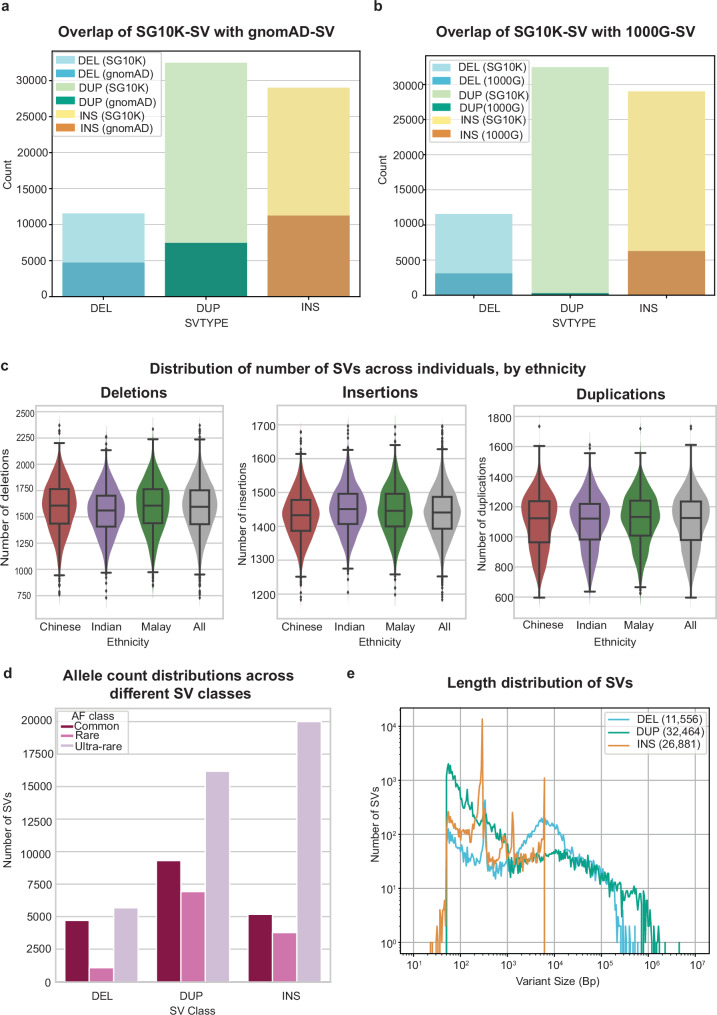
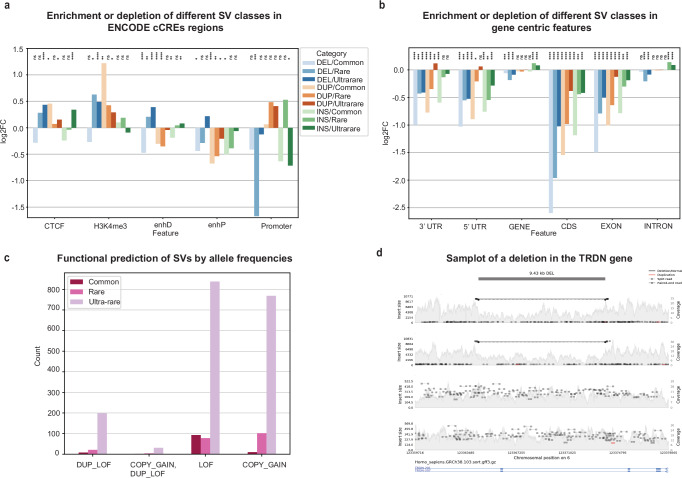
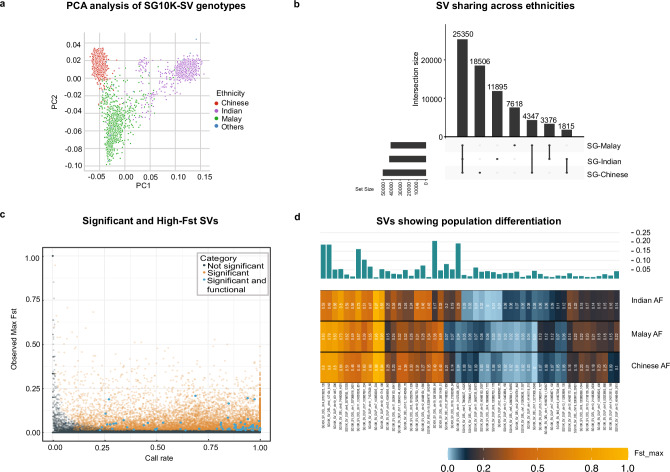
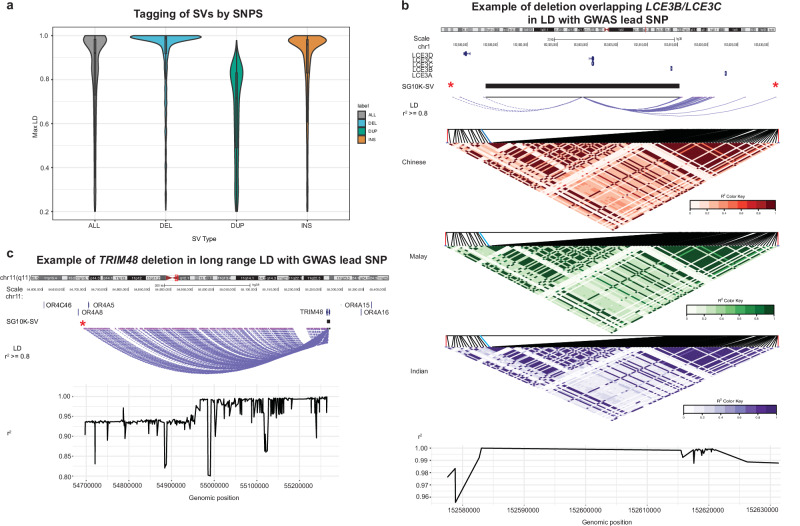
Structural variants (SVs) are significant contributors to inter-individual genetic variation associated with traits and diseases. Current SV studies using whole-genome sequencing (WGS) have a largely Eurocentric composition, with little known about SV diversity in other ancestries, particularly from Asia. Here, we present a WGS catalogue of 73,035 SVs from 8392 Singaporeans of East Asian, Southeast Asian and South Asian ancestries, of which ~65% (47,770 SVs) are novel. We show that Asian populations can be stratified by their global SV patterns and identified 42,239 novel SVs that are specific to Asian populations. 52% of these novel SVs are restricted to one of the three major ancestry groups studied (Indian, Chinese or Malay). We uncovered SVs affecting major clinically actionable loci. Lastly, by identifying SVs in linkage disequilibrium with single-nucleotide variants, we demonstrate the utility of our SV catalogue in the fine-mapping of Asian GWAS variants and identification of potential causative variants. These results augment our knowledge of structural variation across human populations, thereby reducing current ancestry biases in global references of genetic variation afflicting equity, diversity and inclusion in genetic research.


Conflict of interest statement

The authors declare no competing interests.

Figures

Fig. 1
Fig. 1. SG10K-SV-r1.4 Structural Variant landscape.
a Number of Asian samples in SG10K-SV-r1.4 compared to (short-read derived) 1000 genomes SV, gnomAD-SV and CCDG reference studies. b SG10K-SV-r1.4 analysis pipeline diagram. ce Benchmarking of various SV tools for SV detection using 34 1000 G samples with 2 different depths (30x coverage and downsampled 15x coverage). c Boxplot showing the precision between 15x and 30x coverage for each SV caller. Combined refers to variants that are detected in all three pipelines. The boxplots display the median and first/third quartiles. d Boxplot showing the recall between 15x and 30x coverage for each SV caller. The boxplots display the median and first/third quartiles. e Boxplot showing the F1-score between 15x and 30x coverage for each SV caller. The boxplots display the median and first/third quartiles.
Fig. 2
Fig. 2. SG10K-SV-r1.4 Structural Variant catalogue properties.
a Number of SG10K-SV-r1.4 variants detected in the discovery callset that overlap with gnomAD-SV. b Number of SG10K-SV-r1.4 variants detected in the discovery callset that overlap with 1000G-SV. c Violin plot and boxplot showing the number of SV per genome across individuals of different ethnicity group (3088 Chinese, 1237 Indians and 1144 Malays). The boxplot displays the minimum and maximum number of SVs as well as the median and the first/third quartile. DEL deletions, DUP duplications, INS insertions (including MEIs). d Number of SVs in different classes segregated by allele frequencies in the SG10K-SV-r1.4 discovery callset. The majority of the SVs are rare variants (AF < 1%). e Size distribution of SVs in SG10K-SV-r1.4 discovery callset. DEL deletions, DUP duplications, INS insertions (including MEIs). Expected Alu, SVA and LINE1 MEIs peaks at around 300 bp, 2100 bp and 6000 bp, respectively.
Fig. 3
Fig. 3. Functional impact of structural variations in the SG10K-SV-r1.4.
a: Distribution of SVs (Deletions, Insertions, Duplications) disrupting regulatory regions (ENCODE cCREs) across allele frequency bins. Common indicates variants with allele frequency ≥0.01; rare indicates variants with allele frequency ≥0.001 and allele frequency <0.01; ultra-rare variants refers to variants with allele frequency <0.001. P-value was computed using 10,000 random permutations and correction with Benjamini–Hochberg false discovery rate was done. Ns indicates not significant p-value, * indicates p-value < 0.05, **p-value < 0.01, *** indicates p-value < 0.001, **** indicates p-value < 0.0001. The exact p-value for the analysis can be found in Supplementary Data 6. b Distribution of SVs (Deletions, Insertions, Duplications) disrupting (GENCODE) gene centric features across allele frequency bins. p-value was computed using 10,000 random permutations and correction with Benjamini Hochberg false discovery rate was done. Ns indicates not significant p-value, * indicates p-value < 0.05, **p-value < 0.01, *** indicates p-value < 0.001, **** indicates p-value < 0.0001. The exact p-value for the analysis can be found in Supplementary Data 7. c In silico prediction of functional consequences of SVs segregated by allele frequencies. d Samplot of a 9.43 kb deletion event overlapping the TRDN gene region.
Fig. 4
Fig. 4. Population specificity of SVs.
a Population structure revealed by PCA analysis of SG10K-SV-r1.4 genotype values. Each point corresponds to an individual, coloured according to its ethnicity, x and y axis represents the first two principal component respectively. b Proportion of SVs found in all, two or one populations. c Scatter plot of SV’s fixation index (Fst) as a function of their call rate. d Allele frequencies in Chinese, Indian and Malay for selected SVs with elevated fixation index (Fst).
Fig. 5
Fig. 5. Linkage disequilibrium between SVs and SNPs.
a Tagging of SVs by SNPs: Violin plots and boxplots showing the distribution of the maximum R2 value to SNPs for each SV. The boxplots and violin plots were plotted for 1400 deletions, 1394 duplications and 2903 insertions, which are in LD with SNPs/small indels in the SG10K_Health dataset. The boxplots display the median and first/third quartiles. b Candidate causal SV: Example of a deletion affecting LCE3B/LCE3C gene, in high LD with two Psoriasis GWAS SNPs. The SNPs are significantly associated with Psoriasis. LD structure plots are shown for the three ethnicities. The star indicates the GWAS lead SNP and the black bar indicates the SV. The line plot shows the r2 of variants in the region with respect to the SV. c Candidate causal SV: Example of a deletion in TRIM48 gene, in high LD with an intergenic GWAS-lead SNP associated with altered glomerular filtration rate. The lines indicate LD between GWAS-lead SNP and deletion with r2 >= 0.8. The star indicates the GWAS lead SNP and the black bar indicates the SV. The line plot shows the r2 of variants in the region with respect to the SV. Genomic region overviews in panels b and c include screenshots from http://genome.ucsc.edu.

References

    1. Eichler, E. E. Genetic variation, comparative genomics, and the diagnosis of disease. N. Engl. J. Med.381, 64–74 (2019). - PMC - PubMed
    1. Frazer, K. A., Murray, S. S., Schork, N. J. & Topol, E. J. Human genetic variation and its contribution to complex traits. Nat. Rev. Genet.10, 241–251 (2009). - PubMed
    1. Auton, A. et al. A global reference for human genetic variation. Nature526, 68–74 (2015). - PMC - PubMed
    1. Karczewski, K. J. et al. The mutational constraint spectrum quantified from variation in 141,456 humans. Nature581, 434–443 (2020). - PMC - PubMed
    1. Smedley, D. et al. 100,000 genomes pilot on rare-disease diagnosis in health care - preliminary report. N. Engl. J. Med.385, 1868–1880 (2021). - PMC - PubMed

Publication types

LinkOut - more resources