. 2024 Nov 4;15(1):9522.
doi: 10.1038/s41467-024-53733-0.

PTPRK regulates glycolysis and de novo lipogenesis to promote hepatocyte metabolic reprogramming in obesity

Affiliations

PTPRK regulates glycolysis and de novo lipogenesis to promote hepatocyte metabolic reprogramming in obesity

Eduardo H Gilglioni et al. Nat Commun. .

Abstract

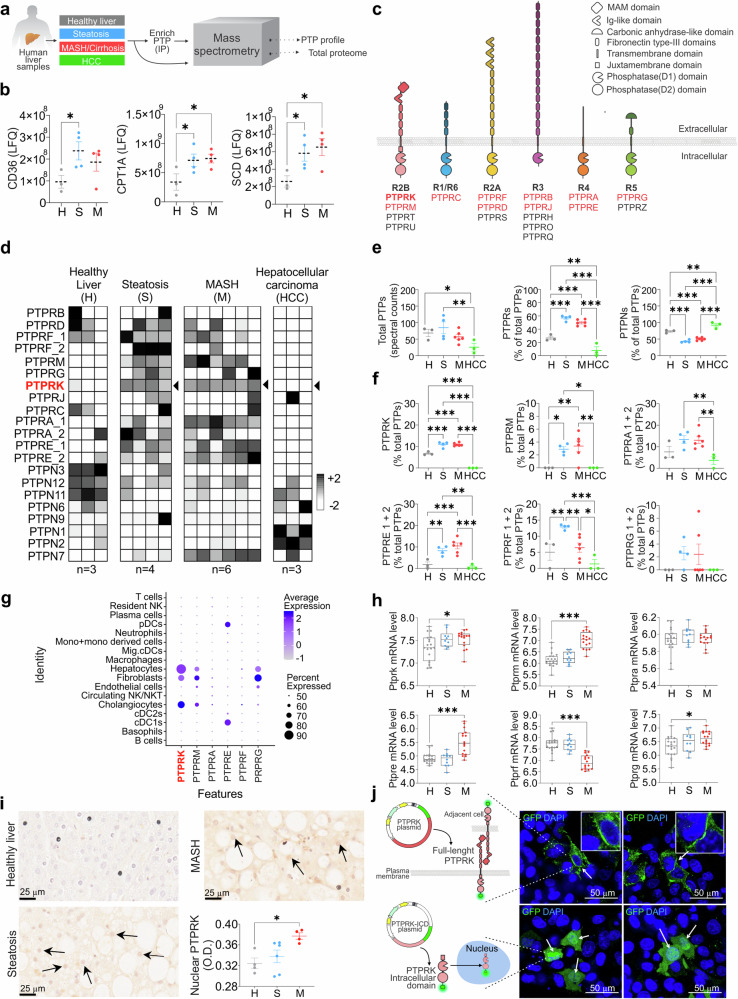
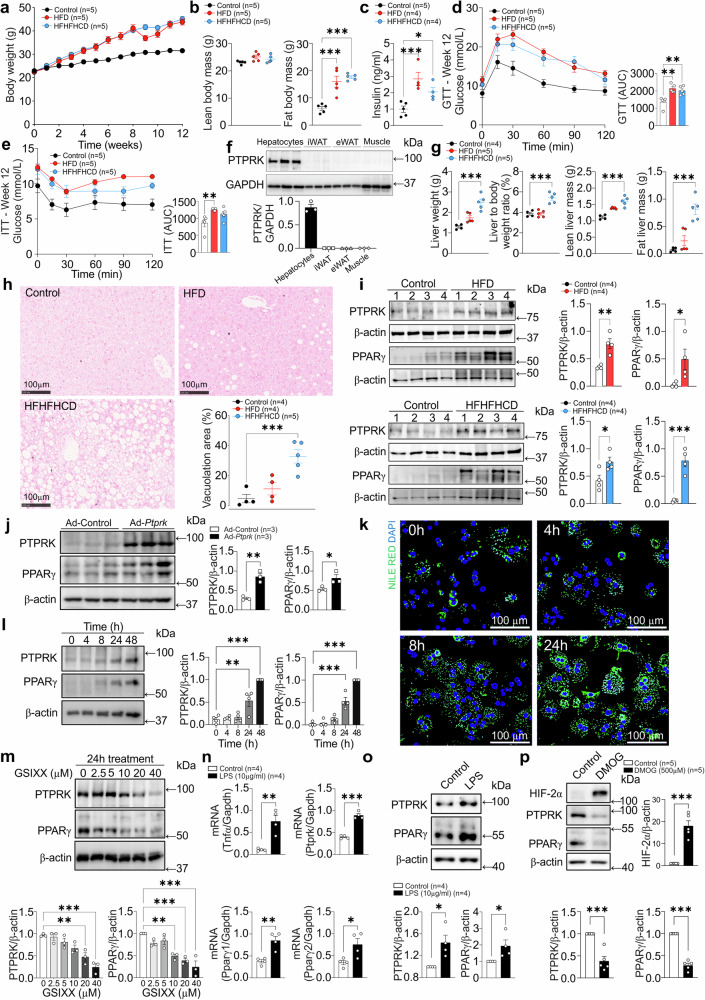
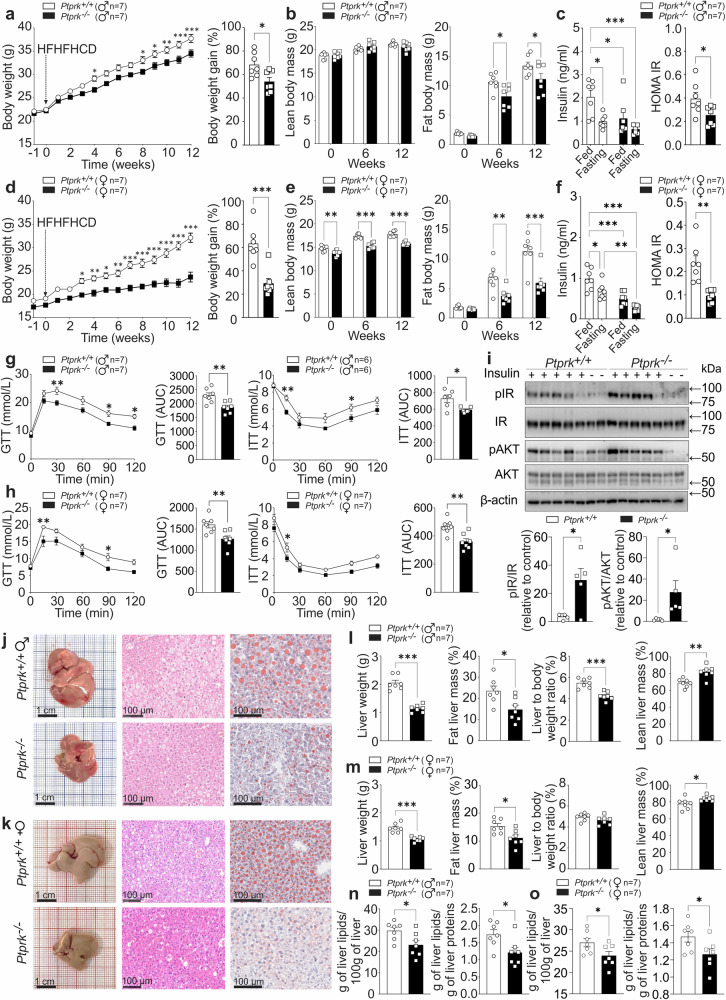
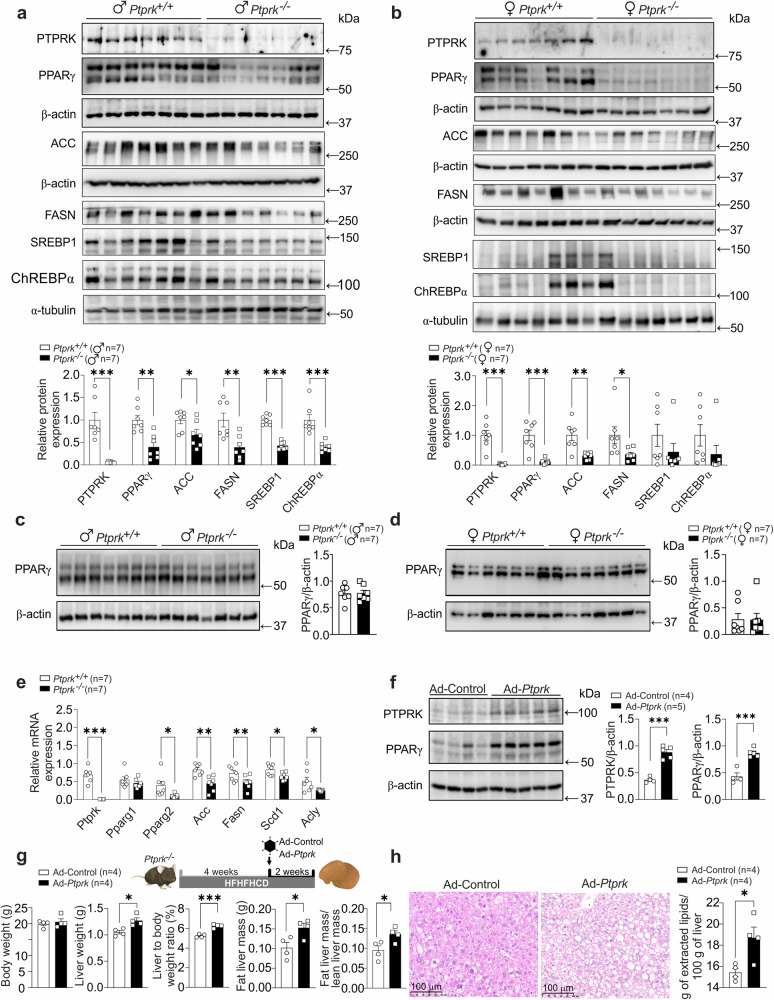
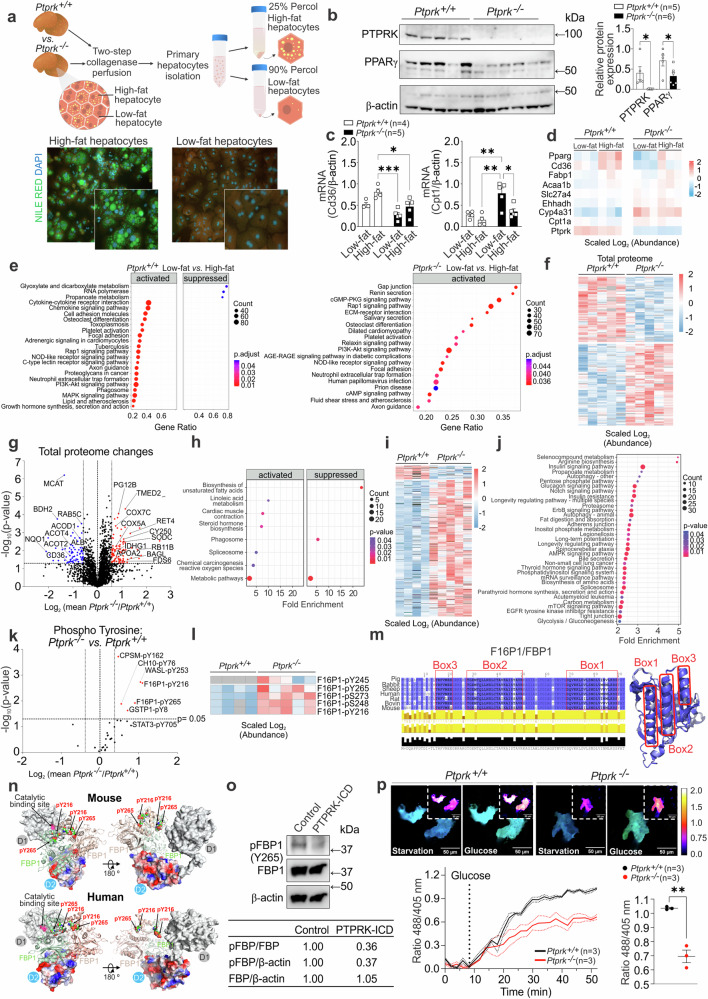
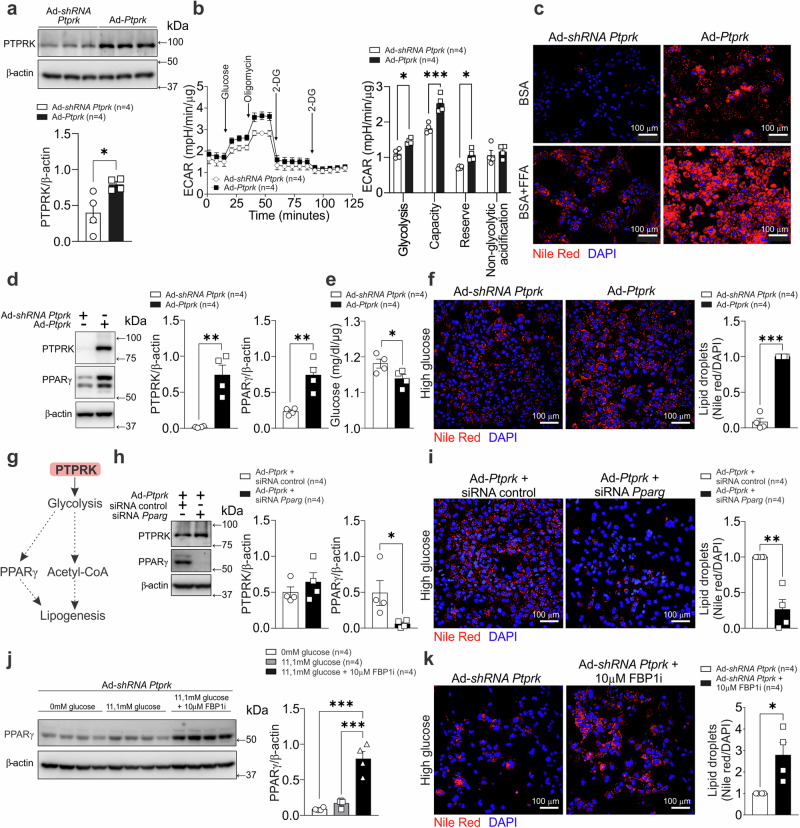
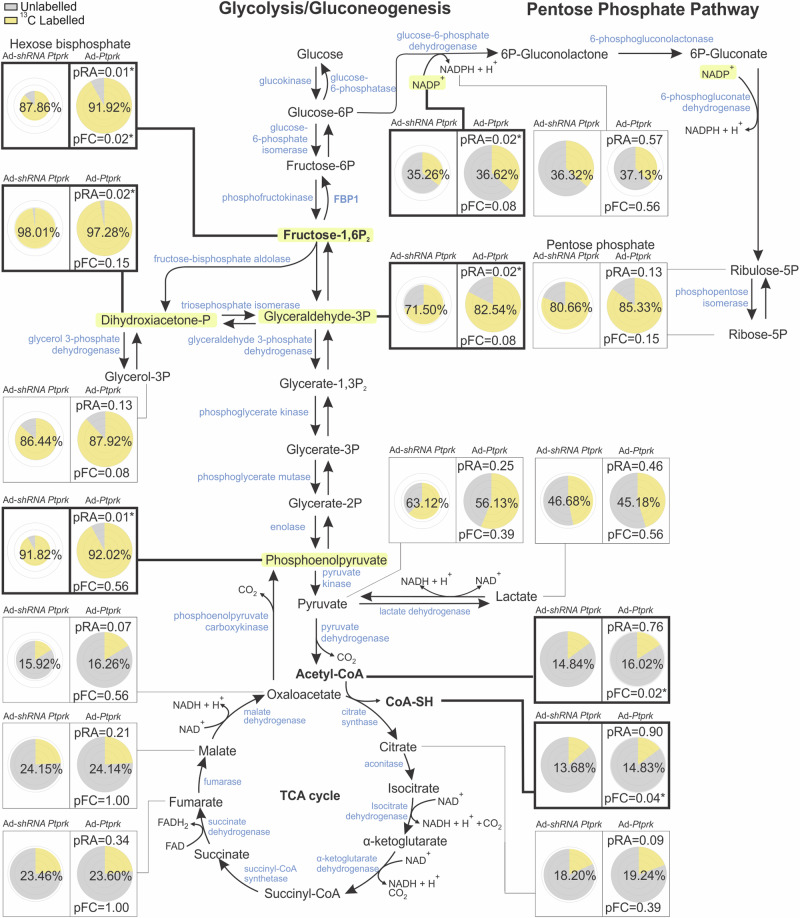
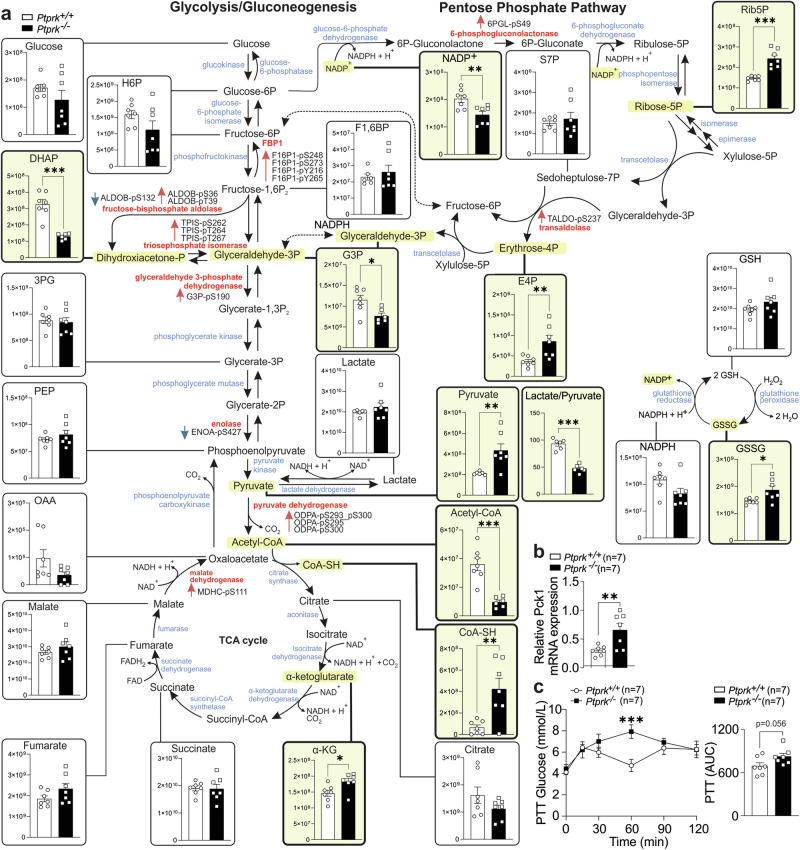
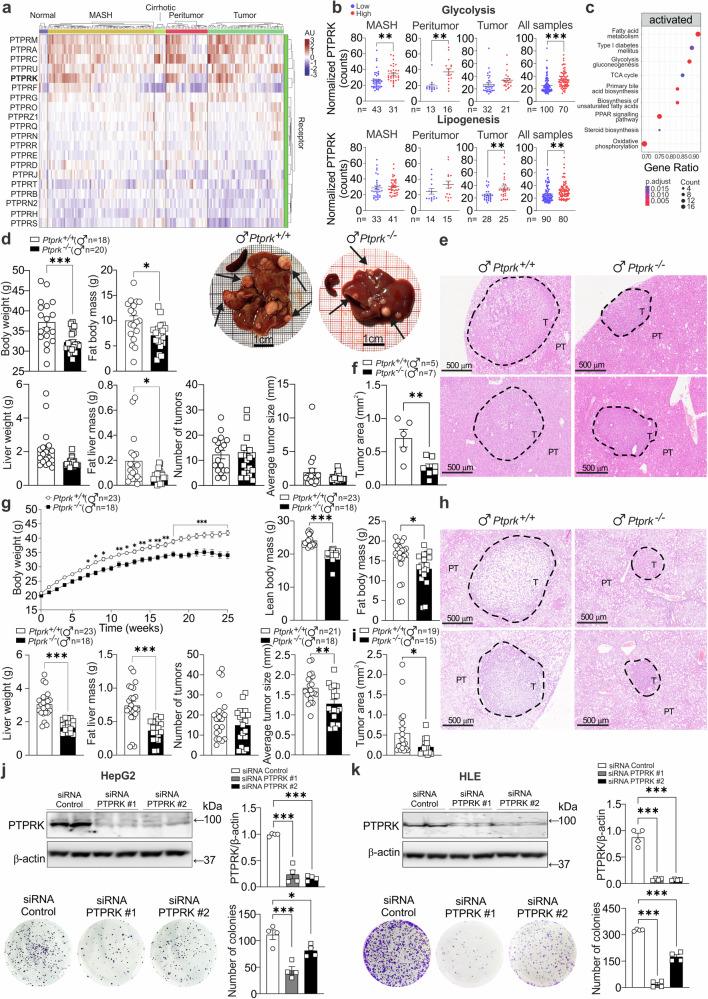
Fat accumulation, de novo lipogenesis, and glycolysis are key drivers of hepatocyte reprogramming and the consequent metabolic dysfunction-associated steatotic liver disease (MASLD). Here we report that obesity leads to dysregulated expression of hepatic protein-tyrosine phosphatases (PTPs). PTPRK was found to be increased in steatotic hepatocytes in both humans and mice, and correlates positively with PPARγ-induced lipogenic signaling. High-fat-fed PTPRK knockout male and female mice have lower weight gain and reduced hepatic fat accumulation. Phosphoproteomic analysis in primary hepatocytes and hepatic metabolomics identified fructose-1,6-bisphosphatase 1 and glycolysis as PTPRK targets in metabolic reprogramming. Mechanistically, PTPRK-induced glycolysis enhances PPARγ and lipogenesis in hepatocytes. Silencing PTPRK in liver cancer cell lines reduces colony-forming capacity and high-fat-fed PTPRK knockout mice exposed to a hepatic carcinogen develop smaller tumours. Our study defines the role of PTPRK in the regulation of hepatic glycolysis, lipid metabolism, and tumour development in obesity.


Conflict of interest statement

D.C.H. is a founder, director and shareholder in Stimuliver ApS and Stemnovate Limited. E.H.G., J.A.E. and E.N.G. are inventors of the patent “USES OF PROTEIN TYROSINE PHOSPHATASE RECEPTOR KAPPA INHIBITORS” submitted by the Université libre de Bruxelles and the Universidad Miguel Hernández de Elche (EP23382162.7, status pending). The manuscript demonstrates the interest of Protein Tyrosine Phosphatase Receptor Kappa as drug target for the treatment of HCC and therefore provides background support for the development of inhibitors targeting this specific PTP. The patent application is itself however focused on such specific PTPRK inhibitors which are not disclosed in the manuscript. The pending patent application is disclosed even if no direct impact of the publication is expected on the value of the patent application. The remaining authors declare no competing interests. E.N.G. declares that there are no other relationships or activities that might bias, or be perceived to bias, the present work.

Figures

Fig. 1
Fig. 1. Enhanced PTPRK expression in human livers with steatosis or metabolic dysfunction-associated steatohepatitis (MASH).
a Methodological approach schematic illustrating the quantification of protein tyrosine phosphatase (PTP) profile and total proteome in human livers. b Quantification of lipid metabolism-related proteins using label-free quantification (LFQ) in healthy (H, n = 3), steatosis (S, n = 4) and MASH (M, n = 4) livers. c Schematic representation of receptor-type PTP (RPTP)s and their characteristic domains. RPTPs detected by mass spectrometry are indicated in red. d Heat map showing the hepatic PTP profile. e Spectral counts of total PTPs and the proportional contribution of receptor and non-receptor PTPs (H: n = 3; S: n = 4; M: n = 6; HCC: n = 3). f The proportional protein contribution of PTPRK and other receptor PTPs to the total identified PTPs is shown (H: n = 3; S: n = 4; M: n = 6; HCC: n = 3). g Data extracted from the GSE192740 single-cell RNA-seq dataset showing receptor PTP mRNA expression in liver cells. h Data extracted from the E-MEXP-3291 dataset showing RPTP mRNA levels using genome-wide microarray analysis and presented as box plots showing median with whiskers at minimum and maximum values (H: n = 19; S: n = 10; M: n = 16). i Representative immunohistochemistry (IHC) images displaying PTPRK staining and quantitative results for nuclear PTPRK (H: n = 4; S: n = 6; M: n = 4). Scale bar = 25 μm. j Cellular localization of recombinant PTPRK in HepG2 cells. Representative confocal images showing the full-length (top row) and intracellular domain (ICD, bottom row) of PTPRK protein tagged with mGreenLantern (GFP, green). Nuclei were stained with DAPI (blue). Scale bar = 50 μm. In b, e, f, i results are shown as means ± SEM. Statistical analyses were done using one-way ANOVA (b, e, f, i) or Kruskal–Wallis test (h) and denoted as *p < 0.05, **p < 0.01, ***p < 0.001. Source data are provided as a Source Data file.
Fig. 2
Fig. 2. Hepatocyte PTPRK is induced by Notch signaling and LPS, correlating positively with PPARγ in obese mouse models and primary hepatocytes.
ae 8-week-old male C57BL6N mice were fed either a high-fat diet (HFD) or a high-fat high-fructose high-cholesterol diet (HFHFHCD) for 12 weeks. a Body weight was measured weekly, b body composition, and c fasting insulinemia were measured after 12 weeks of feeding. Mice underwent d glucose and e insulin tolerance tests after 12 weeks of diet. f Primary hepatocytes, inguinal white adipose tissue (iWAT), epididymal white adipose tissue (eWAT), and gastrocnemius (muscle) from 3 mice per group were harvested for immunoblot analysis. g The livers of the mice fed HFHFHCD and HFD for 12 weeks were extracted and assessed for hepatic weight and composition. h Histological analysis was conducted to quantify hepatic vacuolation area. Scale bar = 100 μm. i Immunoblot analysis shows hepatic levels of PTPRK and PPARγ. j 8-week-old male C57BL6N mice receiving a chow (control) diet were transduced with an adenoviral vector to induce PTPRK overexpression (Ad-Ptprk). Two weeks later, immunoblot analysis was performed in liver samples to assess the levels of PTPRK and PPARγ. k Primary mouse hepatocytes were cultured overnight under standard conditions and fixed at different time points for Nile Red and DAPI staining. Scale bar = 100 μm. l Immunoblot analysis was performed on primary mouse hepatocytes collected at different time points as indicated (n = 4). m Primary mouse hepatocytes were cultured overnight and treated with different concentrations of GSIXX (n = 3). Immunoblot analysis was used to evaluate the expression of PTPRK and PPARγ. n, o Primary mouse hepatocytes were cultured overnight and treated with lipopolysaccharide (LPS) for 24 h. Gene expression was analyzed by quantitative PCR (n) or immunoblotting (o). p Primary mouse hepatocytes were cultured overnight and treated with dimethyloxalylglycine (DMOG) for 24 h. Immunoblotting was performed for HIF2α, PTPRK, and PPARγ. Each individual value represents independent hepatocyte preparations from different mice. In aj, lp results are shown as means ± SEM. Statistical analyses were done using two-tailed unpaired Student’s t test (i, j, np) or using one-way ANOVA (be, g, h, l, m). Statistical significance is denoted as *p < 0.05, **p < 0.01, ***p < 0.001. Source data are provided as a Source Data file.
Fig. 3
Fig. 3. PTPRK deletion confers protection against diet-induced obesity, insulin resistance, and hepatic steatosis.
ah Male (♂) and female (♀) C57BL6N Ptprk+/+ and Ptprk−/− mice, aged 8 weeks, were subjected to a high-fat, high-fructose, high-cholesterol diet (HFHFHCD) for 12 weeks. Body weight (a, d) was measured weekly. Body composition was measured before (week 0) and after 6 and 12 weeks of HFHFHCD feeding (b, e). Insulinemia was measured after 12 weeks of HFHFHCD feeding in the fed state and after 6 h of fasting (c, f). Glucose and insulin tolerance tests were performed after 12 weeks of HFHFHCD feeding (g, h). i At the end of HFHFHCD feeding, insulin (n = 5) or PBS (n = 2) was administered to female mice 10 min prior to liver collection. Immunoblot analysis was employed to examine the expression of pIR and pAKT in the liver. jo Liver samples were analyzed to assess fat accumulation through histological examination, scale bar = 1 cm or 100 μm as indicated. j, k Measurements of liver weight and composition (l, m), and total liver lipid extraction (n, o). In ai, lo results are shown as means ± SEM. Statistical analyses were done using two-tailed unpaired Student’s t test (gi, ln) or using two-way ANOVA (af). Statistical significance is denoted as *p < 0.05, **p < 0.01, ***p < 0.001. Source data are provided as a Source Data file.
Fig. 4
Fig. 4. PTPRK orchestrates the hepatic expression of metabolic enzymes and transcription factors promoting steatosis in mice fed an obesogenic diet.
a, b Eight-week-old male (♂) and female (♀) C57BL6N Ptprk+/+ and Ptprk−/− mice were exposed to a high-fat, high-fructose, high-cholesterol diet (HFHFHCD) for 12 weeks. Liver samples were analyzed by immunoblotting to examine the protein levels of PTPRK, PPARγ, ACC (Acetyl-CoA Carboxylase), FASN (Fatty Acid Synthase), SREBP1 (Sterol Regulatory Element-Binding Protein 1), and ChREBP (Carbohydrate Response Element-Binding Protein). c, d Subcutaneous (inguinal fat) white adipose tissues were collected for immunoblot analysis of PPARγ. e Female liver mRNA expression of Ptprk, Pparγ, Acc, Fasn, Scd1 (Stearoyl-CoA Desaturase 1), and Acly (ATP Citrate Lyase) was assessed. f Female mice were subjected to HFHFHCD for 4 weeks and were administered an adenoviral vector to induce PTPRK overexpression (Ad-Ptprk). After 2 weeks, liver samples were collected for immunoblot analysis of PTPRK and PPARγ. g Female PTPRK-knockout mice were subjected to HFHFHCD for 4 weeks and subsequently injected with Ad-Ptprk. After an additional 2 weeks of HFHFHCD, body weight was measured, and liver samples were collected for the evaluation of weight and composition. h Liver histological assessment and total lipid extraction were performed after PTPRK overexpression in female mice. Scale bar = 100 μm. In ah results are shown as means ± SEM. Statistical analyses were done using two-tailed unpaired Student’s t test (ah). Statistical significance is indicated as *p < 0.05, **p < 0.01, ***p < 0.001. Source data are provided as a Source Data file.
Fig. 5
Fig. 5. Transcriptome, proteome, and protein phosphorylation changes in primary hepatocytes isolated from livers of Ptprk−/− and Ptprk+/+ mice.
a Methodological approach for isolation of low/high fat hepatocytes from mice fed high-fat, high-fructose, high-cholesterol diet (HFHFHCD) for 6 weeks. b Immunoblot analysis showing PTPRK and PPARγ expression profiles of hepatocytes with high-fat content. c RT-qPCR analysis showing changes in the expression of lipid metabolism-related genes. d RNA-Seq heatmap displaying alterations in PPAR pathway-related genes. e RNA-Seq KEGG pathway enrichment analysis comparing Ptprk+/+ and Ptprk−/− low-fat vs. high-fat hepatocytes. f Total proteome global heatmap showing significantly altered proteins in hepatocytes with high-fat content. g Volcano plot illustrating the changes in the total proteomic profile between Ptprk−/− and Ptprk+/+ high-fat hepatocytes. h Total proteome KEGG pathway enrichment analysis. i Phosphoproteome global heatmap showing significantly altered phosphoproteins. j Phosphoproteome KEGG pathway enrichment analysis. k Volcano plot showing quantification of tyrosine phosphosites in Ptprk−/− and Ptprk+/+ hepatocytes. Phosphosites with over 30% increase in Ptprk−/− cells are indicated in red (p < 0.05). l Heatmap showing phosphopeptides of fructose-1,6-bisphosphatase 1 (F16P1/FBP1) in high-fat hepatocytes. m Schematic representation of different F16P1/FBP1 amino acid sequences, indicating distinct boxes for interaction mapping experiments. The predicted helical regions are showed in the three-dimensional structure on the right side. n Predicted PTPRK-FBP1 interface illustrating the PTPRK-D2 complex (red-blue-gray surface representation of their electrostatic surface potential) interacting with the FBP1 dimer (light green-red), and the proximity of the PTPRK catalytic site with FBP1 phosphotyrosine residues. o Immunoblot analysis of pervanadate-treated mouse hepatocyte lysates incubated with or without the recombinant PTPRK-ICD (ICD: intracellular domain). p HYlight-mediated monitoring of fructose 1,6-bisphosphate dynamics in primary mouse hepatocytes. Solid lines represent the mean across cells, while dots represent the mean ± SEM. Scale bar = 50 μm. In b, c, p results are shown as means ± SEM. Statistical analyses were done using two-tailed unpaired Student’s t test (b, p), two-way ANOVA (c), p value adjusted with Benjamini–Hochberg method (e), Welch’s two-sided t-test (g), modified Fisher Exact p value (h, j), and Welch’s two-sided t-test (permutation-based FDR method with 250 randomizations, k). Statistical significance in b, c, p is indicated as *p < 0.05, **p < 0.01, ***p < 0.001. Source data are provided as a Source Data file.
Fig. 6
Fig. 6. PTPRK overexpression enhances glycolysis and PPARγ-dependent lipid accumulation in primary mouse hepatocytes.
a Primary mouse hepatocytes were cultured and transduced with an adenoviral vector to induce PTPRK overexpression (Ad-Ptprk) or PTPRK silencing (Ad-shRNA Ptprk). Immunoblotting confirmed the modulation of PTPRK expression. b Real-time measurement of the extracellular acidification rate (ECAR) in response to glycolytic modulators revealed changes in glycolytic parameters. c Primary mouse hepatocytes were treated with a mixture of BSA-conjugated fatty acids, palmitate (PA), and oleate (OA) (0.4 mM PA and 0.8 mM OA) for 24 h to simulate triglyceride deposition, followed by Nile Red staining to visualize lipid droplets rich in neutral lipids (triglycerides). Scale bar = 100 μm. d Adenoviral-mediated PTPRK overexpression or knockdown in primary mouse hepatocytes was performed followed by exposure to medium containing high concentration (23.5 mM) of glucose. Immunoblot analysis showing PTPRK and PPARγ protein levels. e Glucose levels in the medium measured after 48 h and normalized by protein content. f The cells were fixed and stained with Nile red to show lipid droplet abundance. Scale bar = 100 μm. g Schematic representation of the postulated PTPRK mechanism in hepatocytes, illustrating its role in modulating glycolytic activity, PPARγ and lipid metabolism. h Primary mouse hepatocytes overexpressing PTPRK were transfected with siRNA targeting PPARγ or control siRNA and cultured with high glucose (23.5 mM) for 24 h. Immunoblot showing transfection efficiency. i Nile red staining was performed to assess lipid droplet accumulation. Scale bar = 100 μm. j Primary mouse hepatocytes were transduced with Ad-shRNA Ptprk and treated as indicated for 48 h. PPARγ protein levels were measured by immunoblot analysis. k Primary mouse hepatocytes were treated with high glucose with or without an FBP1 inhibitor, fixed, and stained with Nile red to visualize lipid droplet abundance. Scale bar = 100 μm. Each individual value represents independent hepatocyte preparations from different mice. In a, b, df, hk results are shown as means ± SEM. Statistical analyses were done using one-way ANOVA (j) or two-tailed unpaired Student’s t test (af, h, i, k). Statistical significance is indicated as *p < 0.05, **p < 0.01, ***p < 0.001. Source data are provided as a Source Data file.
Fig. 7
Fig. 7. Metabolic effects of PTPRK overexpression on glycolytic flux in hepatocytes using 13C6-glucose tracing.
Primary mouse hepatocytes isolated from individual mice (n = 4), were cultured and transduced with an adenoviral vector to induce PTPRK overexpression (Ad-Ptprk) or silencing of PTPRK (Ad-shRNA Ptprk) and 23.5 mM of 13C6 -glucose. Metabolites were extracted and analyzed by MS to quantify isotopologue distributions and contributions, with data corrected for natural abundance and presented as raw abundances normalized to protein content and fractional contributions. Pie chart visualizations by Travis Pies applied to 2 cohorts: Ad-shRNA Ptprk and Ad-Ptprk. For each metabolite, the pie radii correspond to the relative abundance, which can be compared between the cohorts of this metabolite. The concentric circles correspond from center outwards to 0.25, 0.5, 0.75, and 1 time the largest abundance. Both the labeled surface fraction of the pie and the percentage displayed in the middle of each pie reflect the fractional contribution. pRA and pFC indicate significance of the difference in relative abundance (t-test) or fractional contribution (Kruskal–Wallis) with Ad-shRNA Ptprk (* indicates a p value < 0.05). Metabolites exhibiting statistically significant changes are highlighted—light yellow for raw abundance (RA) and bold for fractional contribution (FC). Source data are provided as a Source Data file.
Fig. 8
Fig. 8. Hepatic PTPRK induces metabolic reprogramming in the livers of mice fed an obesogenic diet.
a Untargeted metabolomics analysis was conducted in livers from Ptprk−/− and Ptprk+/+ female mice fed high-fat, high-fructose, high-cholesterol diet (HFHFHCD) for 12 weeks. Metabolites exhibiting statistically significant changes are highlighted (light yellow). The data is presented as raw abundances corrected for sample weight. Enzymes associated with these metabolites, which showed significant differences in the levels of phosphorylated amino acid residues based on the analysis presented in Fig. 5i, are indicated in red. Red arrows near highlighted enzymes indicate increased phosphorylation at the indicated amino acid residues, while blue arrows indicate reduced phosphorylation at the indicated amino acid residues. The sample size was n = 7 for both Ptprk−/− and Ptprk+/+, except for DHAP, G3P, acetyl-CoA, and the lactate/pyruvate ratio in the Ptprk−/− group (n = 6) and for pyruvate, lactate, F1,6BP, and the lactate/pyruvate ratio in the Ptprk+/+ group (n = 6). b qPCR analysis was performed to assess Pck1 mRNA levels in the livers of Ptprk−/− and Ptprk+/+ mice. c Pyruvate tolerance test was conducted in mice fed HFHFHCD for 12 weeks after overnight (16 h) fasting to assess gluconeogenic capacity in response to pyruvate administration. In ac results are shown as means ± SEM and statistical analyses were done using two-tailed unpaired Student’s t test. Statistical significance is indicated as *p < 0.05, **p < 0.01, ***p < 0.001. Source data are provided as a Source Data file.
Fig. 9
Fig. 9. Influence of PTPRK in hepatocellular carcinoma (HCC) development.
a mRNA expression profiling was conducted on human livers from dataset GSE164760 of normal liver, metabolic dysfunction-associated steatohepatitis (MASH), cirrhotic livers, peritumour regions, and hepatocellular carcinoma (HCC) tumors. b Based on the expression levels of PTPRK, samples were categorized as high or low, and the normalized counts of genes involved in glycolysis and lipogenesis were analyzed. c KEGG pathway enrichment analysis was performed specifically on tumor samples with low or high PTPRK expression levels. di Male Ptprk−/− and Ptprk+/+ mice were subjected to diethylnitrosamine (DEN) induction of liver cancer at 2 weeks of age. df Mice were fed a chow diet and tumor development was assessed at 40 weeks of age. Body and liver weigh and composition correspond to Ptprk−/− (n = 20) and Ptprk+/+ (n = 18) mice. gi Male Ptprk−/− and Ptprk+/+ mice were fed a high-fat, high-fructose, high-cholesterol diet (HFHFHCD) at 6 weeks of age, and tumor harvesting was performed after 25 weeks of feeding, at 32 weeks of age. Measurements of body weight, fat body mass, liver weight, and fat liver mass were recorded for Ptprk−/− (n = 18) and Ptprk+/+ (n = 23) mice. Tumors on the surface of the hepatic lobes were counted and measured, considering tumors larger than 0.2 mm. The results are presented as the number of tumors per liver and average tumor size (d, g). Tumor area measurements were performed using hematoxylin-eosin-stained paraffin-embedded liver sections of the left lobe for the identification and measurement of the area of microtumours within the hepatic lobe. Representative hematoxylin-eosin-stained sections show the presence of nodules, scale bar = 500 μm (e, h) and tumor area (f, i). Human hepatoma cell lines HepG2 (j) and HLE (k) were transfected with siRNAs targeting PTPRK or siRNA control (n = 4). Colony-forming capacity was assessed and immunoblot confirmed the knockdown efficiency. In b, d, f, g, ik results are shown as means ± SEM. Statistical analyses were done using p value adjusted with Benjamini–Hochberg method (c), two-tailed unpaired Student’s t test (b, d, f, g, i), or one-way ANOVA (j, k). Statistical significance is indicated as *p < 0.05, **p < 0.01, ***p < 0.001. Source data are provided as a Source Data file.

References

    1. Rinella, M. E. et al. A multi-society Delphi consensus statement on new fatty liver disease nomenclature. Hepatology10.1097/HEP.0000000000000520 (2023). - PubMed
    1. Devarbhavi, H. et al. Global burden of liver disease: 2023 update. J. Hepatol.79, 516–537 (2023). - PubMed
    1. Brahma, M. K. et al. Oxidative stress in obesity-associated hepatocellular carcinoma: sources, signaling and therapeutic challenges. Oncogene40, 5155–5167 (2021). - PMC - PubMed
    1. Talamantes, S. et al. Non-alcoholic fatty liver disease and diabetes mellitus as growing aetiologies of hepatocellular carcinoma. JHEP Rep.5, 100811 (2023). - PMC - PubMed
    1. Huang, D. Q. et al. Hepatocellular carcinoma surveillance—utilization, barriers and the impact of changing aetiology. Nat. Rev. Gastroenterol. Hepatol.10.1038/s41575-023-00818-8 (2023). - PubMed

Publication types

MeSH terms

Substances

Associated data