. 2024 Nov 4;15(1):9518.
doi: 10.1038/s41467-024-53521-w.

Reward recalibrates rule representations in human amygdala and hippocampus intracranial recordings

Affiliations

Reward recalibrates rule representations in human amygdala and hippocampus intracranial recordings

Luis Manssuer et al. Nat Commun. .

Abstract

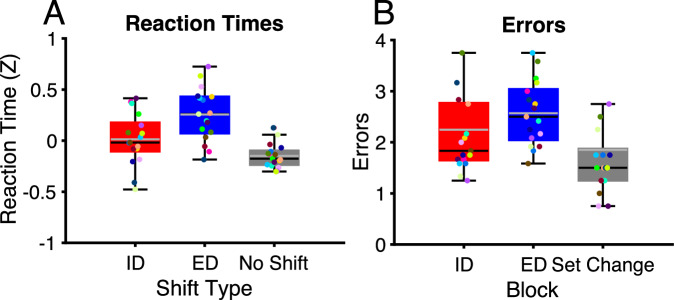
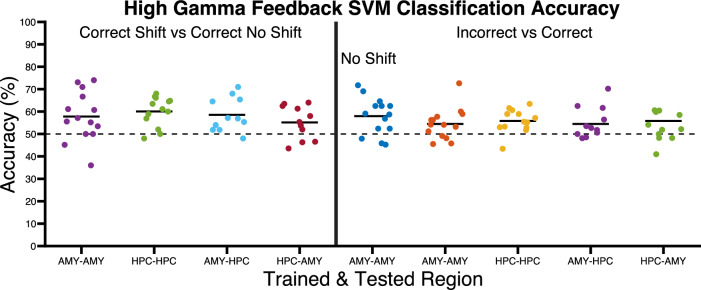
Adaptive behavior requires the ability to shift responding within (intra-dimensional) or between (extra-dimensional) stimulus dimensions when reward contingencies change. Studies of shifting in humans have focused mainly on the prefrontal cortex and/ or have been restricted to indirect measures of neural activity such as fMRI and lesions. Here, we demonstrate the importance of the amygdala and hippocampus by recording local field potentials directly from these regions intracranially in human epilepsy patients. Reward signals were coded in the high frequency gamma activity (HFG; 60-250 Hz) of both regions and synchronised via low frequency (3-5 Hz) phase-locking only after a shift when patients did not already know the rule and it signalled to stop shifting ("Win-Stay"). In contrast, HFG punishment signals were only seen in the amygdala when the rule then changed and it signalled to start shifting ("Lose-Shift"). During decision-making, hippocampal HFG was more inhibited on non-shift relative to shift trials, suggesting a role in preventing interference in rule representation and amygdala HFG was sensitive to stimulus novelty. The findings expand our understanding of human amygdala-hippocampal function and shifting processes, the disruption of which could contribute to shifting deficits in neuropsychiatric disorders.


Conflict of interest statement

The authors declare no competing interests.

Figures

Fig. 1
Fig. 1. Recording sites and EDID task.
A Positions of amygdala and hippocampus contacts that were used for analysis. Different colors represent different patients. B Trial procedure of EDID shifting task. On each trial, patients had to find which one of four stimuli, which varied on two dimensions (letters and shapes), was correct by pressing one of two buttons corresponding to its location on the screen and then monitoring the feedback. Once they had selected the correct stimulus for three trials in a row, it would then change either within (ID) or between (ED) stimulus dimensions. For example, it might change from T to S (ID) or T to ellipse (ED). After six rule changes, a new stimulus set would appear. There were four stimulus sets in total. Two examples of the stimulus sets used are displayed in the top and bottom rows. Two choices were made on each trial so that the superimposition of the letters and shapes could be swapped to allow for calculation of which stimulus the patient believed to be the rule. The choice stimuli were presented for 2.1 s after which a response cue appeared signaling that they could respond. Correct and incorrect feedback was presented for .6 s. See methods for more details.
Fig. 2
Fig. 2. Reaction times and errors in the EDID task.
A Boxplots showing mean and median (gray and black lines) reaction times across ED, ID and no shift conditions with range (whiskers) and inter-quartile range (box). The conditions are determined by patients’ response on each trial relative to the previous trial. Different colored dots represent different patients (N = 17). B Boxplots showing mean and median (gray and black lines) number of errors across ED, ID and set change conditions with range (whiskers) and inter-quartile range (box). Conditions are defined by the type of shift required to complete the block. ID Intradimensional, ED Extradimensional. Source data are provided as a Source Data file.
Fig. 3
Fig. 3. Amygdala high gamma responses to feedback codes win-stay and lose-shift.
A High gamma activity in the amygdala in response to correct feedback on shift and no shift trials (black line represents the mean and shaded regions represent standard error and condition (see legend)). The horizontal black line at the top of the plot represents the time intervals of significant clusters (permutation test, p = .0023, FWEC, two-tailed). Vertical dashed line at t = 0 corresponds to feedback stimulus onset time. The feedback stimulus was presented for 600 ms after which was the inter-trial interval/ fixation. B Difference in mean activity between conditions across patients within significant time points shown in A ordered by size of effect. Horizontal dashed line is the mean difference across all patients. C High gamma activity in the amygdala in response to correct feedback on ED shift and no shift trials (black lines represent mean and shaded regions represents standard error and condition (see legend)). The horizontal black line at the top of the plot represents the time intervals of significant clusters (permutation test, p = .0038, FWEC, two-tailed). D Difference in mean activity between conditions across patients within significant time points shown in (C). E High gamma activity in the amygdala in response to correct feedback on ID shift and no shift trials (black lines represent mean and shaded regions represents standard error and condition (see legend)). The horizontal black line at the top of the plot represents the time intervals of significant clusters (permutation test, p = .0032, FWEC, two-tailed). F Difference in mean activity between conditions across patients within significant time points shown in (E). G High gamma activity in the amygdala in response to correct and incorrect feedback on no shift trials (black lines represent mean and shaded regions represents standard error and condition (see legend)). The horizontal black line at the top of the plot represents the time intervals of significant clusters (permutation test, p = .0049, FWEC, two-tailed). H Difference in mean activity between conditions across patients within significant time points shown in (G). AMY Amygdala, ID Intradimensional, ED Extradimensional. Source data are provided as a Source Data file.
Fig. 4
Fig. 4. Hippocampal high gamma responses to feedback codes win-stay.
A High gamma activity in the hippocampus in response to correct feedback on shift and no shift trials (shaded regions represent standard error and condition (see legend)). The horizontal black line at the top of the plot represents the time intervals of significant clusters (permutation test, p = .0017, FWEC, two-tailed). B Difference in mean activity between conditions across patients within significant time points shown in (A). C High gamma activity in the hippocampus in response to correct feedback on ED shift and no shift trials (black lines represent mean and shaded regions represents standard error and condition (see legend)). The horizontal black line at the top of the plot represents the time intervals of significant clusters (permutation test, p = .0027, FWEC, two-tailed). D Difference in mean activity between conditions across patients within significant time points shown in (C). E High gamma activity in the hippocampus in response to correct feedback on ID shift and no shift trials (black lines represent mean and shaded regions represents standard error and condition (see legend)). The horizontal black line at the top of the plot represents the time intervals of significant clusters (permutation test, p = .023, FWEC, two-tailed). F Difference in mean activity between conditions across patients within significant time points shown in (E). G High gamma activity in the hippocampus on correct and incorrect feedback trials showing effect in the ITI (black lines represent mean and shaded regions represents standard error and condition (see legend)). The horizontal black line at the top of the plot represents the time intervals of significant clusters (permutation test, p = .017, FWEC, two-tailed). H Difference in mean activity between conditions across patients within significant time points shown in (G). HPC hippocampus, ID Intradimensional, ED Extradimensional. Source data are provided as a Source Data file.
Fig. 5
Fig. 5. Multivariate patterns of high gamma activity in response to feedback can be used to predict condition membership.
Scatter graphs showing predictive accuracy of support vector machines’ (SVMs) ability to differentiate feedback conditions when trained and tested on amygdala and hippocampus. The dots on the y axis represent the performance of individual patients’ SVM’s. The x axis shows the train and test region combination. The left panel shows the accuracy of SVM’s when classifying correct shift vs correct no shift conditions. The right panel shows the accuracy of SVM’s when classifying correct vs incorrect conditions on no shift trials specifically and across all incorrect and correct trials. Horizontal lines indicate mean classification accuracy. Fourteen patients were trained and tested using the amygdala, thirteen patients were trained and tested using the hippocampus and eleven patients were tested using amygdala and trained using hippocampus and vice versa. AMY Amygdala, HPC Hippocampus. Source data are provided as a Source Data file.
Fig. 6
Fig. 6. Amygdala and hippocampus activity is synchronized during win-stay via phase-locking in the delta-theta band.
A Time-frequency plots, showing phase-locking values (PLV) between amygdala and hippocampus across correct trials in the shift and no shift conditions. Black outline highlights the significant cluster (permutation test, p = .0015, FWEC, two-tailed). Vertical dashed line at t = 0 corresponds to feedback stimulus onset time. B PLV between amygdala and hippocampus for correct feedback on shift and no shift trials averaged over the frequency range spanned by the significant cluster shown in A (shaded regions represent standard error and condition (see legend)). The horizontal black line at the top of the plot represents the time intervals of significant clusters. C Difference in mean activity between conditions across patients within significant time points shown in A and B ordered by size of effect. Horizontal dashed line represents mean difference. D Network of phase-locking between each pair of channels for the contrast of correct shift vs correct no shift overlaid on the amygdala and hippocampus. The color of the connections represents the magnitude of the difference in phase-locking between correct shift and correct no shift conditions in the significant time window highlighted in panels A and B. AMY Amygdala, HPC Hippocampus, PLV Phase-locking values. Source data are provided as a Source Data file.
Fig. 7
Fig. 7. Hippocampal high gamma activity in the decision phase is inhibited to prevent interference in rule representation.
A High gamma activity in the hippocampus during the decision phase relative to baseline across all trials (black line represents mean and shaded region represents standard error. The horizontal black line at the top of the plot represents the time intervals of significant differences from baseline (Wilcoxon’s signed ranks test, p < .025, FDR corrected, two-tailed). Vertical dashed line at t = 0 corresponds to choice stimulus onset time. The choice phase was 2.1 s. B Mean activity across patients within significant time points shown in A ordered by size of effect. Horizontal dashed line is the mean difference across all patients. C High gamma activity in the hippocampus during the decision phase of shift and no shift trials (black lines represent mean and shaded regions represents standard error and condition (see legend)). The horizontal black line at the top of the plot represents the time intervals of significant clusters (permutation test, p = .0035, FWEC, two-tailed). D Difference in mean activity between conditions across patients within significant time points shown in (C). E High gamma activity in the hippocampus during the decision phase of ID shift and no shift trials (black lines represent mean and shaded regions represents standard error and condition (see legend)). The horizontal black line at the top of the plot represents the time intervals of significant clusters (permutation test, p = .0095, FWEC, two-tailed). F. Difference in mean activity between conditions across patients within significant time points shown in (E). G High gamma activity in the hippocampus during the decision phase of ED shift and no shift trials (black lines represent mean and shaded regions represents standard error and condition (see legend)). The horizontal black line at the top of the plot represents the time intervals of significant clusters (permutation test, p < .015, FWEC, two-tailed). H Difference in mean activity between conditions across patients within significant time points shown in (G). HPC hippocampus, ID Intradimensional, ED Extradimensional. Source data are provided as a Source Data file.
Fig. 8
Fig. 8. Low frequency power in amygdala and hippocampus is involved in decision-making when the rule is known.
A Time-frequency plots showing differences in amygdala theta power in the decision phase between shift and no shift conditions. Black outline highlights the significant cluster (permutation test, p < .001, FWEC, two-tailed). Vertical dashed line at t = 0 corresponds to choice stimulus onset time. The decision phase was 2.1 s. B Theta activity in the amygdala in the decision phase on shift and no shift trials averaged over the frequency range spanned by the significant cluster shown in A (black lines represent mean and shaded regions represents standard error and condition (see legend)). The horizontal black line at the top of the plot represents the time intervals of significant clusters. C Difference in mean activity between conditions across patients within significant time points shown in A and B ordered by size of effect. Horizontal dashed line is the mean difference across all patients. D Time-frequency plots showing differences in hippocampal delta power in the decision phase between shift and no shift conditions. Black outline highlights the significant cluster (permutation test, p = .014, FWEC, two-tailed). E Delta activity in the hippocampus in the decision phase on shift and no shift trials averaged over the frequency range spanned by the significant cluster shown in D (black lines represent mean and shaded regions represents standard error and condition (see legend)). F Difference in mean activity between conditions across patients within significant time points shown in D and E ordered by size of effect. AMY Amygdala, HPC hippocampus, ID Intradimensional, ED Extradimensional. Source data are provided as a Source Data file.
Fig. 9
Fig. 9. High gamma activity in the amygdala codes novelty.
A High gamma activity in the amygdala in the decision phase in the first block (early/ novel) relative to the last block (late/ familiar) after a stimulus set change (black lines represent mean and shaded regions represents standard error and condition (see legend)). Vertical dashed line at t = 0 corresponds to choice stimulus onset time. The horizontal black line at the top of the plot represents the time intervals of significant clusters (permutation test, p = .0024, FWEC, two-tailed). B Mean difference in activity between conditions across patients within significant time points shown in A ordered by size of effect. Horizontal dashed line is the mean difference across all patients. AMY Amygdala. Source data are provided as a Source Data file.
Fig. 10
Fig. 10. Summary of shifting processes in the amygdala and hippocampus.
A Our results suggest HFG win-stay-lose-shift signals occur at transitions between bouts of shifting and staying trials and are controlled by attention. This may have the advantage of being more economical than responding on every trial thereby conserving cognitive and neural resources as the rule needs to be updated less often. Additionally, within bouts of stay trials, delta-theta oscillations in the amygdala and hippocampus are involved in maintaining a signal that the current rule is rewarded and can be used to guide decisions and hippocampus HFG is inhibited to prevent interference in rule representation. B Participants are proposed to adopt two different strategies and attentional sets at different phases of the task as shown by patterns of HFG activity. In the search phase of the task, the amygdala is tuned to attend more to reward feedback (red), at least relative to the staying phase of the task. If reward feedback is received, the correct rule is updated in the hippocampus and patients move to the second strategy of choosing the same stimulus while the amygdala attends more to punishment (blue) relative to reward. Once punishment is received patients change back to the first strategy. Rew Reward, Pun Punishment, WS Win-Stay, LS Lose-Shift.

References

    1. Grant, J. E. & Chamberlain, S. R. Impaired cognitive flexibility across psychiatric disorders. CNS Spectr.28, 688–692 (2023). - PubMed
    1. Izquierdo, A., Brigman, J. L., Radke, A. K., Rudebeck, P. H. & Holmes, A. The neural basis of reversal learning: An updated perspective. Neuroscience345, 12–26 (2017). - PMC - PubMed
    1. Mansouri, F. A., Freedman, D. J. & Buckley, M. J. Emergence of abstract rules in the primate brain. Nat. Rev. Neurosci.21, 595–610 (2020). - PubMed
    1. Dias, R., Robbins, T. W. & Roberts, A. C. Dissociation in prefrontal cortex of affective and attentional shifts. Nature380, 69–72 (1996). - PubMed
    1. Hampshire, A. & Owen, A. M. Fractionating attentional control using event-related fMRI. Cereb. cortex16, 1679–1689 (2006). - PubMed

Publication types