. 2024 Nov 5;10(1):111.
doi: 10.1038/s41421-024-00726-4.

Stem cell transplantation extends the reproductive life span of naturally aging cynomolgus monkeys

Affiliations

Stem cell transplantation extends the reproductive life span of naturally aging cynomolgus monkeys

Long Yan et al. Cell Discov. .

Abstract

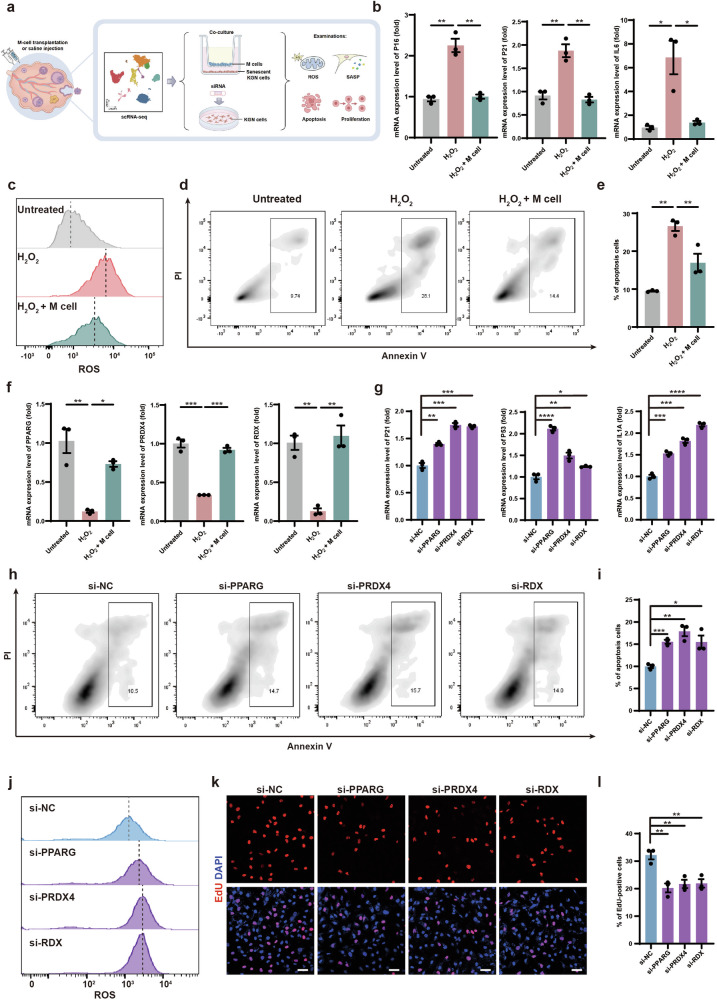
The ovary is crucial for female reproduction and health, as it generates oocytes and secretes sex hormones. Transplantation of mesenchymal stem cells (MSCs) has been shown to alleviate pathological ovarian aging. However, it is unclear whether MSCs could benefit the naturally aging ovary. In this study, we first examined the dynamics of ovarian reserve of Chinese women during perimenopause. Using a naturally aging cynomolgus monkey (Macaca fascicularis) model, we found that transplanting human embryonic stem cells-derived MSC-like cells, which we called M cells, into the aging ovaries significantly decreased ovarian fibrosis and DNA damage, enhanced secretion of sex hormones and improved fertility. Encouragingly, a healthy baby monkey was born after M-cell transplantation. Moreover, single-cell RNA sequencing analysis and in vitro functional validation suggested that apoptosis, oxidative damage, inflammation, and fibrosis were mitigated in granulosa cells and stromal cells following M-cell transplantation. Altogether, these findings demonstrate the beneficial effects of M-cell transplantation on aging ovaries and expand our understanding of the molecular mechanisms underlying ovarian aging and stem cell-based alleviation of this process.


Conflict of interest statement

The authors declare no competing interests.

Figures

Fig. 1
Fig. 1. The ovarian reserve in perimenopausal Chinese women.
a Schematic illustration of the experimental design for follicle counting. b H&E-stained ovarian sections of a 36-year-old (y) woman showed the normal morphology of primordial, primary, secondary, and antral follicles (yellow arrows). Scale bars, 100 μm. c, d Bar graphs illustrated the number of primordial (c) and primary (d) follicles in the 35–52 y women’s ovaries. n = 5 (35–39 y), n = 5 (40–44 y), n = 11 (45–49 y), n = 5 (50–52 y). e H&E-stained ovarian sections of 43 y and 49 y women showed the morphology of secondary follicles. Scale bars, 100 μm. f Bar graph illustrated the number of secondary follicles in the ovaries of 35–52 y. n = 5 (35–39 y), n = 5 (40–44 y), n = 11 (45–49 y), n = 5 (50–52 y).
Fig. 2
Fig. 2. The morphological alterations of ovaries and uteruses in naturally aging monkeys after M-cell transplantation.
a Experimental design for naturally aging cynomolgus monkeys in the control and treated group. b, c Ultrasound observation of the ovaries (b) and statistics of the ovarian diameters (c) before treatment. The yellow frames highlighted the regions zoomed in. White broken circles represented the ovaries. White arrows referred to the maximal widths and maximal lengths of the ovaries. Scale bars, 2 mm. n = 3 monkeys (control), n = 7 monkeys (treated). ns no significance (two-tailed t-test). d, e Ultrasound observation of the ovaries (1 month after treatment) (d) as well as statistics of ovarian diameters in control and treated groups. The final value for each monkey is the average of six measurements taken at 1, 2, 3, 4, 5, and 6 months of treatment (e). The yellow frames highlighted the regions zoomed in. White broken circles represented the ovaries. White arrows referred to the maximal widths and maximal lengths of the ovaries. Scale bars, 2 mm. n = 3 monkeys (control), n = 6 monkeys (treated, except the pregnant monkey T02), *P < 0.05 (two-tailed t-test). f, g Ultrasound observation of the uteri (f) and statistics of the endometrial thicknesses of naturally aging monkeys (g) before treatment. The yellow frames highlighted the regions zoomed in. White broken circles represented the uteri. White arrows referred to the endometrial thicknesses. Scale bars, 5 mm. n = 3 monkeys (control), n = 7 monkeys (treated). ns, no significance (two-tailed t-test). h, i Ultrasound observation of the uteri (4 months after treatment) (h) as well as statistics of endometrial thicknesses in control and treated groups. The final value for each monkey is the average of six measurements taken at 1, 2, 3, 4, 5, and 6 months of treatment (i). The yellow frames highlighted the regions zoomed in. White broken circles represented the uteri. White arrows referred to the endometrial thicknesses. Scale bars, 5 mm. n = 3 monkeys (control), n = 6 monkeys (treated, except the pregnant monkey T02). *P < 0.05 (two-tailed t-test).
Fig. 3
Fig. 3. Transplantation of M cells increased E2 and P4 levels of the naturally aging monkeys.
a Experimental design to test the effects of M-cell transplantation on hormone level and fertility potential of naturally aging monkeys. b Bar graphs illustrated the levels of E2 at the early follicular phase of the menstrual cycle in control and treated monkeys before treatment and after 3-, 6-, 8-month treatment. Before treatment, n = 3 monkeys (control), n = 7 monkeys (treated). After 3- and 6-month treatment, n = 3 monkeys (control), n = 6 monkeys (treated, except the pregnant monkey T02). After 8-month treatment, n = 3 monkeys (control), n = 5 monkeys (treated, except the monkey T02 due to lactation period and T07 due to poor healthy condition during this period), ns no significance, *P < 0.05 (two-tailed t-test). c Line graphs illustrated the P4 level of monkeys before (left panel) treatment and 3 months (right panel) after treatment. Before treatment, n = 3 monkeys (control), n = 7 monkeys (treated). After 3-month treatment, n = 3 monkeys (control), n = 6 monkeys (treated, except the pregnant monkey T02). *P < 0.05 (multiple t-tests). d Line plots illustrated the P4 levels of representative control (C03) (upper panel) and treated (T01) (lower panel) monkeys before treatment and after 3-, 6- and 8-month treatment.
Fig. 4
Fig. 4. M-cell transplantation improved fertility of naturally aging monkeys.
a Schematic diagram showed the experimental design of superovulation. After 5-month treatment, the monkeys were subjected to superovulation and ICSI experiments. b The numbers of oocytes obtained from the indicated monkeys by superovulation and the number of embryos developed to the indicated stages after ICSI. GV germinal vesicle. MI metaphase I, MII metaphase II. c Ultrasonographic of T02 at 5 and 9 weeks of gestation. The white broken circle represented the fetal capsule (left) or fetus (right). Scale bars, 5 mm. d Bar graphs illustrated serum levels of E2 and P4 before pregnancy and after 1-, 2-, and 3 months of pregnancy.
Fig. 5
Fig. 5. M-cell transplantation alleviated ovarian aging.
a Experimental design to test the effects of M-cell transplantation on ovarian aging by histology. b H&E-stained ovarian sections showed growing follicles (black arrows) in the control and treated ovaries after 4-month treatment. Scale bars, 100 μm. c Bar graphs illustrated the numbers of growing follicles in the ovarian sections after 4-, 16-, and 25-month treatment. n = 3 sections, two-tailed t-test. d Masson’s trichrome staining showed fibrosis in the ovarian sections after 4-month treatment. Blue areas denoted collagen fibers (fibrosis). Red areas denoted muscle fibers and cytoplasm. Scale bars, 100 μm. e Bar graphs illustrated the proportion of fibrosis after 4- (left panel), 16- (middle panel), and 25- (right panel) month treatment. n = 3 sections, *P < 0.05, **P < 0.01 (two-tailed t-test). f Immunofluorescence analysis showed the expression of Ki67 in GCs of the treated group and the control group after 4-month treatment. White broken lines showed boundaries of GCs in antral follicles. Scale bars, 50 μm. g Bar graph showed the quantification of Ki67-positive GCs after 4-month treatment. n = 3 sections, *P < 0.05, two-tailed t-test. h Immunofluorescence analysis showed the expression of γH2A.X in GCs of the treated group and the control group after 4-month treatment. White broken lines showed boundaries of GCs in antral follicles. Scale bars, 50 μm. i Bar graph showed the quantification of γH2A.X-positive GCs after 4-month treatment. n = 3 sections, *P < 0.05 (two-tailed t-test).
Fig. 6
Fig. 6. ScRNA-seq analysis unveiled potential regulatory networks and mechanisms underlying ovarian function restoration after M-cell transplantation.
a Uniform manifold approximation and projection embedding visualization for 26,862 single cells from cynomolgus monkey ovarian tissues. b Visualized expression patterns of different cell type-specific genes. The color bar from blue to red indicated the relative expression levels from low to high. c Stacked area plot showed the fraction of major ovarian cell populations in all cynomolgus monkeys. Control group: after 4-month (C-4 m) and 16-month (C-16 m) saline injection; Treated group: after 4-month (T-4 m), 16-month (T-16 m), and 25-month (T-25 m) M-cell transplantation. d GO enrichment analysis of DEGs in granulosa cells of all groups. The color bar from blue to red indicated the P-value from low to high. Dot sizes indicated the gene counts in the corresponding GO item. e GO enrichment analysis of DEGs in stromal cells of all groups. The color bar from blue to red indicated the P-value from low to high. Dot sizes indicated the gene counts in the corresponding GO item. f Left panel: Heatmap showed regulon activity scores of the representative transcriptional regulons in granulosa cells of control and treated groups. Regulon activity scores were calculated by pySCENIC and were scaled for visualization. The color bar indicated the strength of regulon activity, with “High” (red) indicating active regulons and “Low” (blue) indicating inactive regulons. Right panel: Display of binding motifs of certain transcription factors. g, h The representative regulatory network in GCs (g) and SCs (h) of control and treated groups was identified using pySCENIC. Key transcriptional regulons were denoted as large colored circles, and corresponding target genes were denoted as small colored circles. The node size indicated the number of target genes, and the line thickness indicated the weight of the target regulon. The genes marked in red are implicated in alleviating ovarian aging.
Fig. 7
Fig. 7. Effects of M cells on senescent GCs.
a Schematic graphic showed in vitro validation of molecular mechanisms of M-cell transplantation for alleviating ovarian aging. b RT-qPCR analyses of P16 (left panel), P21 (middle panel), and IL6 (right panel) expression levels in KGN cells of the untreated group, H2O2 group, and H2O2 + M cells group. n = 3, *P < 0.05, **P < 0.01 (two-tailed t-test). c Flow cytometry analysis showed cellular ROS levels in KGN cells of the untreated group, H2O2 group, and H2O2 + M cells group. d Flow cytometry analysis showed the cell apoptosis of KGN cells in the untreated group, H2O2 group, and H2O2 + M cells group. The frames denoted the proportions of apoptosis. e Bar graph illustrated the apoptotic rates of KGN cells in the untreated group, H2O2 group, and H2O2 + M cells group. n = 3. **P < 0.01 (two-way ANOVA). f RT-qPCR analyses of PPARG (left panel), PRDX4 (middle panel), and RDX (right panel) expression level in KGN cells of the untreated group, H2O2 group, and H2O2 + M cells group. n = 3, *P < 0.05, **P < 0.01, ***P < 0.001 (two-way ANOVA). g RT-qPCR analyses of P21 (left panel), P53 (middle panel), and IL1A (right panel) in KGN cells after knockdown of PPARG, PRDX4, and RDX. n = 3, *P < 0.05, **P < 0.01, ***P < 0.001, ****P < 0.0001 (two-tailed t-test). h Flow cytometry analysis showed apoptosis of PPARG-, PRDX4-, and RDX-knockdown KGN cells. The frames denoted the proportions of apoptotic cells. i Bar graph illustrated the apoptotic rates of PPARG-, PRDX4-, and RDX-knockdown KGN cells. n = 3. *P < 0.05, **P < 0.01, ***P < 0.001 (two-tailed t-test). j Flow cytometry analysis showed cellular ROS levels in PPARG-, PRDX4-, and RDX-knockdown KGN cells. k Immunofluorescence analysis showed the EdU-positive KGN cells after PPARG, PRDX4, and RDX knockdown. Scale bars, 50 μm. l Bar graph showed the proportion of EdU-positive KGN cells after PPARG, PRDX4, and RDX knockdown. n = 3, **P < 0.01 (two-tailed t-test).
Fig. 8
Fig. 8. The possible mechanisms underlying the beneficial effects of M-cell therapy.
Schematic diagram showed that M cells may ameliorate ovarian aging partially by decreasing the inflammation and fibrosis, as well as promoting the angiogenesis, follicular development, and sex hormone secretion.

References

    1. Tu, W. et al. Deciphering the dynamics of the ovarian reserve in cynomolgus monkey through a quantitative morphometric study. Sci. Bull.67, 1854–1859 (2022). - PubMed
    1. Smith, P., Wilhelm, D. & Rodgers, R. J. Development of mammalian ovary. J. Endocrinol.221, R145–R161 (2014). - PubMed
    1. Zhang, H. & Liu, K. Cellular and molecular regulation of the activation of mammalian primordial follicles: somatic cells initiate follicle activation in adulthood. Hum. Reprod. Update21, 779–786 (2015). - PubMed
    1. te Velde, E. R. & Pearson, P. L. The variability of female reproductive ageing. Hum. Reprod. Update8, 141–154 (2002). - PubMed
    1. Broekmans, F. J., Soules, M. R. & Fauser, B. C. Ovarian aging: mechanisms and clinical consequences. Endocr. Rev.30, 465–493 (2009). - PubMed

LinkOut - more resources